How to explain why organic clicks dropped
How to use SEO Stack to identify where clicks were lost and to understand the cause.
If a client tells me their organic clicks are down, the first thing I want to know is which pages used to get those clicks and what people searched for to find them. Analysing click loss requires a bit of time and diagnostic capabilities, so in this KB I am going to show you the things you can do.
I made a video to go with the KB:
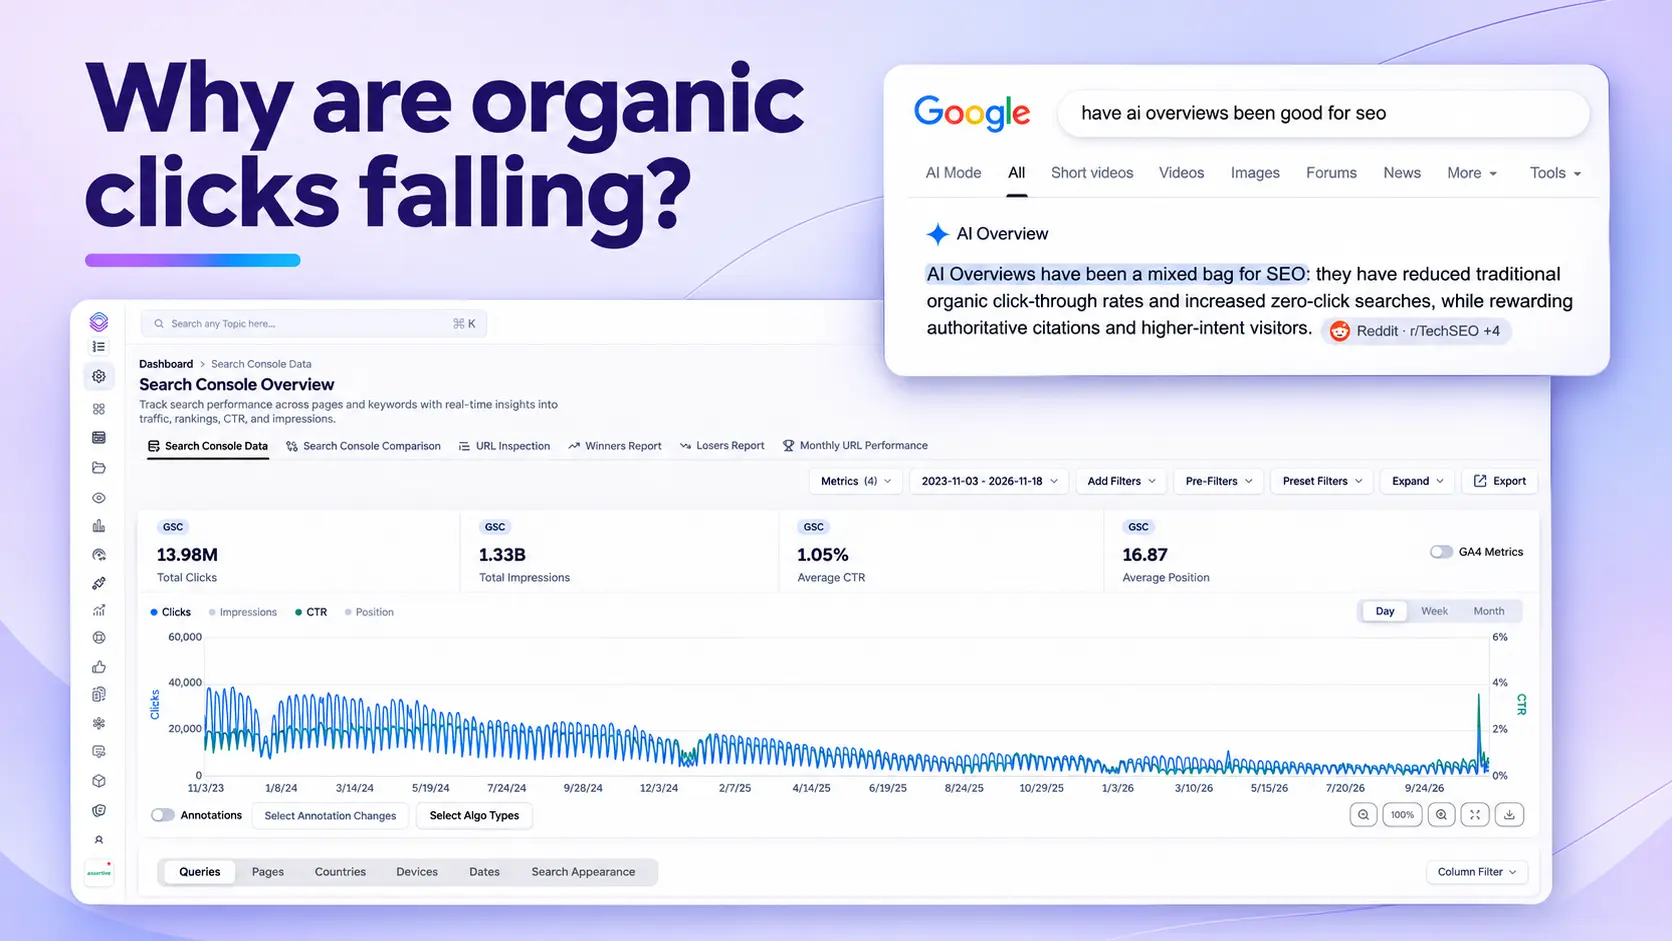
Now, I also suggest you take a look at this blog I wrote, it actually shows you a lot of the considerations around click loss such as click loss due to CTR erosion (Google's AI overviews), click loss due to position slippage or overall site/content devaluation, all of these are applicable when trying to undertand why organic clicks dropped.
 image
If a client comes to me and highlights click loss or ranking loss, the first thing I’ll usually do is analyse their Search Console data to get an understanding of which queries and pages have lost ground and whether there’s an obvious point of decline, i.e. did clicks start to fall during a Google core update? Each scenario may warrant its own analysis. If the decline followed a site migration, for example, I’d want to know where the old URLs redirect and whether the new pages picked up the queries that previously drove clicks.
For this walkthrough I’m using riderguide.com. In May and June 2025 the site was getting around 70,000 organic clicks a month. By August it was getting around 10,000. I’m going to show you how I’d work back from that drop to the pages that accounted for it, then use query counting to establish what happened to the rankings on the page that lost the most clicks.
1. Set the date range to First Data Point and find the decline
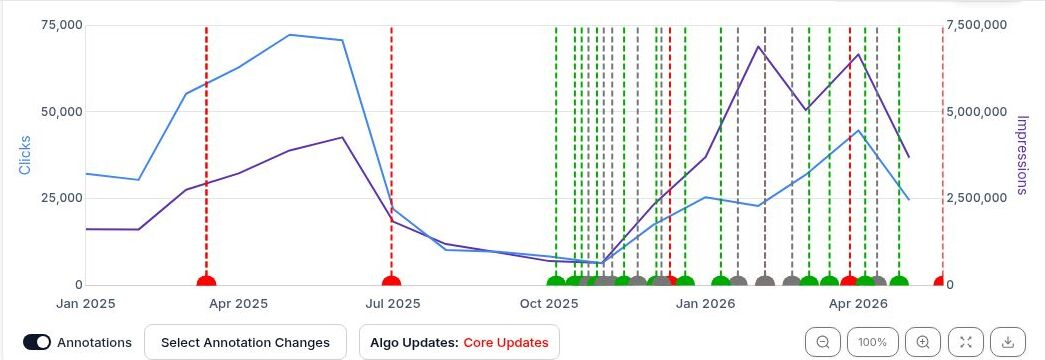
In SEO Stack, select your website property and go to SEO Workspace → Search Console Data. Click the date selector and choose First Data Point. For RiderGuide this takes us back to 1 January 2025. Select Month above the chart and follow the blue Clicks line, using the scale on the left.
You can see clicks build from March, reach their highest level in May and remain close to that level in June. July is the first month where there’s a substantial drop and clicks continue to fall into August. Under the chart, open Select Algo Types and tick Core Updates. The marker at the end of June falls between the two very different levels of traffic.
 image
The blue line shows RiderGuide’s monthly clicks. May and June are the high point before the June 2025 core update marker and the decline in July.
Google’s June core update ran from 30 June to 17 July 2025. Switch to Week to see how quickly the loss developed. I’d also check the site annotations and ask the client what changed on the website over those dates. The timing gives us a specific update to investigate. We still need to see which searches and pages lost visibility. Google’s June 2025 core update record
2. Compare the high-traffic period with the period after the update
Open Search Console Comparison, click the date selector and choose Custom. Set the first range to 1 August–29 October 2025 and the compare to range to 1 April–29 June 2025. That gives us 90 days on each side. The earlier period includes the May and June peak and ends the day before rollout. The later period begins after the rollout has finished and covers the sustained decline.
| RiderGuide property | 1 Apr–29 Jun | 1 Aug–29 Oct | Change |
|---|---|---|---|
| Organic clicks | 203.44K | 27.81K | −86.33% |
| Impressions | 11.24M | 2.79M | −75.14% |
| CTR | 1.81% | 1.00% | −0.81 percentage points |
| Average position | 11.17 | 17.69 | 6.52 places lower |
Across the property we’ve lost roughly 175,600 clicks. Impressions are down by three quarters and average position has moved from 11.17 to 17.69. At this point I want to know how much of the loss comes from a small number of URLs, because those are the pages I’ll take through to the query count analysis.
3. Sort the pages by click loss and export them
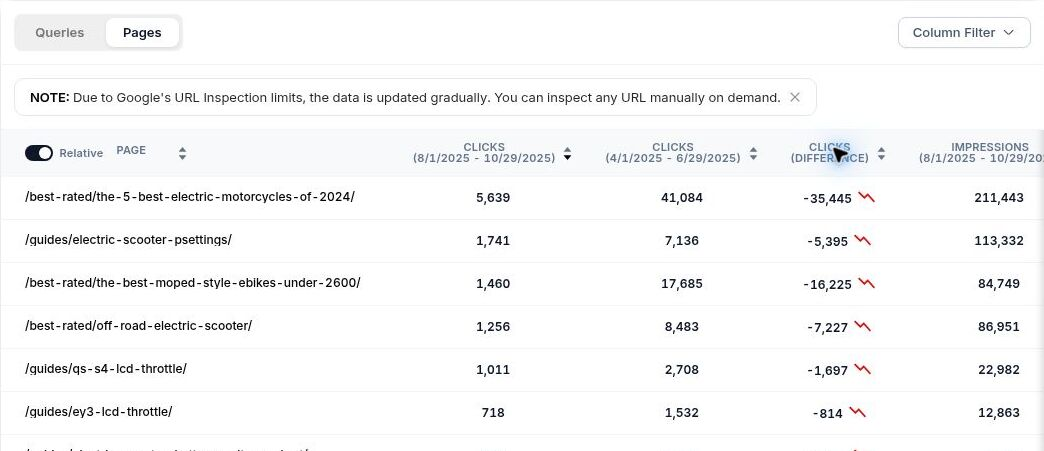
Below the chart, click Pages and sort by Clicks (Difference) until the largest negative figure appears first. Check the dates above the columns. For the electric motorcycle guide, the later period shows 5,639 clicks and the earlier period shows 41,084, giving us a difference of −35,445.
 image
The Pages report shows the two date ranges above their respective click columns. Use Clicks (Difference) to order the losses.
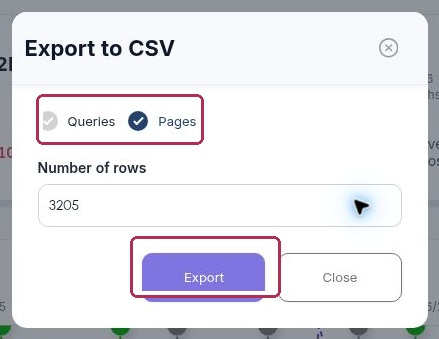
Turn off Relative to see the full URLs, then choose Export → CSV. Tick Pages, clear Queries for this export, select Max and click Export.
 image
Check the Pages box in the CSV dialog before exporting. The maximum row count depends on the property and dates.
4. Filter the export to the URLs that lost clicks
Import the CSV into Google Sheets using File → Import → Upload. Select the full data range, including the headers, and go to Data → Create a filter. Open the filter on Clicks (Difference), select Filter by condition → Less than, enter 0 and click OK. Sort that column A → Z. If you only have the two click columns, calculate later clicks minus earlier clicks in a new column and apply the filter there.
These are the first three URLs I’d take from the RiderGuide comparison. All three are buying guides under /best-rated/, so we can look at a group of pages that serve a similar purpose.
| Buying guide | Peak-period clicks | Post-update clicks | Clicks lost |
|---|---|---|---|
| Electric motorcycles | 41,084 | 5,639 | 35,445 |
| Moped-style e-bikes | 17,685 | 1,460 | 16,225 |
| Folding electric bikes | 15,341 | 592 | 14,749 |
Between them they account for 66,419 lost clicks, or roughly 38% of the property’s net decline. Copy the three full URLs from the sheet, one per line.
5. Save the pages as KEY URLS LOST
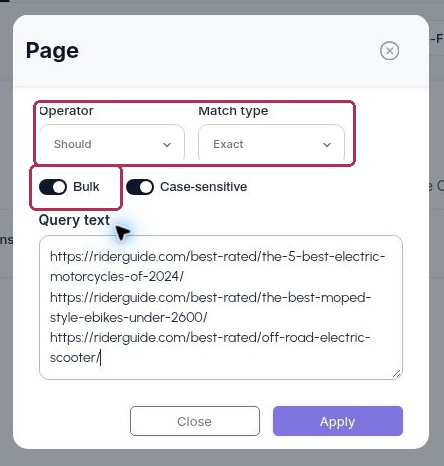
Go back to Search Console Data → Add Filters → Page…. Set the operator to Should, the match type to Exact and switch Bulk on. Paste the URLs into the text box. Should lets any one of the three URLs match, while Exact keeps the data specific to the address you copied.
 image
The Page filter on RiderGuide. Should includes a match for any listed URL, Exact limits each rule to that URL, and Bulk accepts one value per line.
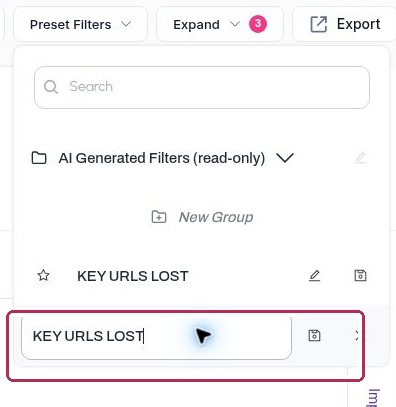
Click Apply and open Expand to check the three page rules. Under Preset Filters → + New Preset Filter, enter KEY URLS LOST and click the save icon. If you already have a preset with that name, check the URLs in it before using it for a different decline.
 image
Name the preset and click the save icon to the right of the title field.
6. Run the URL Query Count analysis on the largest losing page
Go to SEO Workspace → Data Tools → URL Query Count Tool. Open Preset Filters to retrieve your saved group. To work through one page, select the full motorcycle guide URL in Search for URL and check the active rules under Expand. For the figures below I used just this page, /best-rated/the-5-best-electric-motorcycles-of-2024/.
Start with Total Queries and Clicks
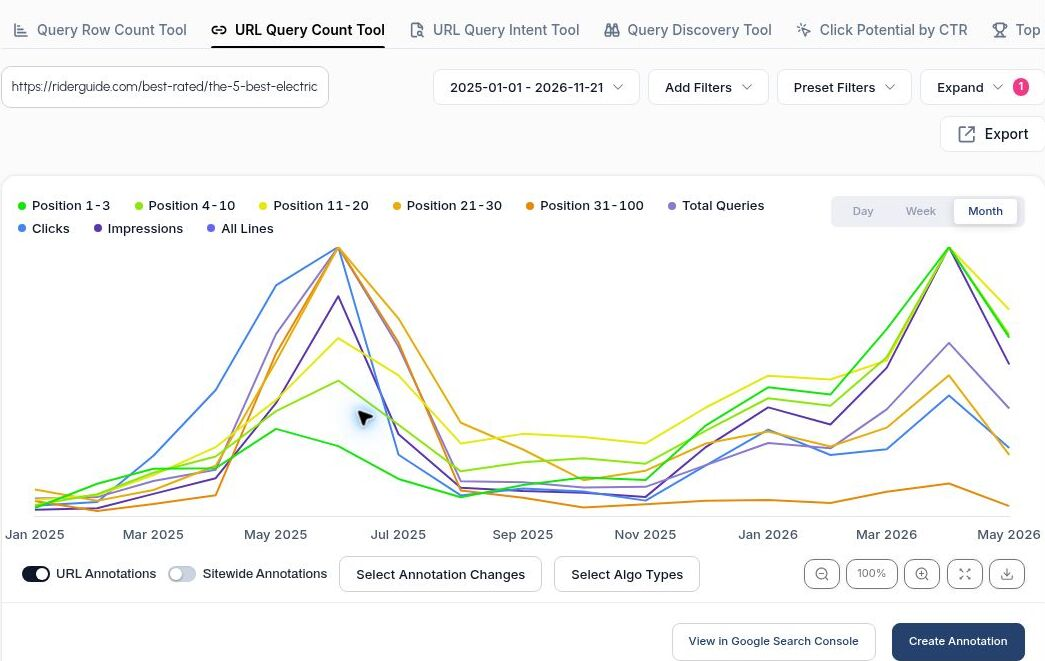
Choose First Data Point and Month. Use the chart legend to follow Total Queries alongside Clicks. Scroll below the query list to the table headed Vol of Queries and find the June, July and August columns. Read across the Total Queries row. This tells you how many different queries the tool recorded for this URL in each month. Read the Clicks row for the same months.
 image
The motorcycle guide selected in URL Query Count Tool. Month shows the build-up into June 2025 and the drop through July and August.
| Motorcycle guide | June 2025 | July 2025 | August 2025 |
|---|---|---|---|
| Total queries | 17,710 | 11,150 | 2,315 |
| Queries in positions 1–3 | 1,396 | 744 | 379 |
| Queries in positions 4–10 | 2,997 | 2,021 | 994 |
| Clicks | 14,439 | 3,303 | 1,124 |
In June the guide appeared for 17,710 reported queries. By August that count was down to 2,315, a reduction of 15,395. Now read the Position 1–3 row. The guide had 1,396 queries in the top three in June and 379 in August. We’ve lost visibility across a much wider range of searches, including 1,017 fewer queries recorded in positions 1–3. Use the Total Queries row directly. Adding the position bands or adding monthly counts together can count the same query more than once.
Switch to Week to see when the rankings dropped
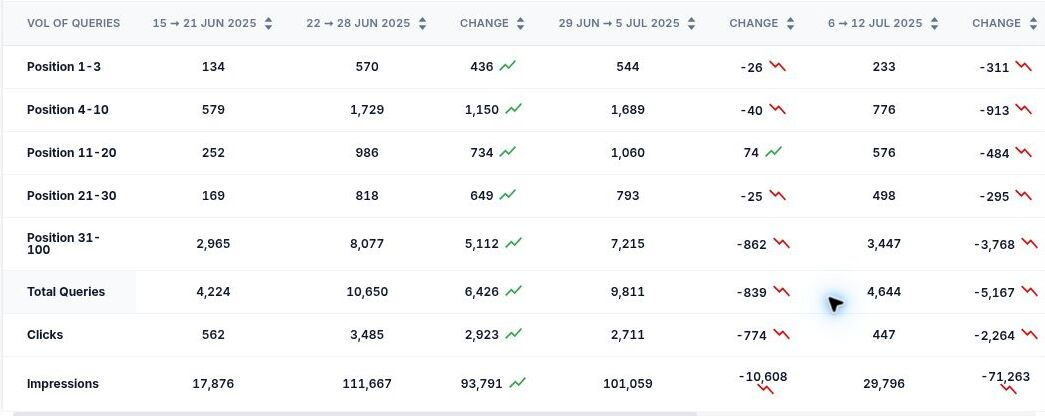
Click Week and scroll across the table to 22–28 June, the last complete week before rollout. Read that column first, then move across one week at a time. The Change column is the difference from the previous week. For an update that runs across parts of two months, this is where you can see when most of the damage happened.
 image
Read down each week for Position 1–3, Total Queries and Clicks. From 29 June–5 July to 6–12 July the guide lost 5,167 reported queries and 2,264 clicks.
| Motorcycle guide | 22–28 Jun | 29 Jun–5 Jul | 6–12 Jul | 13–19 Jul |
|---|---|---|---|---|
| Total queries | 10,650 | 9,811 | 4,644 | 1,522 |
| Positions 1–3 | 570 | 544 | 233 | 98 |
| Positions 4–10 | 1,729 | 1,689 | 776 | 481 |
| Clicks | 3,485 | 2,711 | 447 | 237 |
| Impressions | 111,667 | 101,059 | 29,796 | 16,375 |
Look at 6–12 July. In a single week, clicks dropped from 2,711 to 447, the number of queries in positions 1–3 dropped from 544 to 233, and positions 4–10 also fell, from 1,689 to 776. If the main issue had been queries slipping a few positions, I’d look for those same terms further down page one. Here the total query count more than halved that week and fell again the following week. That gives us two things to investigate on this URL, the searches it stopped appearing for and the searches where it continued to appear at a lower position.
7. Check which queries were lost and which slipped
Return to Search Console Comparison, keep the same two 90-day periods, and apply an Exact page filter for the motorcycle guide. Click Queries and sort by Clicks (Difference). Export the query rows with both periods’ clicks, impressions and average position. Work down the queries that accounted for the most clicks before the decline.
-
For queries that previously ranked in positions 1–3, check the later position for the same query and URL. A term moving from position 2 to position 8 with impressions in both periods is a confirmed example of ranking slippage. Record the clicks that term lost and repeat for the remaining top-three terms.
-
For queries with earlier impressions and no later row, remove the page filter and search for the exact query across the property. If another RiderGuide URL now earns those impressions, record which page took over. If neither URL shows impressions, group the missing queries by topic and check demand, page indexability and canonicalisation before drawing a content conclusion.
-
For queries that held their position, compare impressions and CTR using the same country and device. If impressions held up and CTR dropped, check historical search results for a change in layout or a new feature. If impressions fell with little change in position or CTR, check whether fewer people searched for that topic over the later period.
There’s a good reason to do this on the motorcycle guide. Its page-level average position actually improved from 21.23 to 15.09 across the two 90-day periods, while it lost 35,445 clicks. Lower-ranking terms disappearing can improve the average for the terms left in the report. The weekly query count shows what the page average hides, and matching the individual terms tells you which rankings actually moved.
8. Use the lost queries to decide what to audit
I’d start with the motorcycle guide, then repeat the same analysis for the moped-style and folding e-bike guides. For each page I’d pull the version that was live before the decline and compare it with the current page. Check the HTTP response, redirects, Google-selected canonical and internal links first. Then group the lost queries by what the rider wanted to know, i.e. road legality, range, outright performance or suitability for a particular rider.
For each group, look at which pages gained those rankings and what they give the reader. On a buying guide I’d check whether the recommendations cover the models people were searching for, who actually tested them, what was measured, and whether the prices, availability and specifications were accurate at the time. If the page recommends a bike on the basis of range, can the reader see the measured range, rider weight and test conditions? Where GA4 tracking is available, I’d also check whether mobile visitors could use the comparison table and follow the product links. Record the specific change against the queries it’s intended to help, then annotate the release so you can measure it against the same URLs.
How I’d explain the drop to the client
RiderGuide’s organic clicks fell by 86.33% between the spring peak period and the 90 days we measured after the June 2025 core update. Three buying guides accounted for 66,419 lost clicks. The electric motorcycle guide was the largest contributor, and its sharpest weekly fall came during the rollout. By the week of 13–19 July it appeared for 1,522 queries, down from 10,650 in the last full week before rollout. Over those same weeks its top-three query count fell from 570 to 98. I’d prioritise that guide and work through its former click-driving queries to establish which rankings slipped, which searches stopped generating impressions and whether any moved to another RiderGuide page.