Search Console Comparison: find what changed between two periods
Compare clicks, impressions, CTR and position across queries and pages, and distinguish absolute changes from percentage changes.
Search Console Comparison shows search performance for two periods side by side. It helps you move from a headline change to the queries and pages contributing to it.
Use it for regular reporting, investigating a traffic decline, reviewing a page update or comparing seasonal performance. It measures differences; it does not prove what caused them.
Open and configure the report
- Open SEO Workspace → Search Console Data.
- Select Search Console Comparison in the horizontal tool navigation.
- Open the comparison-date button above the metric cards.
- Choose a previous-period or year-over-year comparison.
- Check the actual dates displayed on the cards and table headings.
- Select Queries or Pages, depending on the question you want to answer.
The reviewed date menu offered 7 days, 28 days, 3 months, 6 months and 12 months against either the previous period or the equivalent period a year earlier. It also exposed a Custom option with two date ranges.
Use a previous-period comparison to investigate a recent change. Consider year-over-year context when seasonal demand could affect the result. Keep the website and filters consistent.
Read the metric cards
Each card shows the current-period value, comparison-period value and a percentage Change. Clicks, Impressions, Average CTR and Average Position have checkboxes for the chart.
Read the current and previous values before interpreting the sign. Higher clicks usually indicate more traffic. A numerically higher average position means a worse average position, so a positive position percentage is not automatically an improvement.
In the tested 28-day comparison, clicks rose from 186 to 223, while average position moved from 12.07 to 12.18. The clicks improved; the numerical average position became slightly worse. Both can happen together because the mix of searches changes.
Read the table differences
The table provides current, previous and Difference columns for clicks, impressions, CTR and position. Use Column Filter to reduce the visible columns if the table is too wide, or scroll horizontally to review the remaining metrics.
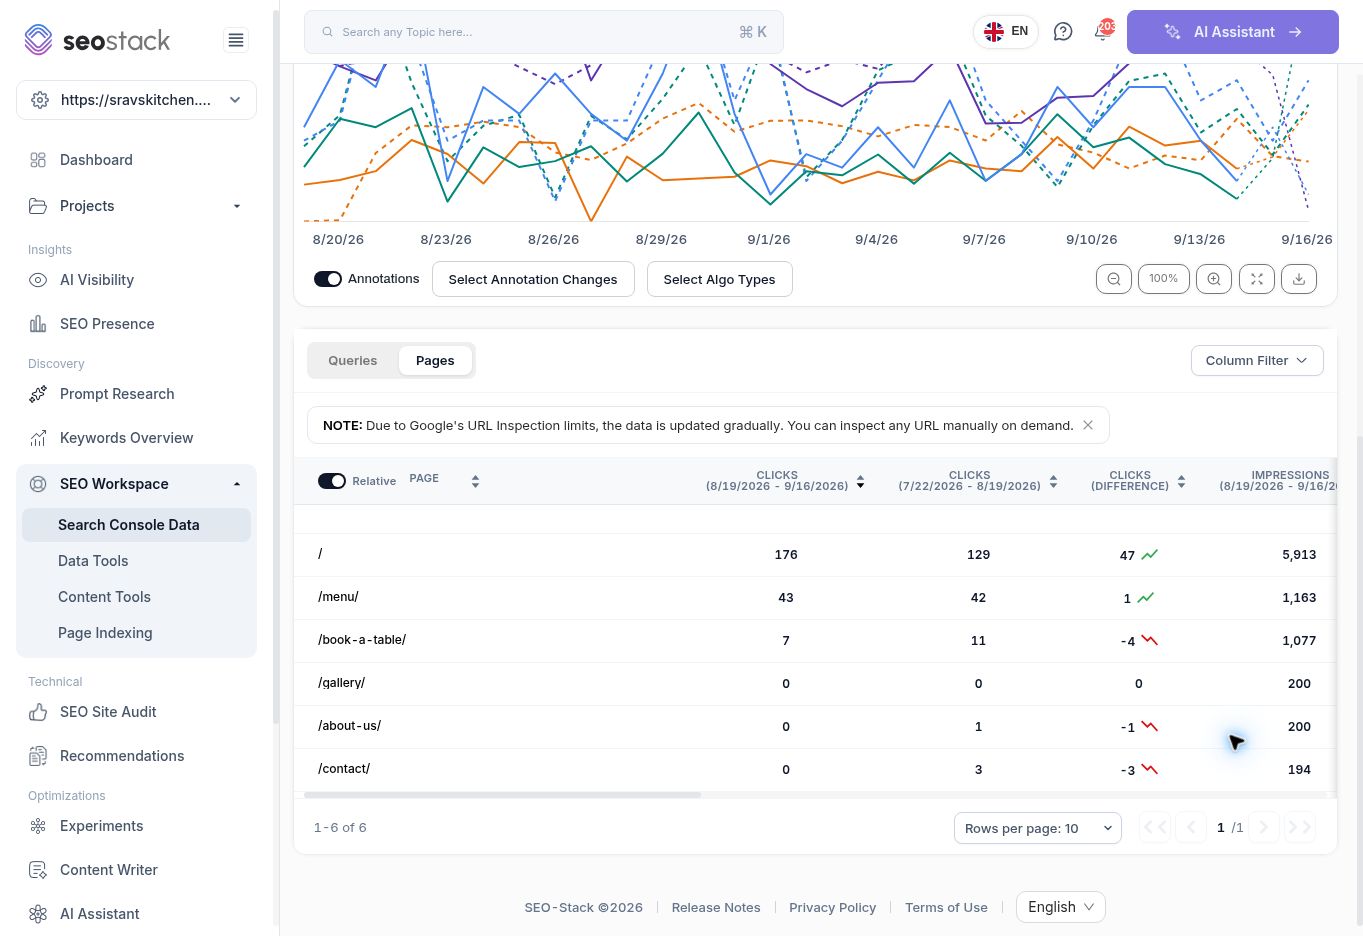 Page comparison showing the two periods and click differences.
| Example from the report | Interpretation |
|---|---|
| Homepage clicks: 176 versus 129; Difference 47 | 47 more clicks in the selected current period. |
| Booking-page clicks: 7 versus 11; Difference -4 | Four fewer clicks, even though the site overall gained clicks. |
| Booking-page CTR: 0.65% versus 1.04%; Difference -0.39% | A fall of 0.39 percentage points. This is not the same as a 0.39% relative decrease. |
| Booking-page position: 3.6 versus 4.5; Difference -0.9 | The numerical average position improved by 0.9, despite fewer clicks. |
The table's CTR difference and the headline card's percentage change are different calculations. For example, CTR changing from 2% to 3% is an increase of 1 percentage point and a 50% relative increase.
Find which pages explain a traffic change
- Select Pages.
- Sort Clicks (Difference) to identify the largest gains or losses.
- Review both periods' absolute clicks alongside the difference.
- Compare impressions, CTR and position for the same page.
- Investigate the page's queries in Search Console Data.
- Check whether the pattern also appears in a relevant country, device or query segment.
For the booking-page example, clicks fell while impressions rose slightly and average position improved. A blanket explanation that the page lost rankings would not fit these aggregate figures. Investigate the underlying queries, result presentation and demand mix before assigning a fix.
Compare a specific segment
Use Add Filters to narrow the report and Expand to review active filters. Preset Filters is also available. Keep the same segment when comparing periods, and check that the resulting rows match your intended scope.
For example, reviewing a service-page group separately can reveal a decline hidden by strong branded homepage traffic. Reviewing brand queries separately can help distinguish brand demand from broader discovery.
Use the chart as context
The chart offers Day, Week, Month, annotation controls, algorithm-type controls, zoom, fullscreen and an image-download control. Add Annotation is also present.
Use event dates to form a hypothesis, then investigate the data. A change following an annotation is not proof that the annotated work caused it. Avoid judging a long-running change from a single low-volume day.
Before reporting a conclusion
- Record both date ranges, the website, dimension and active filters.
- Separate absolute gains from relative percentage changes.
- Check for a small or zero comparison baseline.
- Compare meaningful query or page groups, not only a site-wide average.
- Allow tables to finish loading after changing dates or dimensions.
Use Winners Report and Losers Report when you want a prepared shortlist of growing or declining queries and pages. Export is visible in this report; its downloaded output was not verified in this walkthrough.
More in Search Console
Search Console Data: analyse queries, pages and search traffic
Filter Google Search Console data, inspect individual pages and turn search performance into practical SEO actions.
ReadWinners Report: find queries and pages gaining clicks
Identify growing queries and pages, examine their monthly trends and decide which improvements to investigate or extend.
ReadLosers Report: investigate declining queries and pages
Find pages and queries losing clicks, distinguish large losses from small-baseline percentage changes, and build a focused investigation list.
ReadMonthly URL Performance: review page traffic over time
Read the monthly URL matrix to identify sustained gains, declines and pages needing further investigation.
Read