For ecommerce & enterprise
Your catalogue has 40,000 URLs. Google shows you 1,000 of them.
Ecommerce SEO tools built on your own data. Every query and every page warehoused with no row limits and no 16-month cliff, GA4 revenue and transactions rendered alongside, and an AI analyst that will build you a sales report, a conversion audit or a category breakdown on request.
Works with
- Shopify
- WooCommerce
- Magento
- BigCommerce
- and anything with a Search Console property
14 day trial · Cancel anytime · No contracts · No BigQuery, nothing to configure
Trusted by leading companies
The reality
What a large catalogue does to your data
None of these are skill problems. They are all consequences of running a catalogue that is larger than the reporting Google gives you for it, on a business that is judged over years rather than months.
The long tail is the revenue, and it sits behind a wall
Product-specific queries convert better than anything else and they sit far below the top thousand rows, so on a large catalogue the row cap hides precisely the part of the demand curve that sells.
Search Console DataYou cannot compare this season to the one before last
Retail is judged year on year, and a rolling sixteen-month window means peak trading gets measured against a single prior year that may well have been an anomaly.
Date comparisonCategory pages drift informational
You added a buying guide to the listing page and Google started serving it for research queries instead of purchase ones, so the rankings still look healthy and the revenue does not.
URL Query IntentProduct decay is invisible until the quarter closes
Individual product pages fade one at a time, and the site total holds flat for months while several hundred products underneath it are already dying.
Monthly URL PerformanceOrganic gets compared to paid on paid's terms
Shopping and PPC report revenue per pound spent, while organic reports clicks in one tool and revenue in another, and a join done by hand in a spreadsheet does not survive a board pack.
SEO PresenceFaceted navigation bloated the index while you were busy
Filters, variants, sort parameters and discontinued lines, thousands of URLs earning nothing, and an inspection cap of two thousand a day that makes checking them properly impossible.
Weak & Dead URLsEvery URL
No row cap, on a catalogue where that is the whole problem
Every query, page, country, device and search appearance arrives without truncation, which on a large catalogue is the difference between seeing your bestsellers and seeing your demand curve.
Where the demand actually sits
184,000 queries across a 40,000-URL catalogue, ordered by clicks
1 – 100
Brand and top categories
41,200
101 – 1,000
Category and range terms
63,800
1,001 – 5,000
Sub-category and attribute terms
78,500
5,001 – 20,000
Product and model terms
96,200
20,001 – 60,000
Variant, size and spec terms
84,600
60,001 – 184,000
Long tail, one or two sessions each
61,300
Inside the top 1,000 rows
25%
105,000 of 425,600. This is everything Google's export will give you.
Below the cap
75%
320,600, warehoused in full, filterable by subfolder and exportable without a row limit.
An illustrative distribution rather than a customer's figures. The shape is the point: on a large catalogue the head is small, the money is spread across the tail, and the cut-off falls in the wrong place.
Filtering built for catalogue structure
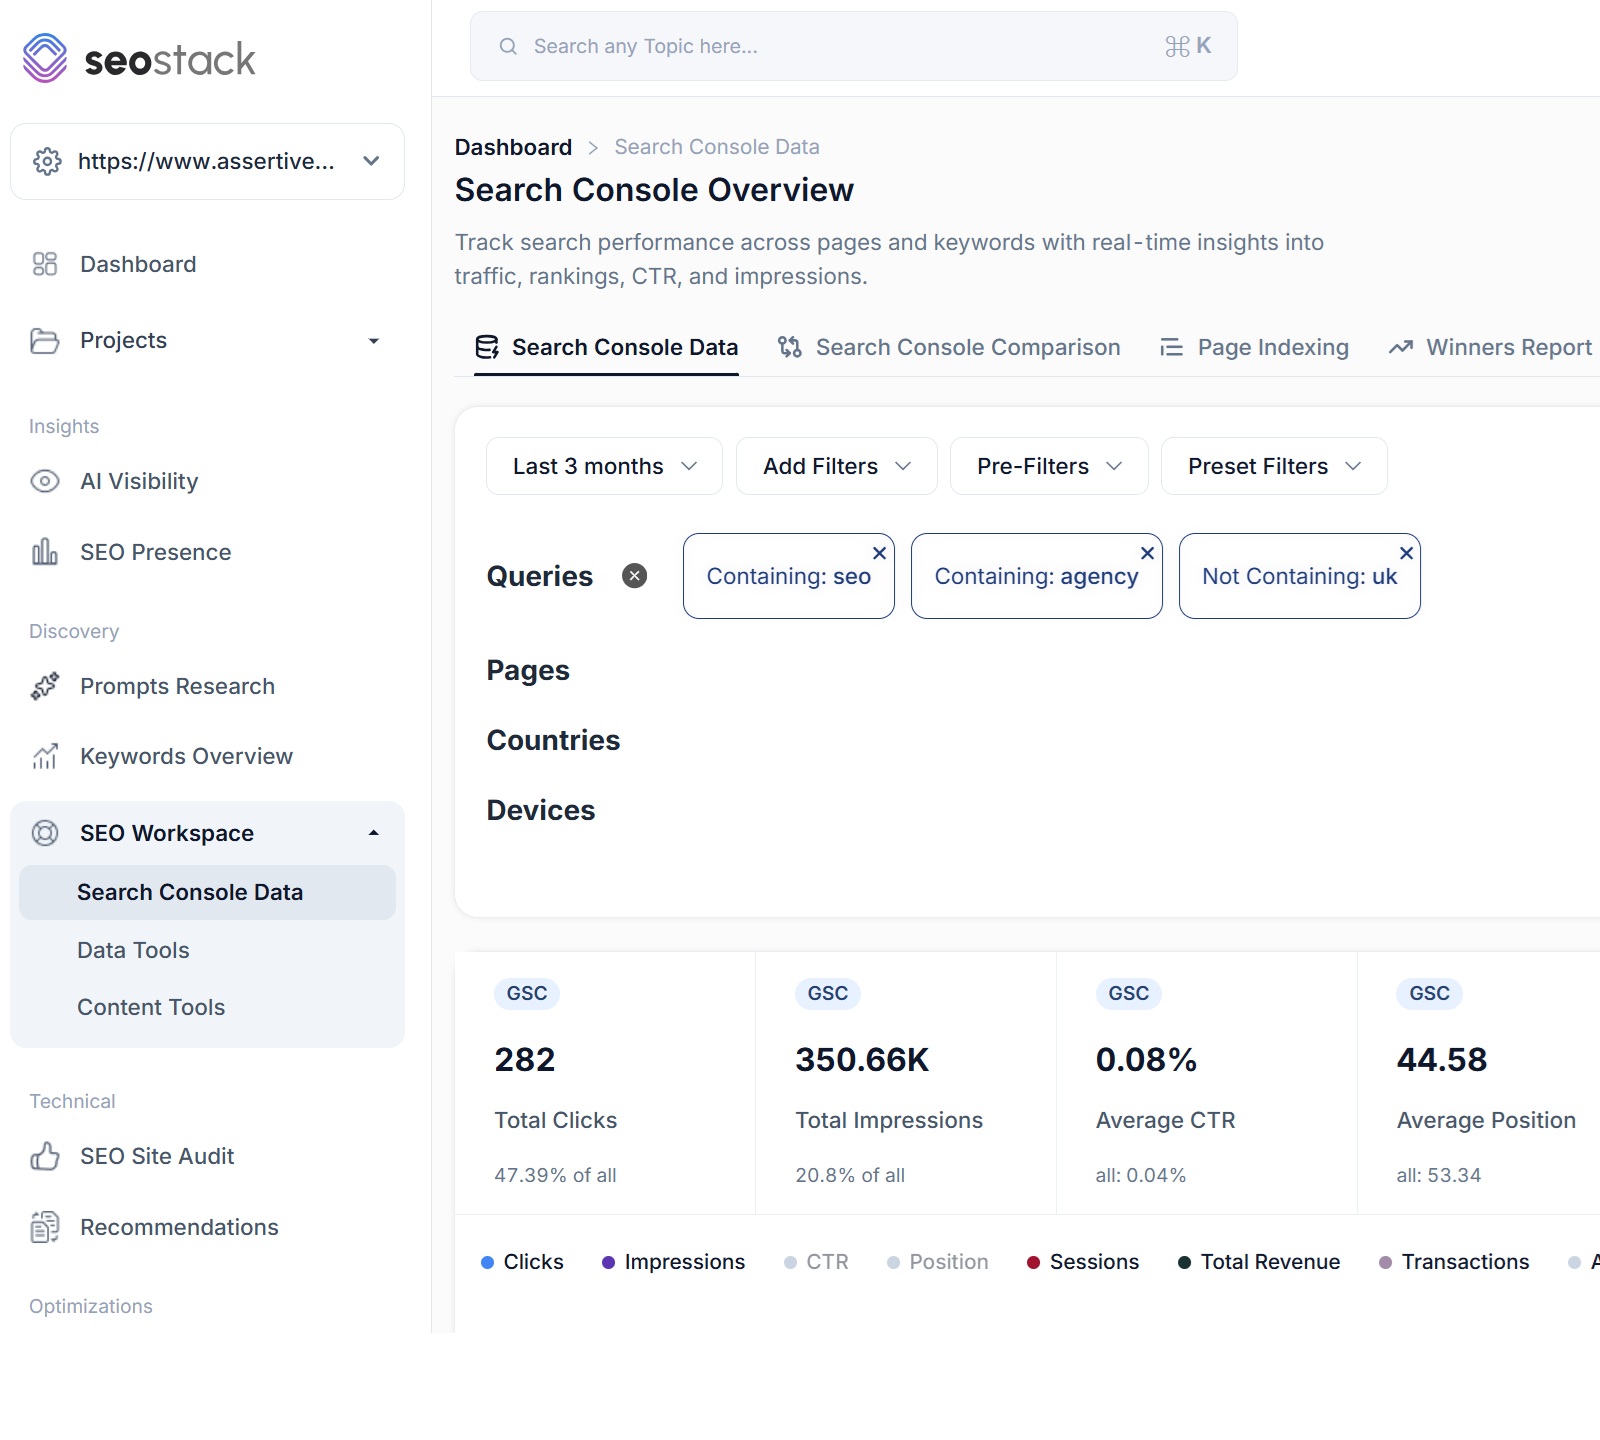
Up to a thousand layered filters with MUST and SHOULD logic, regex, negations and starts or ends with, so isolating /collections/ while excluding ?variant= is one view rather than an afternoon in a spreadsheet.
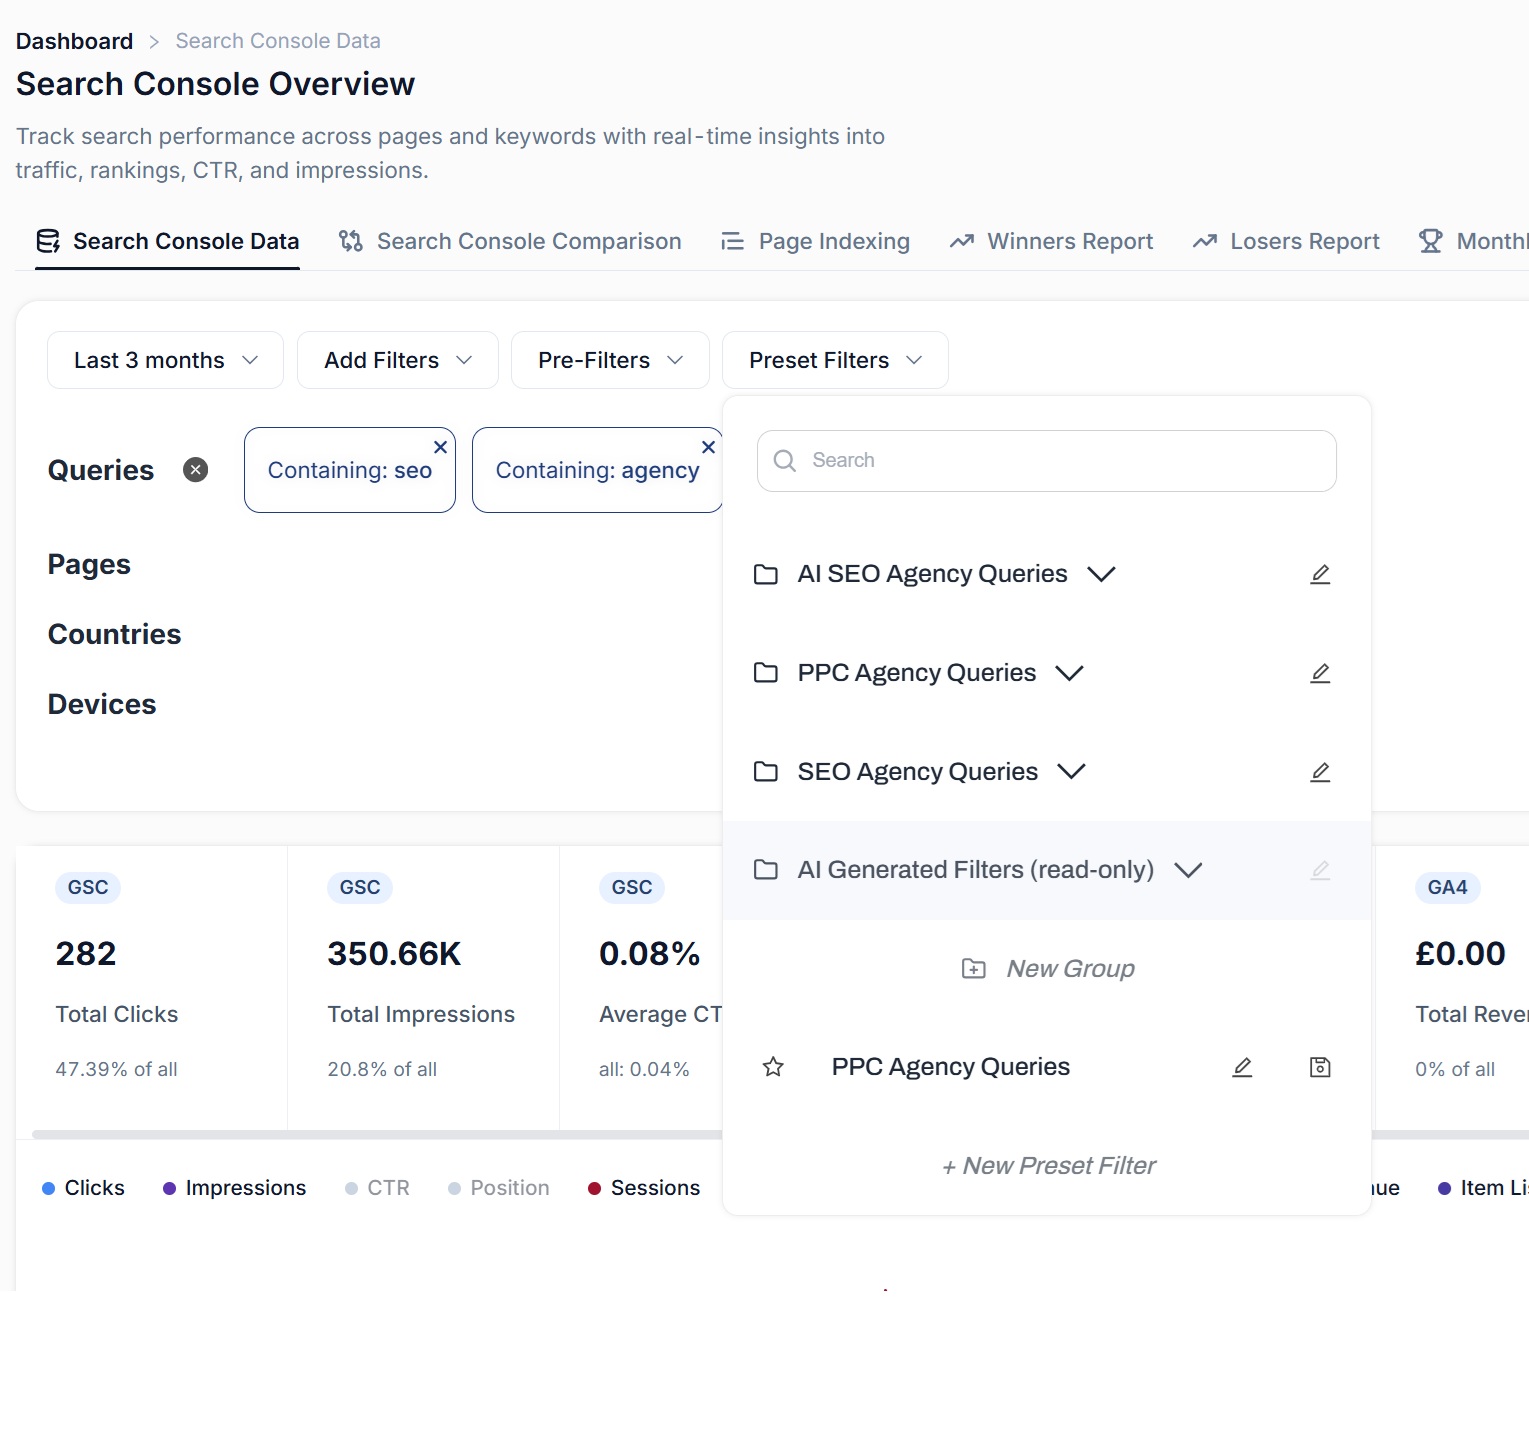
- A saved filter library with folders, so your category structure becomes a set of one-click views the whole team reuses
- One click line per subfolder, /products/ against /collections/ over 24 months on a single chart, which Search Console structurally cannot draw
- Exports with no row limit, month by month, and across pages and queries at once for merchandising analysis
- Bulk filtering and case logic for working through catalogue segments at the scale a catalogue actually has
Every season
Compare this Black Friday to the last three
Retail decisions are year-on-year decisions, and Google gives you sixteen months. Plan Q4 in September and you can compare against last Q4, but not the one before it, so every peak trading period gets judged against a single prior data point that may not have been representative.
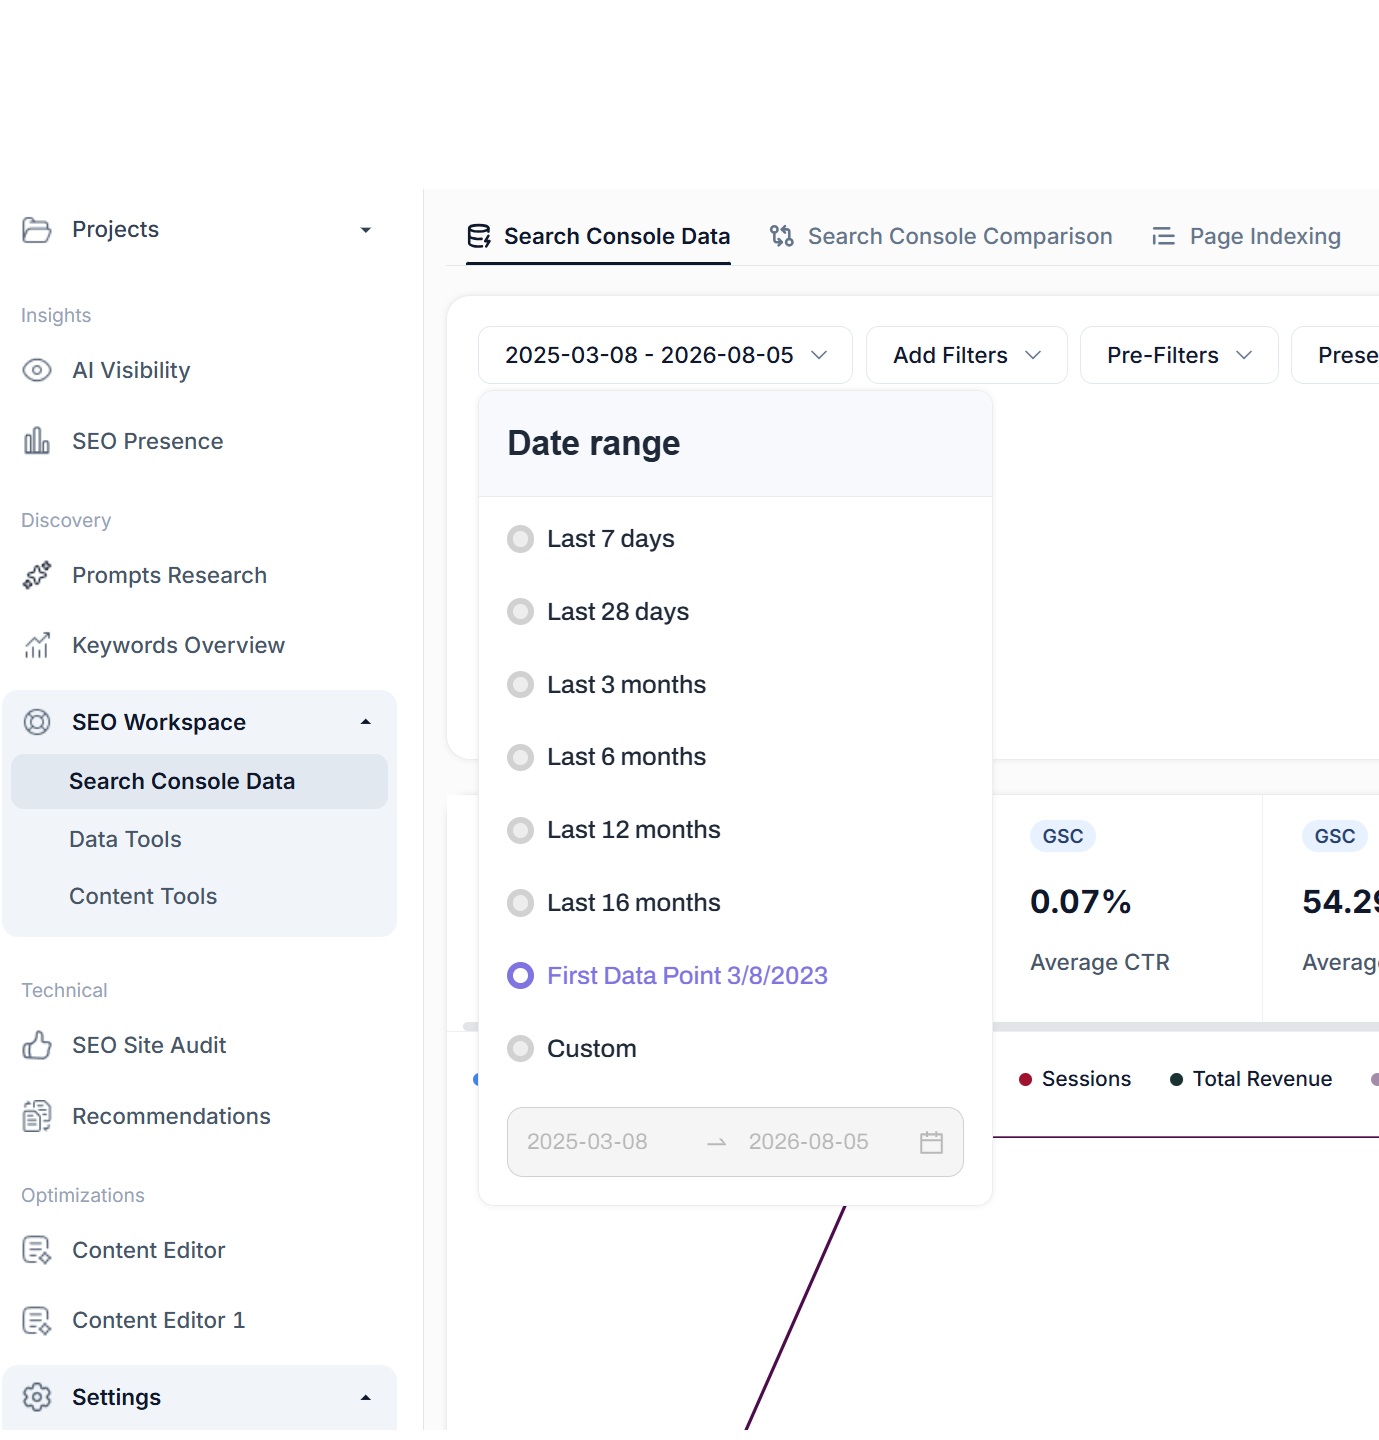
Judge peak trading against several prior years
Rather than against one, which is the difference between a trend and a coincidence when you are setting next season's buying and content plan.
Separate a real decline from a soft season
A range you are considering discontinuing is either decaying across three seasons or it is cyclical, and those two look identical over sixteen months.
Keep the pre-replatform baseline
Migrations and replatforms are judged against the period before them, and that period is normally the first thing Google deletes.
Full query depth on both sides of the comparison
Date comparison runs at full depth across any two periods, with your annotations and Google's core updates overlaid on both, so a difference has a cause attached to it.
Every pound
GA4 revenue, sitting next to the queries that earned it
Connect GA4 alongside Search Console and the metrics render together rather than in separate tools. Against your pages data you get sessions, bounce and engagement rates, transactions and revenue next to clicks, impressions, CTR and position, and the GA4 metrics plot inside the same performance chart.
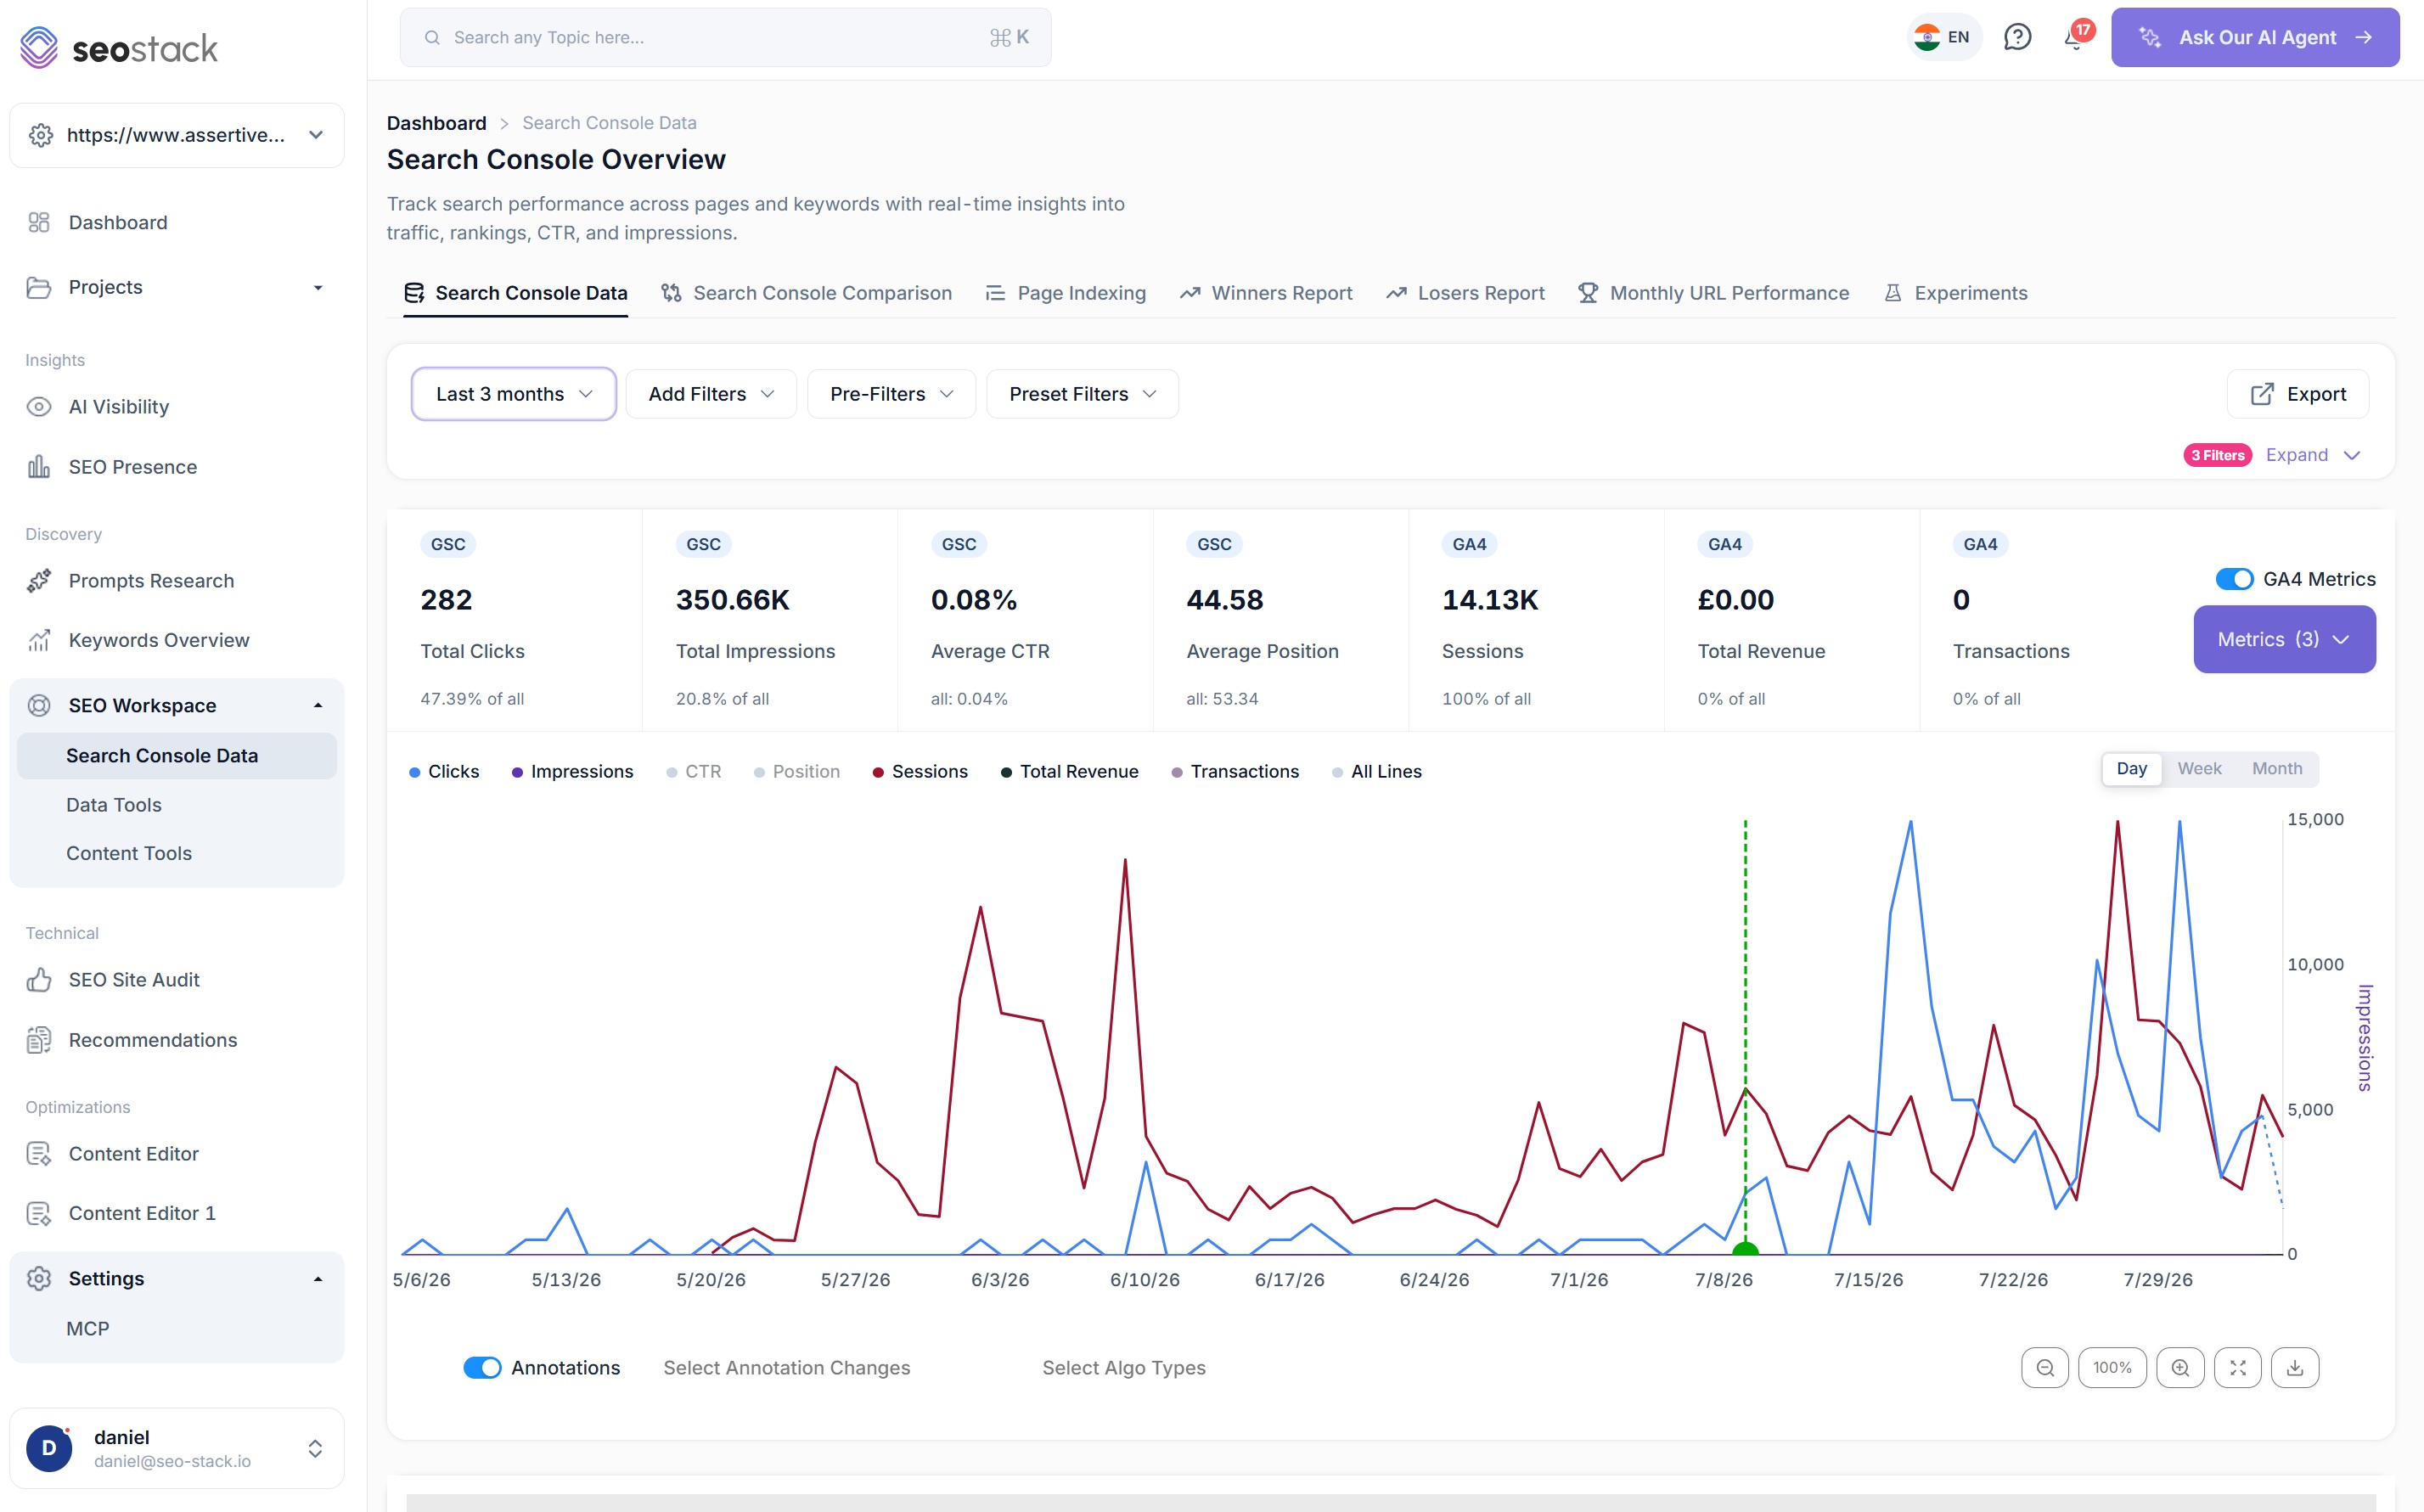
Questions that become answerable in one place
- Which categories rank well and convert badly, which is the highest-value gap in ecommerce SEO and the one nobody has in a single view
- Which products earn impressions and no revenue at all
- Whether a traffic increase brought qualified buyers or broad researchers
- What organic contributed against paid, shopping, referral, direct and LLM traffic
- Revenue per organic session by category, tracked across seasons rather than months
This is the view that lets organic be compared to paid on equal terms, and it is the one that turns an SEO roadmap into a merchandising argument, because a category that ranks well and converts badly is a buying problem rather than a ranking one.
Analysis on request
Ask it for a sales report. Ask it for a conversion audit.
The AI Assistant is connected to your warehoused Search Console and GA4 data by default, with no Cloud project, no OAuth dance and no service accounts, and for a retailer it goes a long way past SEO reporting.
Sales and revenue
- Product sales performance, by product or by month
- Sales by channel, with cost per acquisition and conversion
- Monthly, quarterly or annual sales reports built on request
- Revenue by traffic source, including revenue attributed to LLM referrals
Conversion and behaviour
- Conversion analysis across landing pages and categories
- Engagement, bounce and exit rate analysis to find the pages losing buyers after the click
- Session medium breakdowns and abandonment patterns
- Hybrid audits, i.e. pages ranking well, converting badly, and why
SEO at catalogue scale
- Cannibalisation and canonical conflicts across the full query set, which are endemic between product and listing pages
- Pages that stopped being served, and pages newly served
- Spam and negative SEO patterns in the query data
- Click forecasting from your own historic CTR curves
- Which annotations helped and which hurt
Charts on request, including the ones Google cannot draw
Pie charts, bar charts and multi-line comparisons, interactive and exportable, built from whatever you describe. The subfolder comparison is the obvious one, because Search Console will only ever plot a single click line and a retailer needs several.
It is worth being clear about what this is. It is not an SEO chatbot, it is an analyst that has already read every row of your search and commercial data, and it will answer a merchandising question as readily as a ranking one.
Category and product page SEO
Find the drift before it costs you a season
These are the diagnostics that are genuinely specific to running a catalogue, because a category page and a product page fail in ways a blog post never does, and the failure shows up in what Google serves the URL for long before it shows up in the sales figures.
URL Query Intent
The intent composition of the queries a URL is served for. When a transactional category starts being served for informational queries, that is the classic symptom of over-contenting a listing page, and it appears in the intent distribution long before it appears in the revenue.
URL Query Intent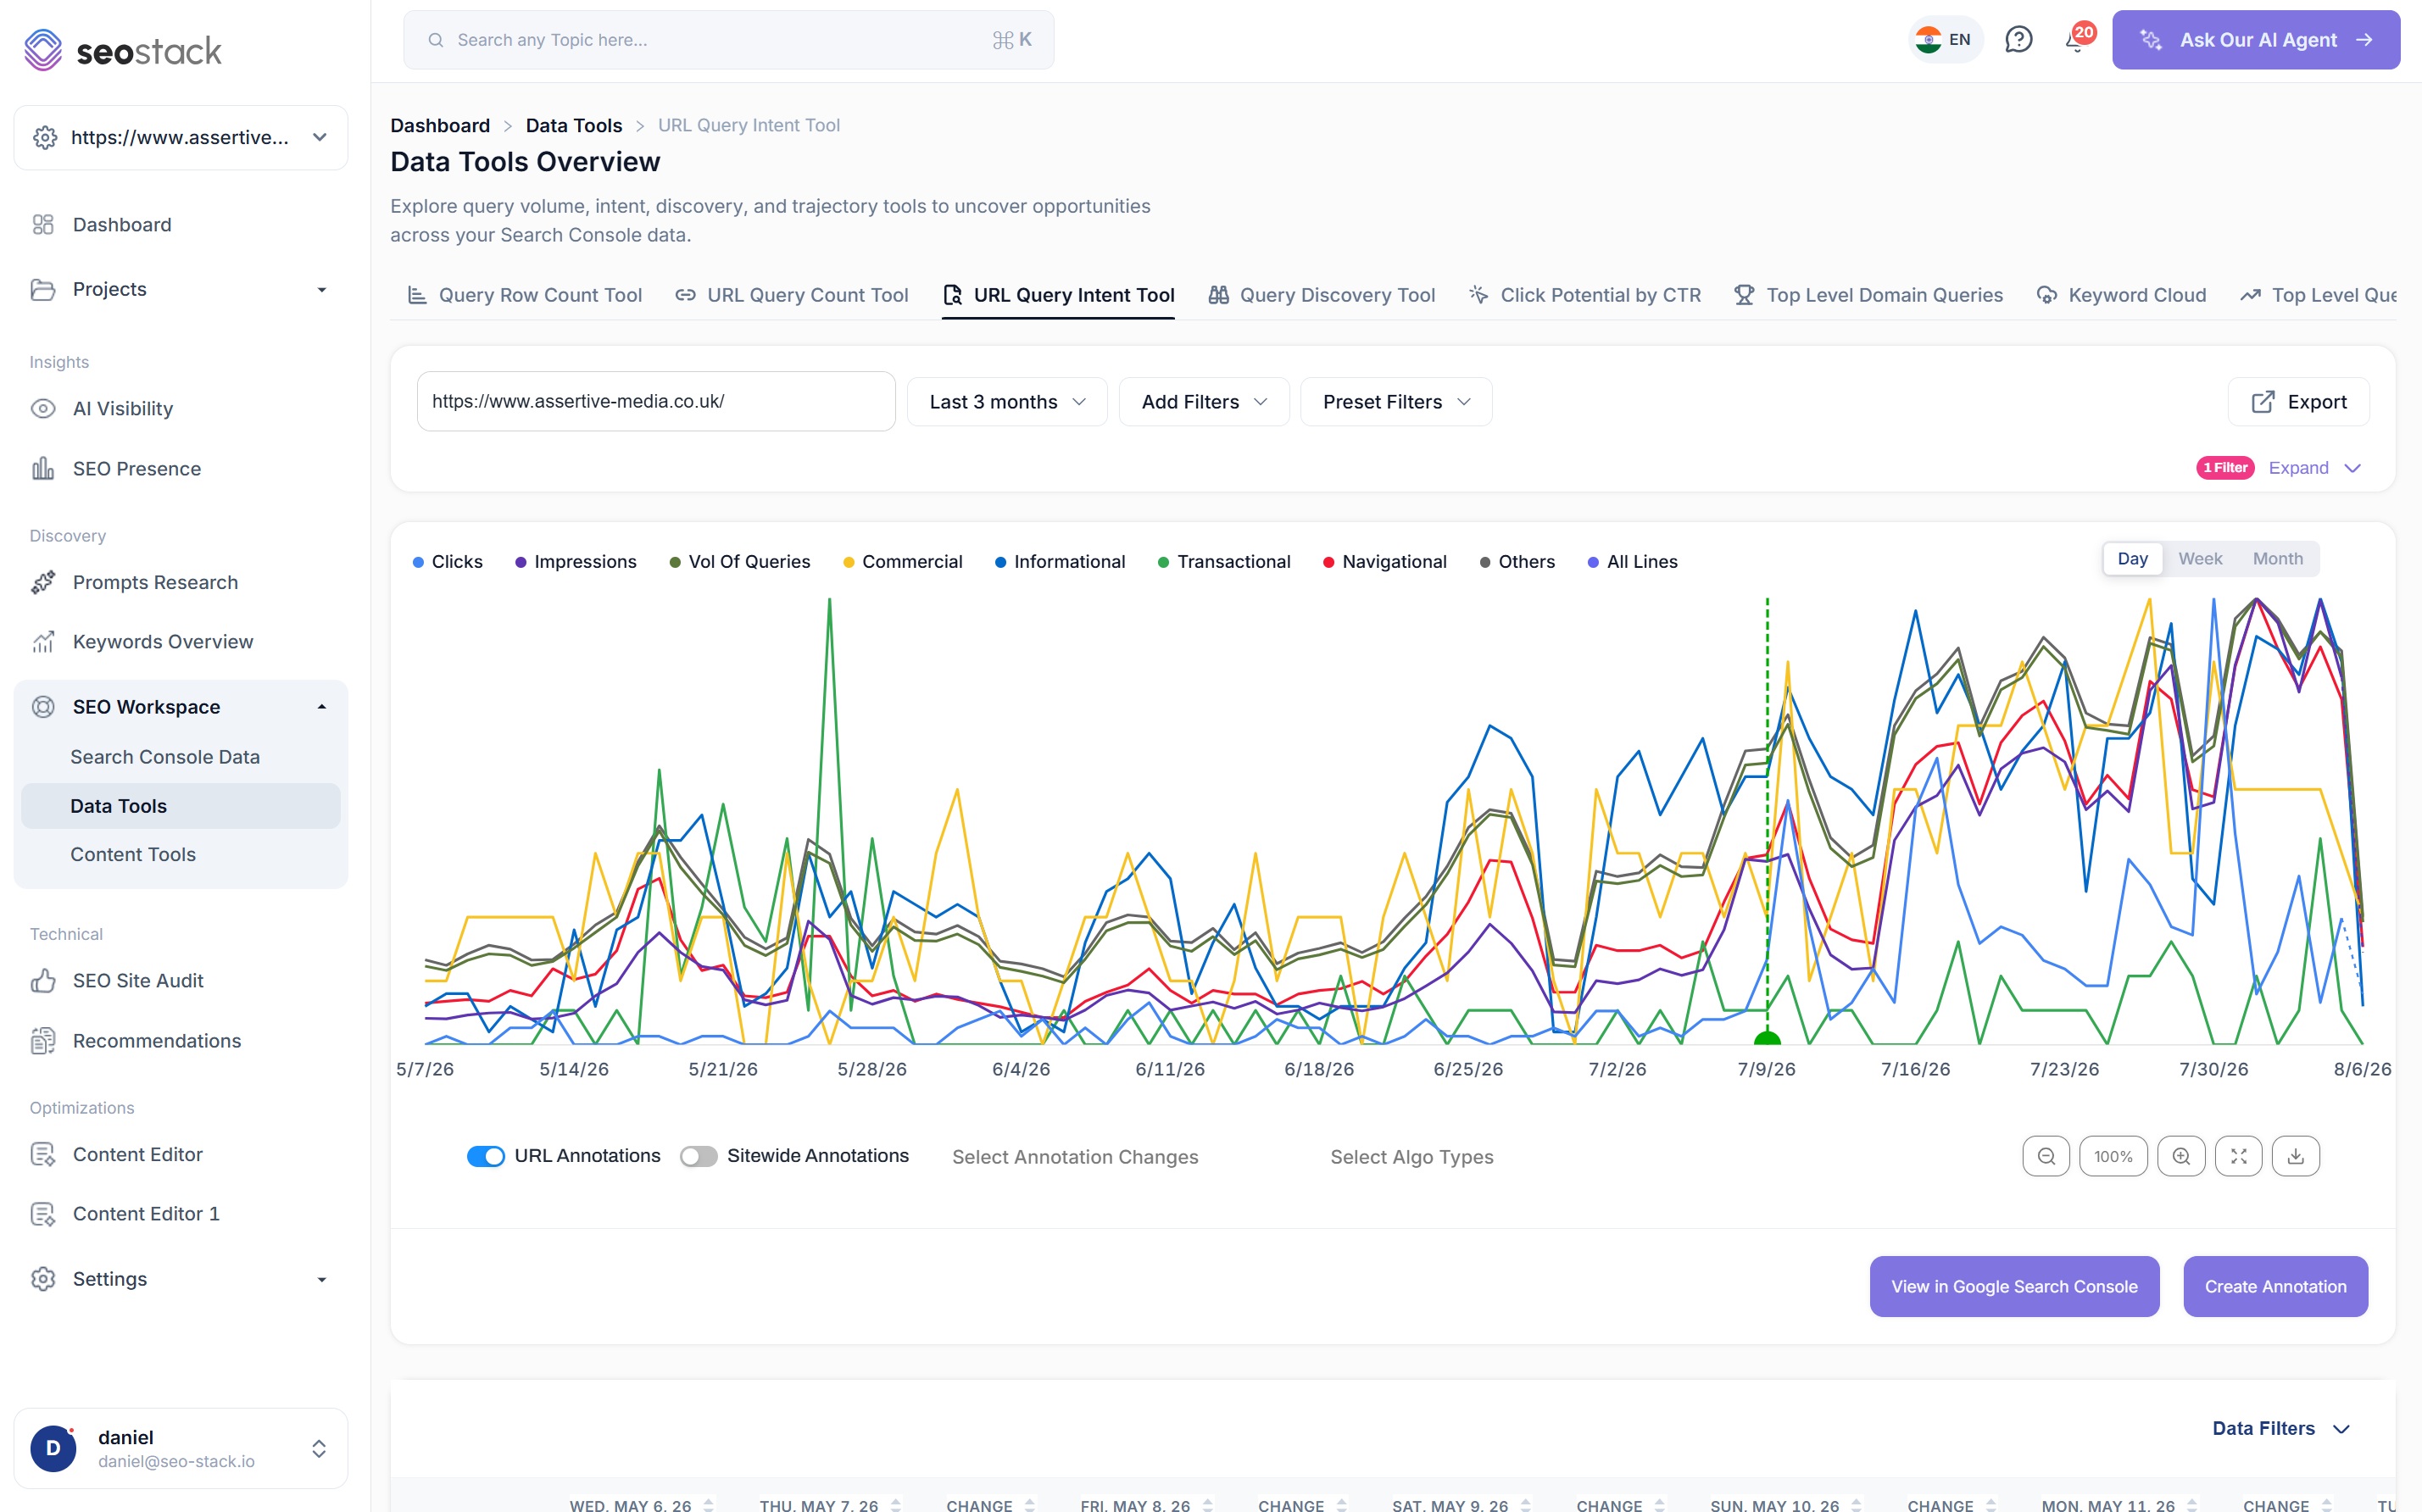
Keyword Cloud
What Google actually thinks a page is about, weighted by serve rate. On a category page, if your target term is not in the top handful, Google has not understood the page, and on a product page it surfaces dilution you would otherwise argue about.
Keyword Cloud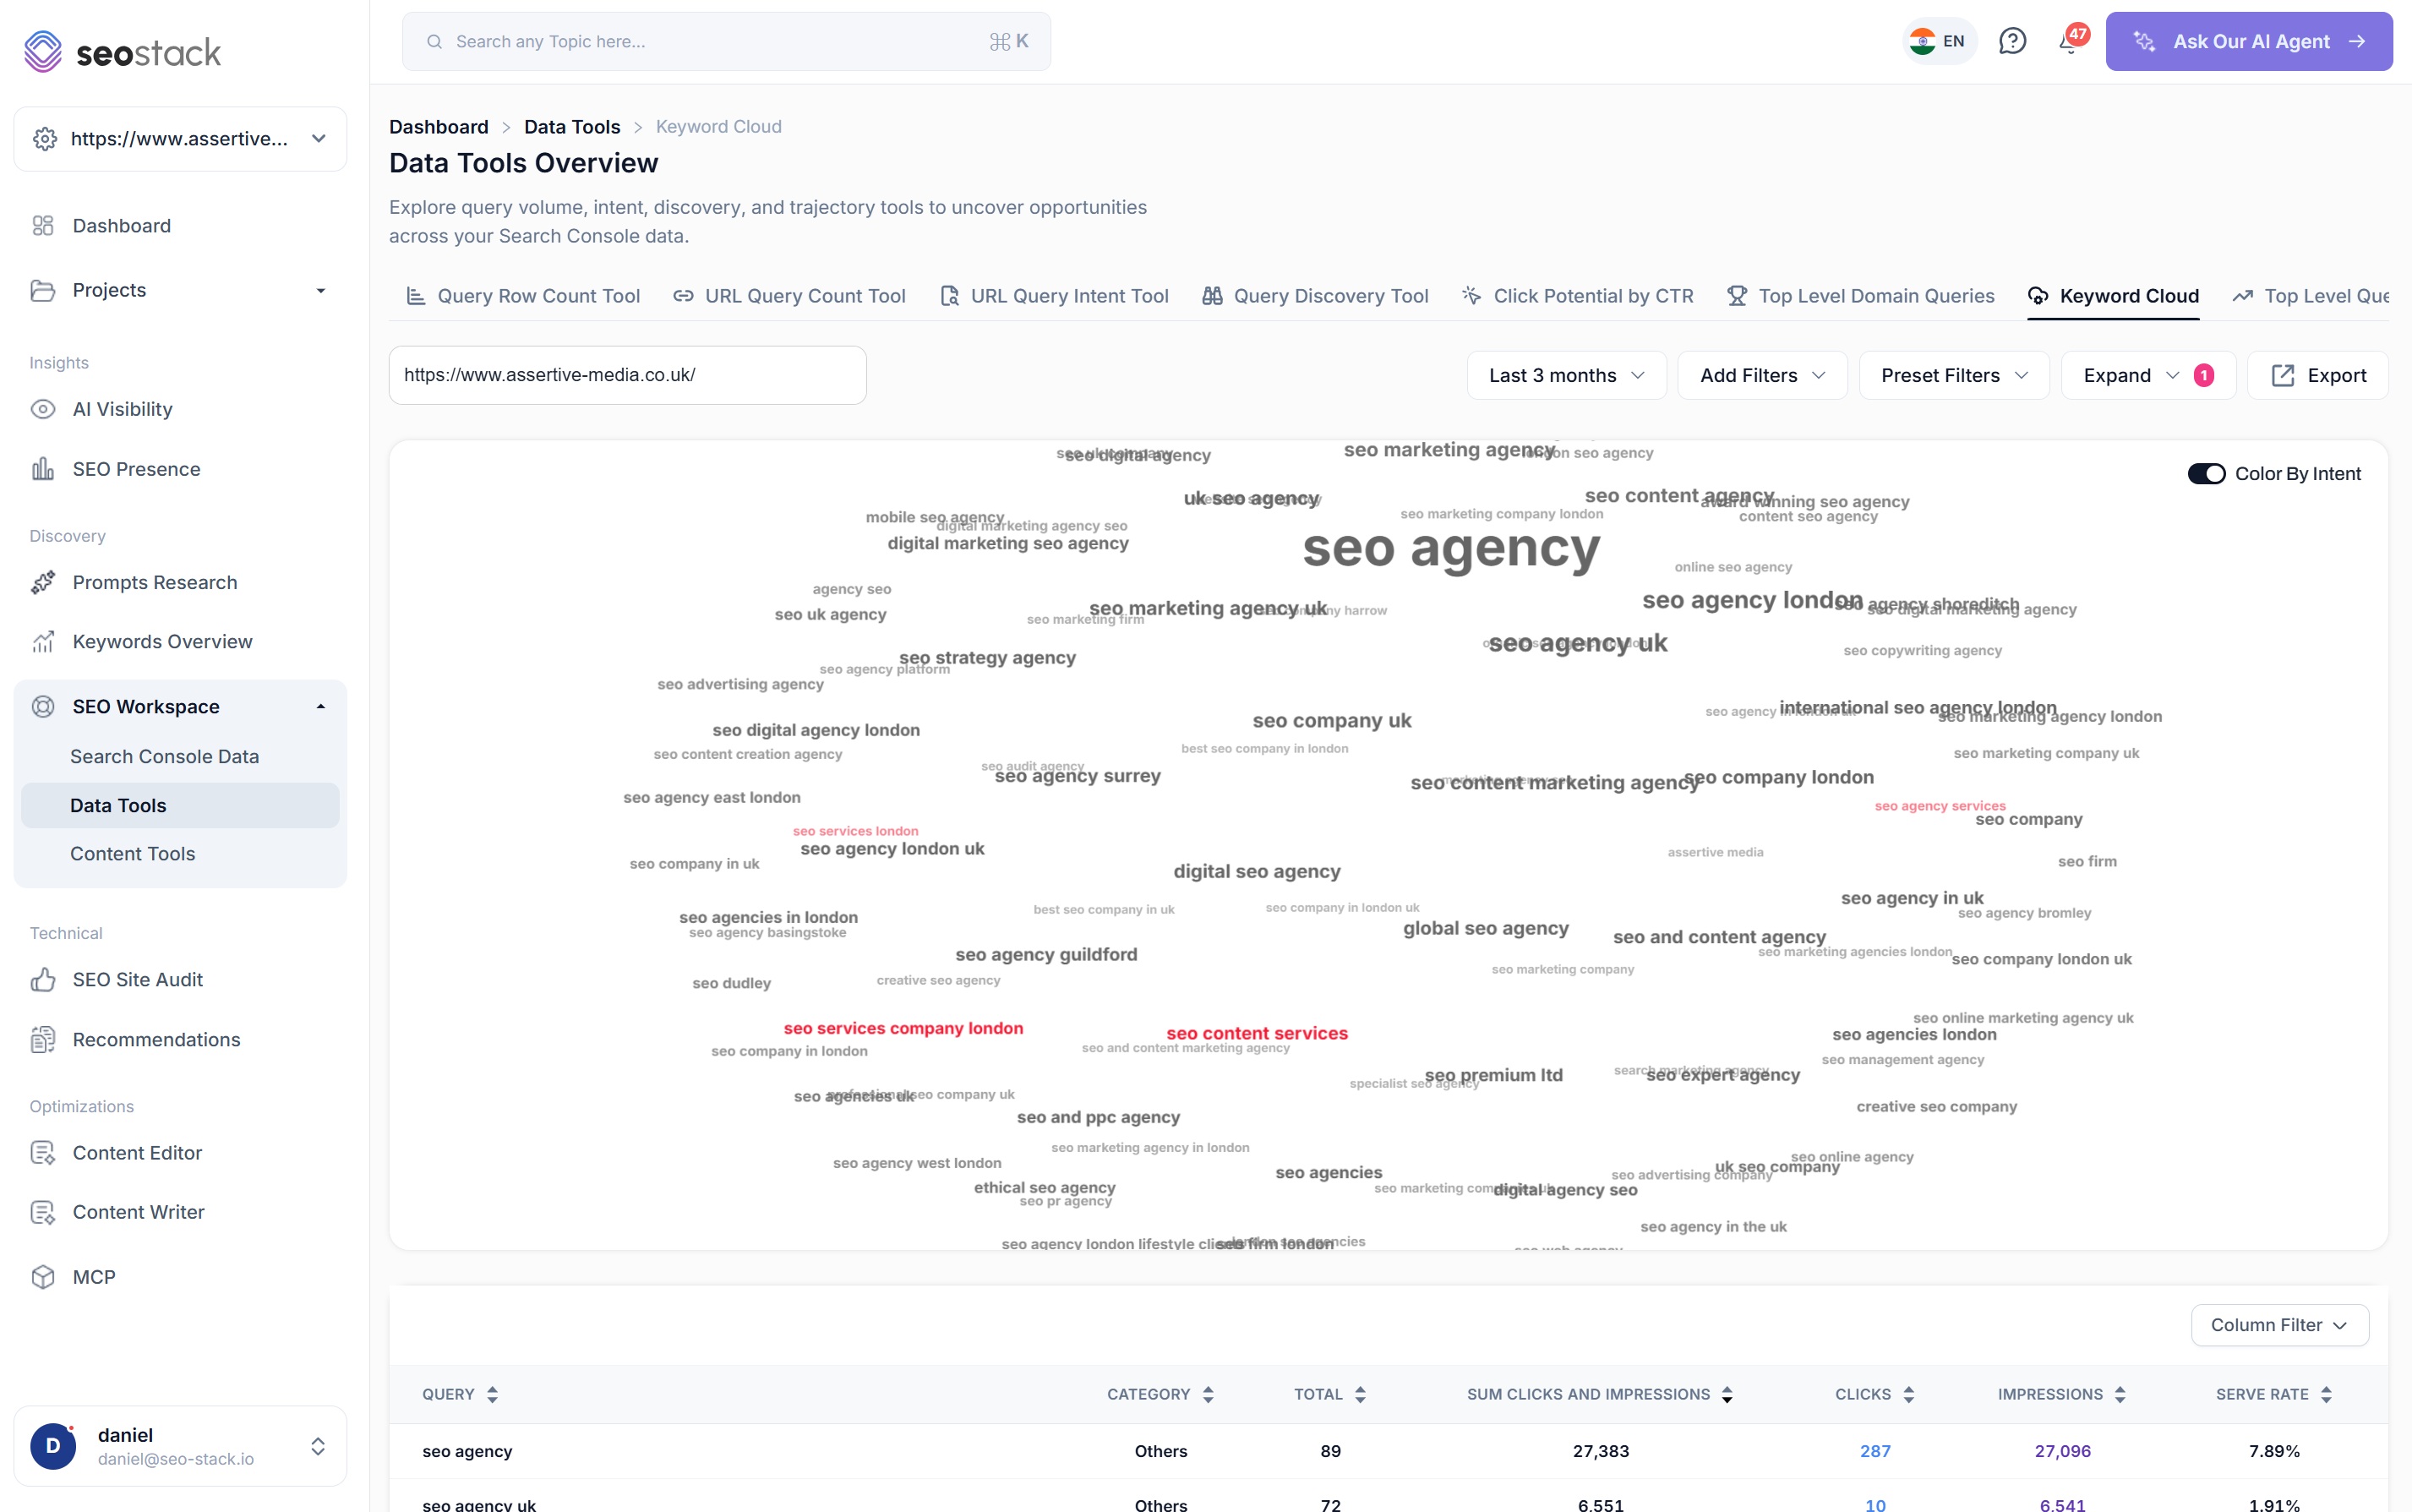
URL Query Count
Three causes of a decline that look identical on a clicks chart: fewer queries served, positions slipping, or AI Overviews absorbing the click. On product pages this matters enormously, because AI Overviews are absorbing exactly the research-stage queries that used to feed them.
URL Query Count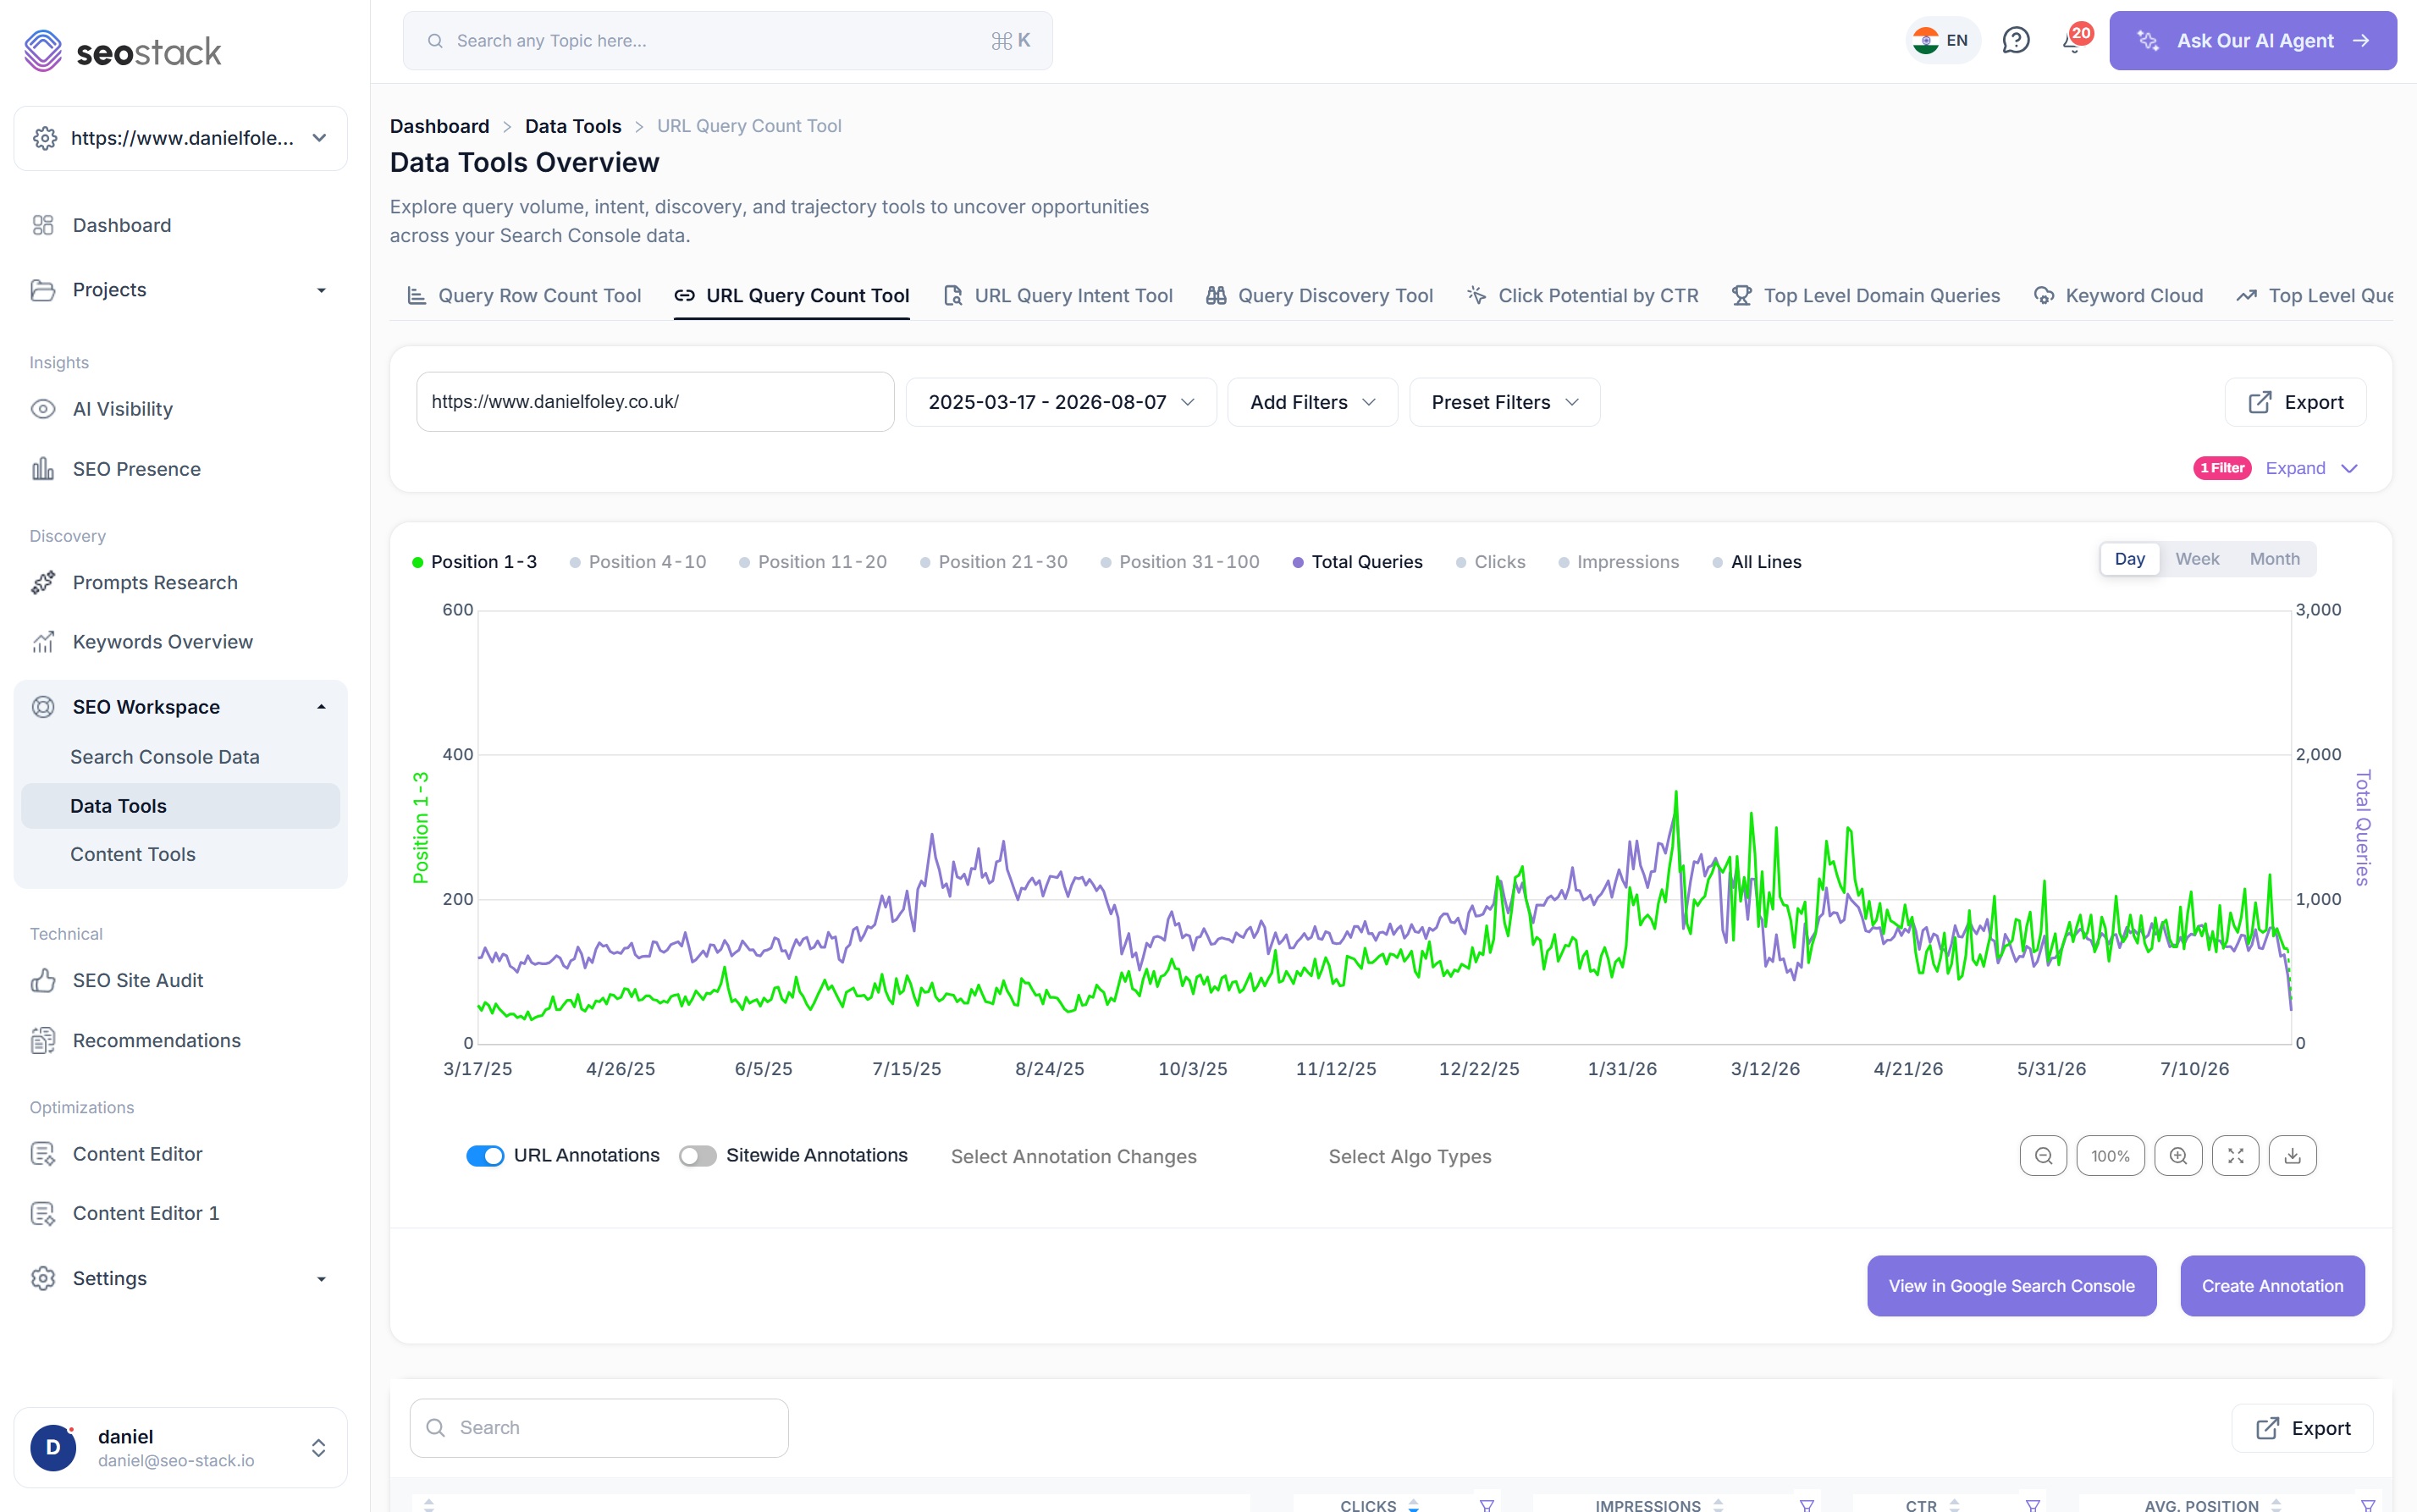
Query Trajectory
Total query counts compared across many URLs at once, which is built for the question every merchandiser eventually asks, i.e. which of these forty new category pages are taking off and which are stagnant.
Query Trajectory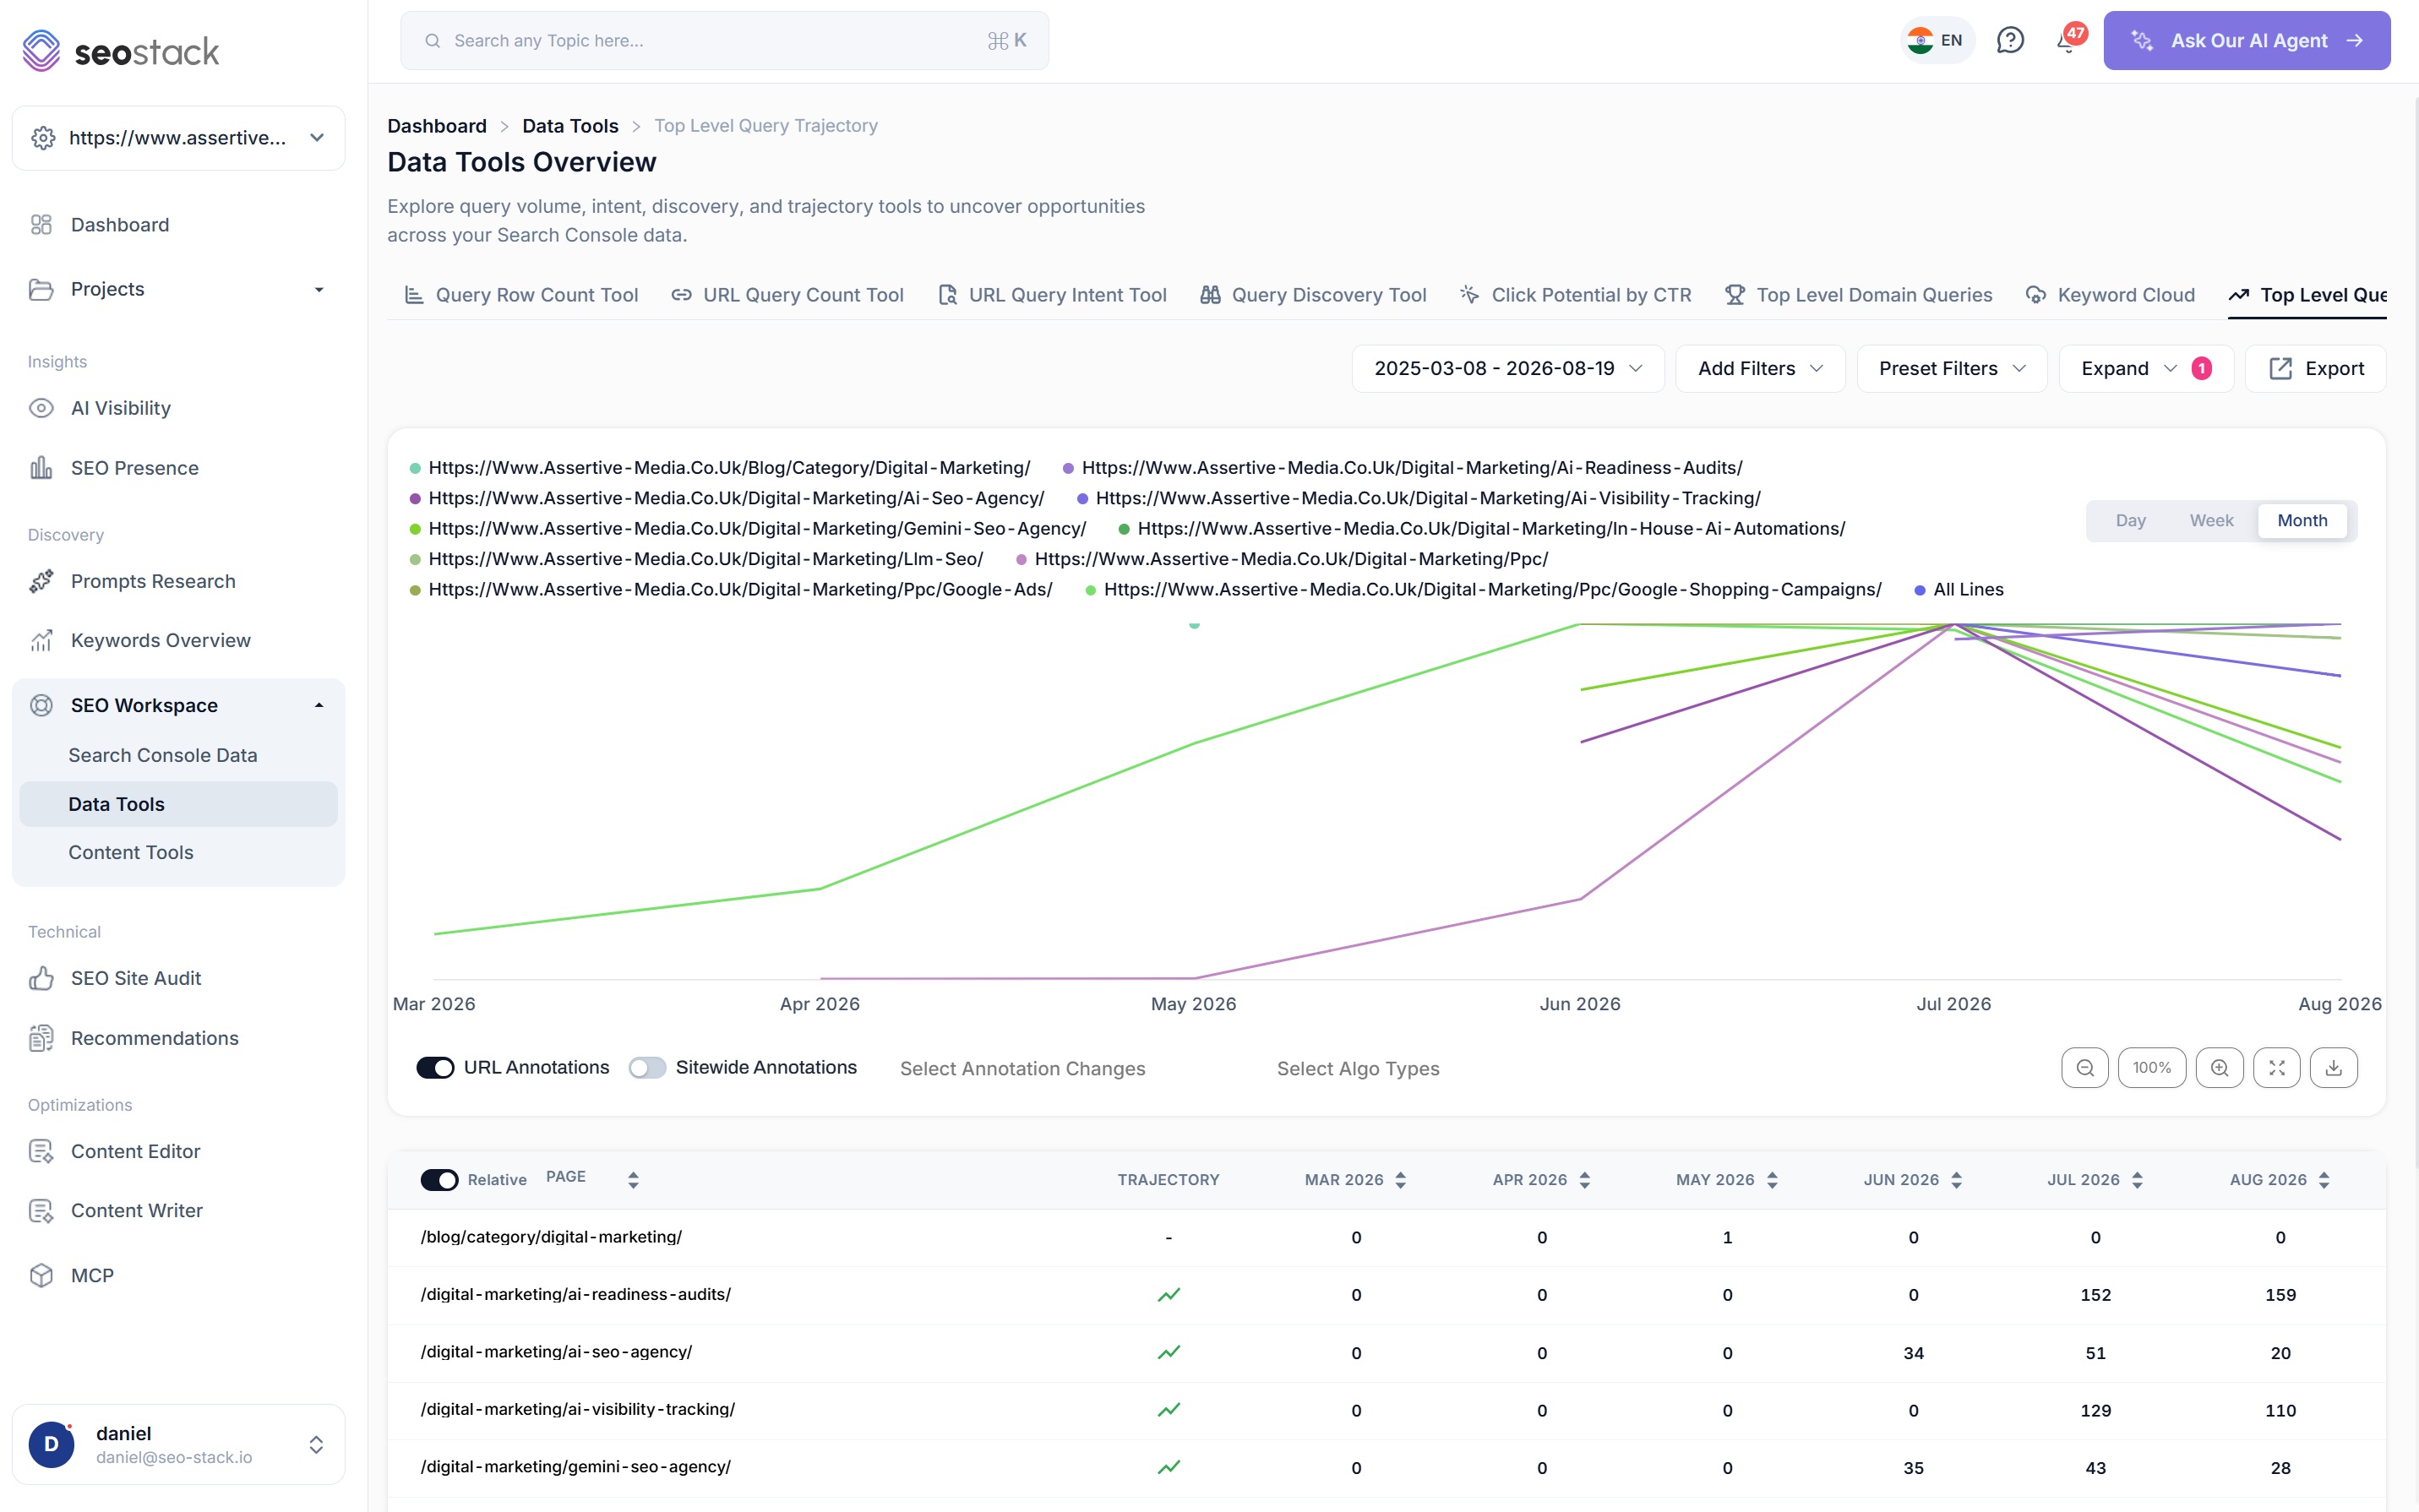
Query Discovery sits alongside these and profiles the whole domain's query set by intent and type, which is how you find demand you are not serving at all rather than demand you are serving badly.
Query DiscoveryEcommerce SEO audit
Thousands of URLs earning nothing
Large catalogues accumulate dead weight as a matter of course, i.e. discontinued lines, out-of-stock products, faceted URLs, variants and thin category pages, and the auditing job is less about finding problems than about ranking them by what they cost you.
Real-Time Content Auditing
Groups the whole index into performance bands, from performance and good through fair and weak to dead and opportunity, with the composition tracked over time so you can watch it improve as you prune and consolidate.
Learn moreWeak & Dead URL Discovery
Factors in the age of the page's index entry, so a product listed three weeks ago is not judged against one listed three years ago, which is the single most common way this analysis goes wrong on a fast-moving catalogue.
Learn morePage Indexing & URL Inspection
Past Google's two thousand a day inspection cap, with verdict, coverage state, robots status, Google-selected against user-selected canonical and rich result data, the last of which matters more here than anywhere because product rich results drive the click.
Learn moreMonthly URL Performance
Every URL, month by month, in one view, which is how a few hundred products fading at once stops being invisible behind a flat site total.
Learn moreSite Audit & Recommendations
A ranked, explained fix list with impact ratings, affected pages and estimated time against each, which on a catalogue is also the prioritisation you were going to spend a week doing by hand.
Learn moreTitle Rewriter
Bulk, intent-aware title rewrites with the current title alongside and a SERP truncation preview, which across thousands of product pages is a job nobody does manually and everybody needs done.
Learn more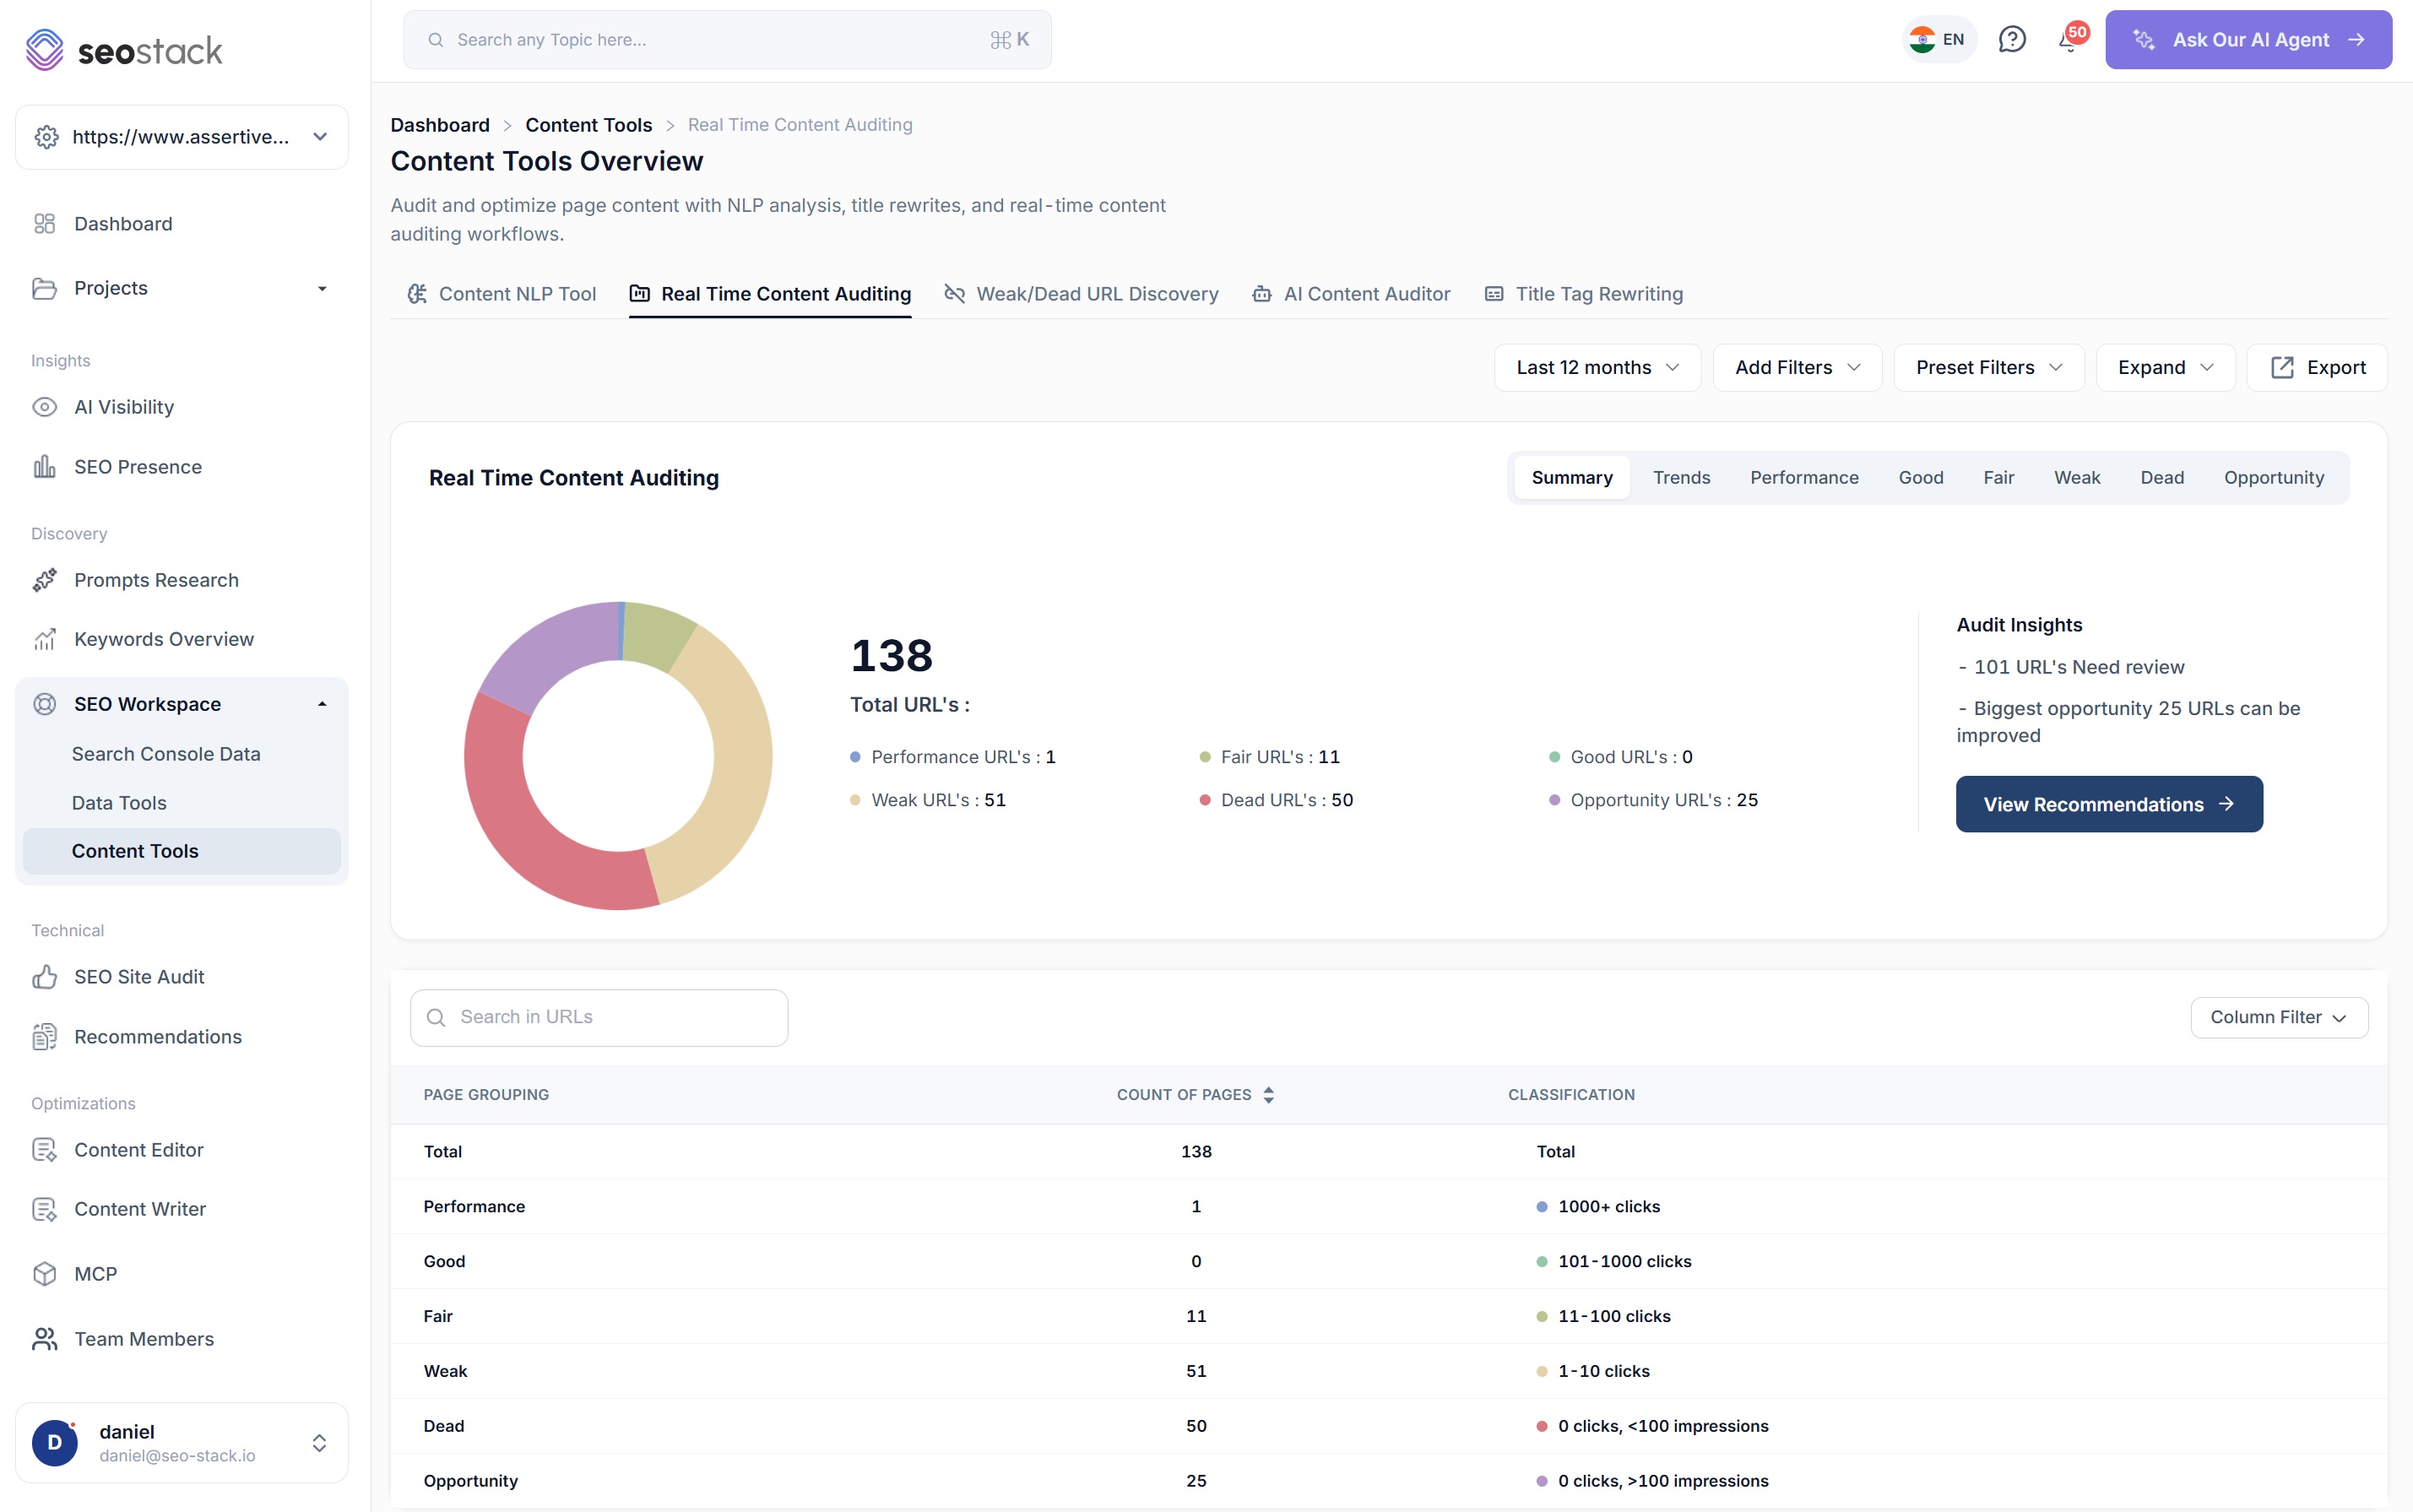
Testing and attribution
Test a template change across the catalogue, then prove it worked
Catalogue work is template work. You change a product page layout, a title pattern or a category intro and it lands across thousands of URLs at once, which is both what makes it worth doing and what makes it terrifying if nobody is measuring.
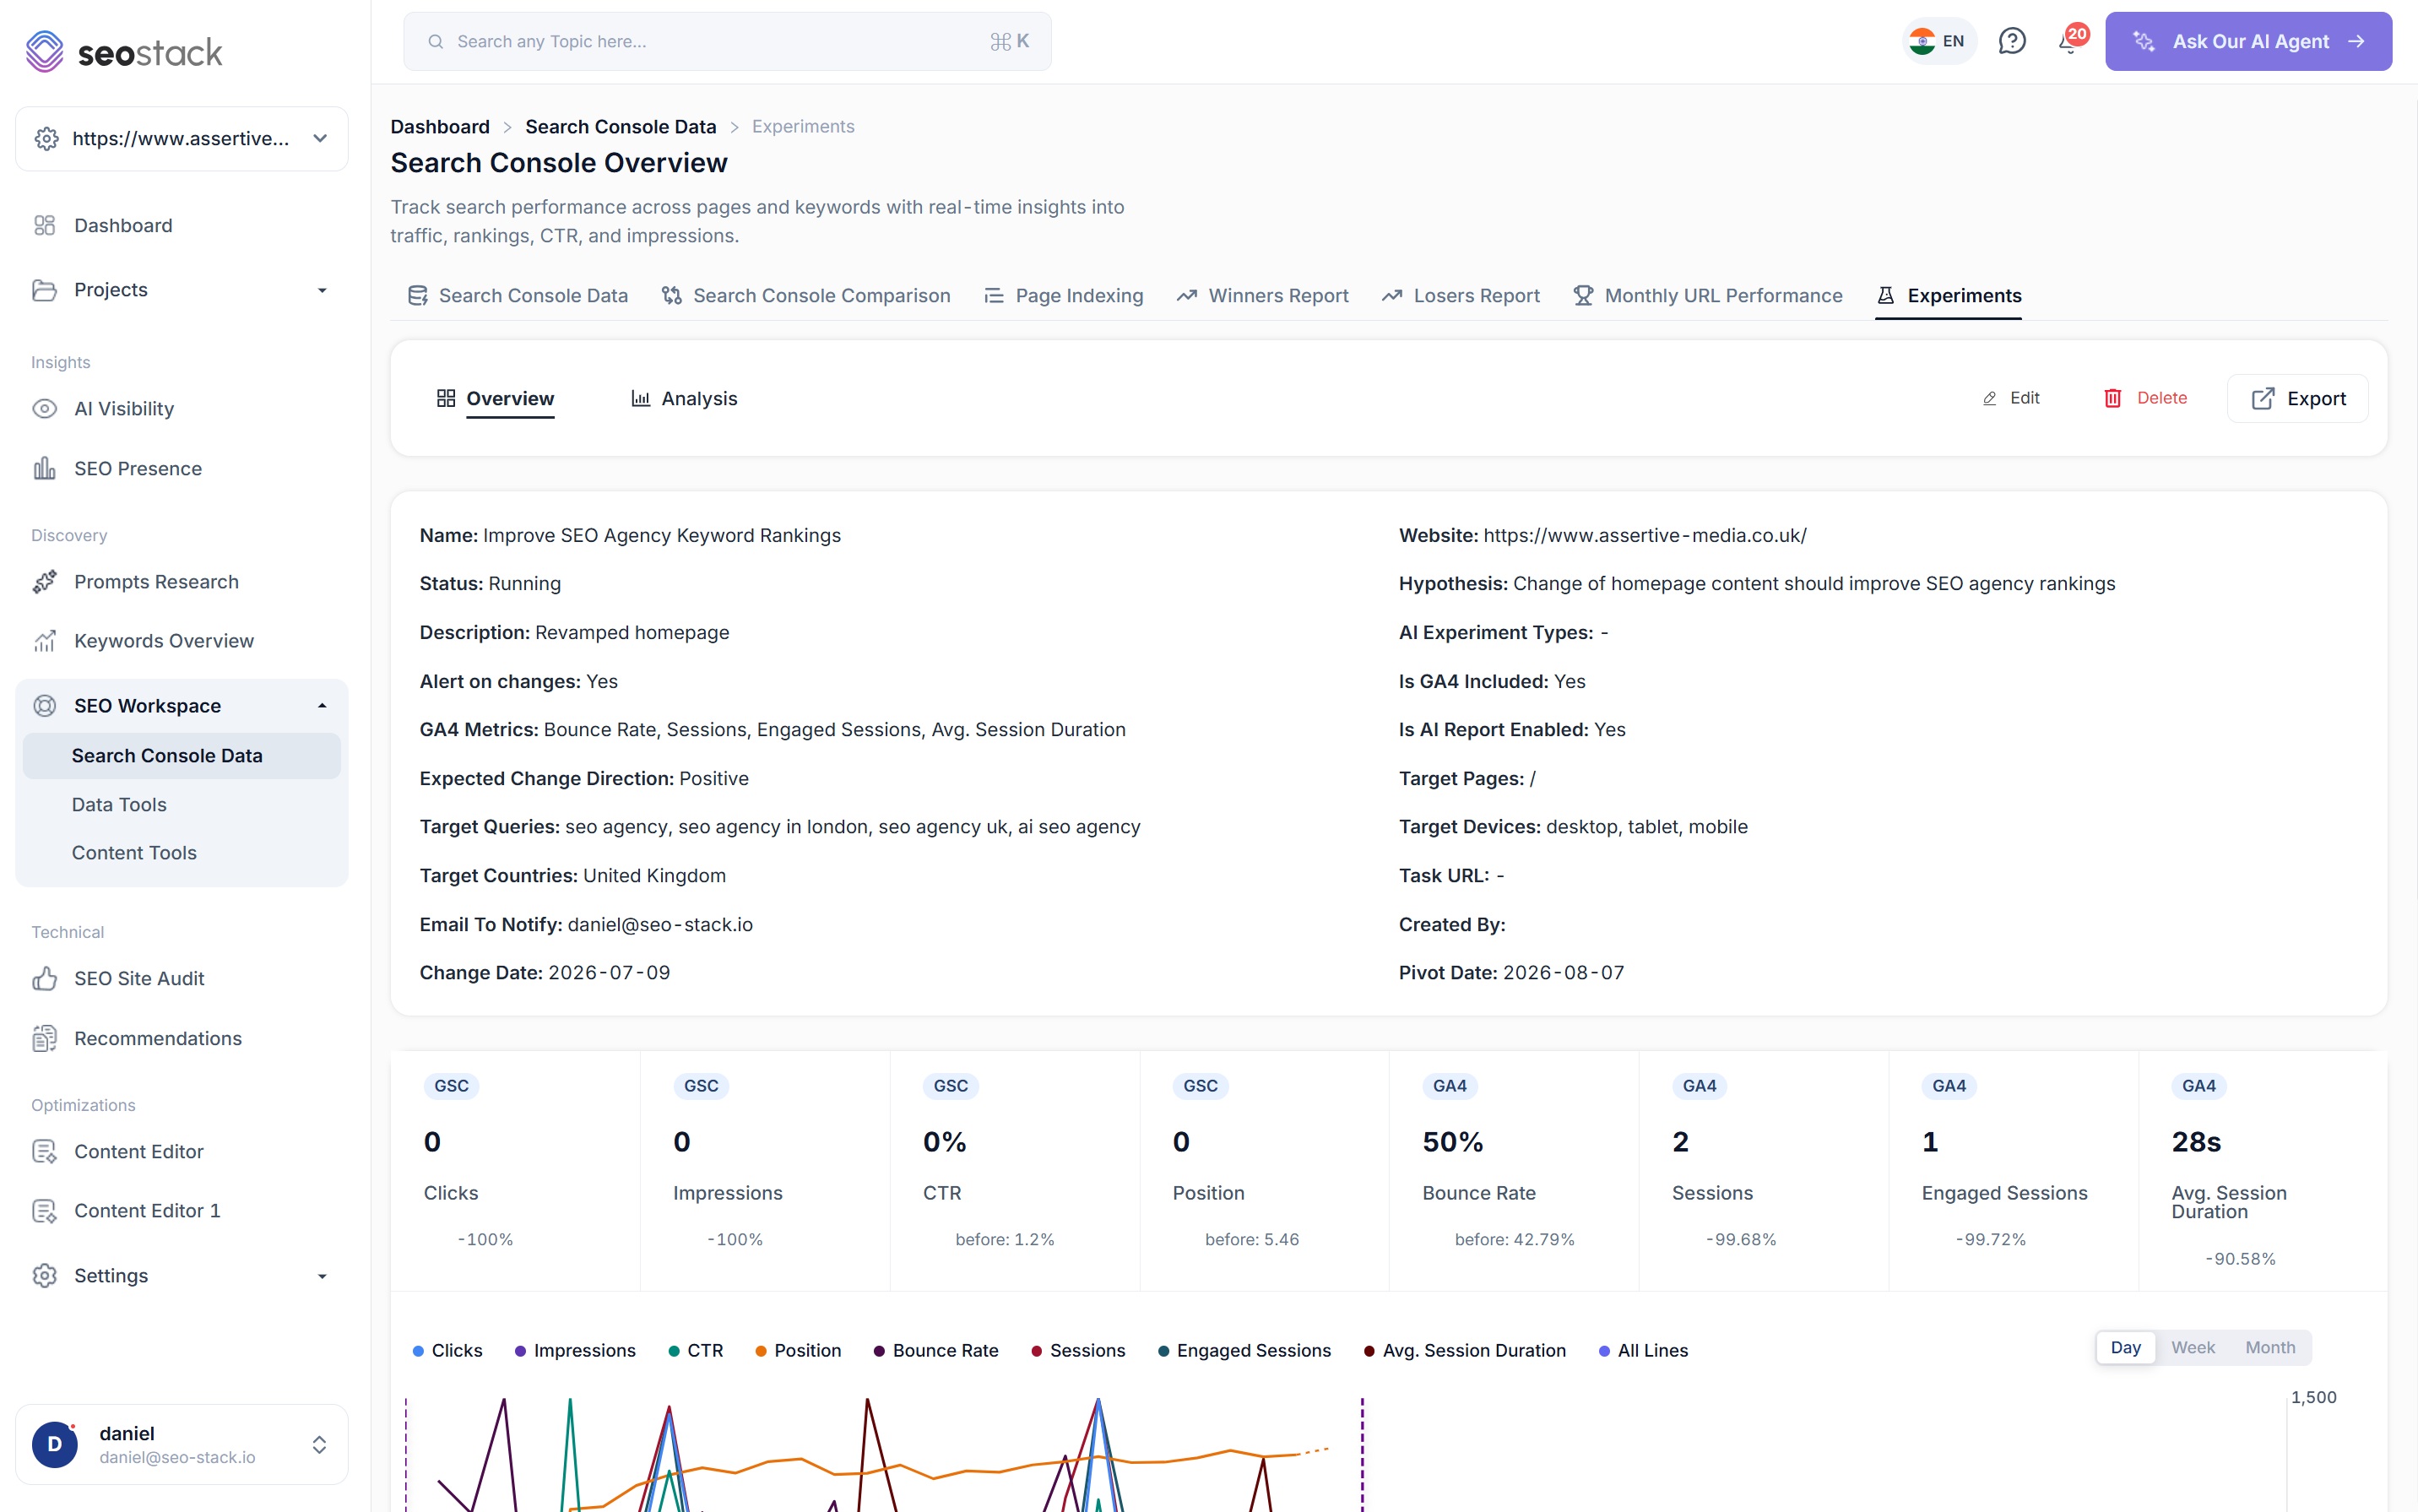
AI Experiments set a pivot date, a hypothesis and the Search Console and GA4 metrics that matter, then read the before and after and give a verdict. Annotations log every change with a date, an author, a URL scope and a change type, plotted on every chart alongside Google's own algorithm update markers, so a template rollout and a core update never get confused for each other again.
AI search
Where product research is going
Product research is moving into AI answers, and for retail the stakes are specific, because a shopper asking an assistant for a recommendation gets either your brand or a competitor's, and there is no click either way to tell you it happened.
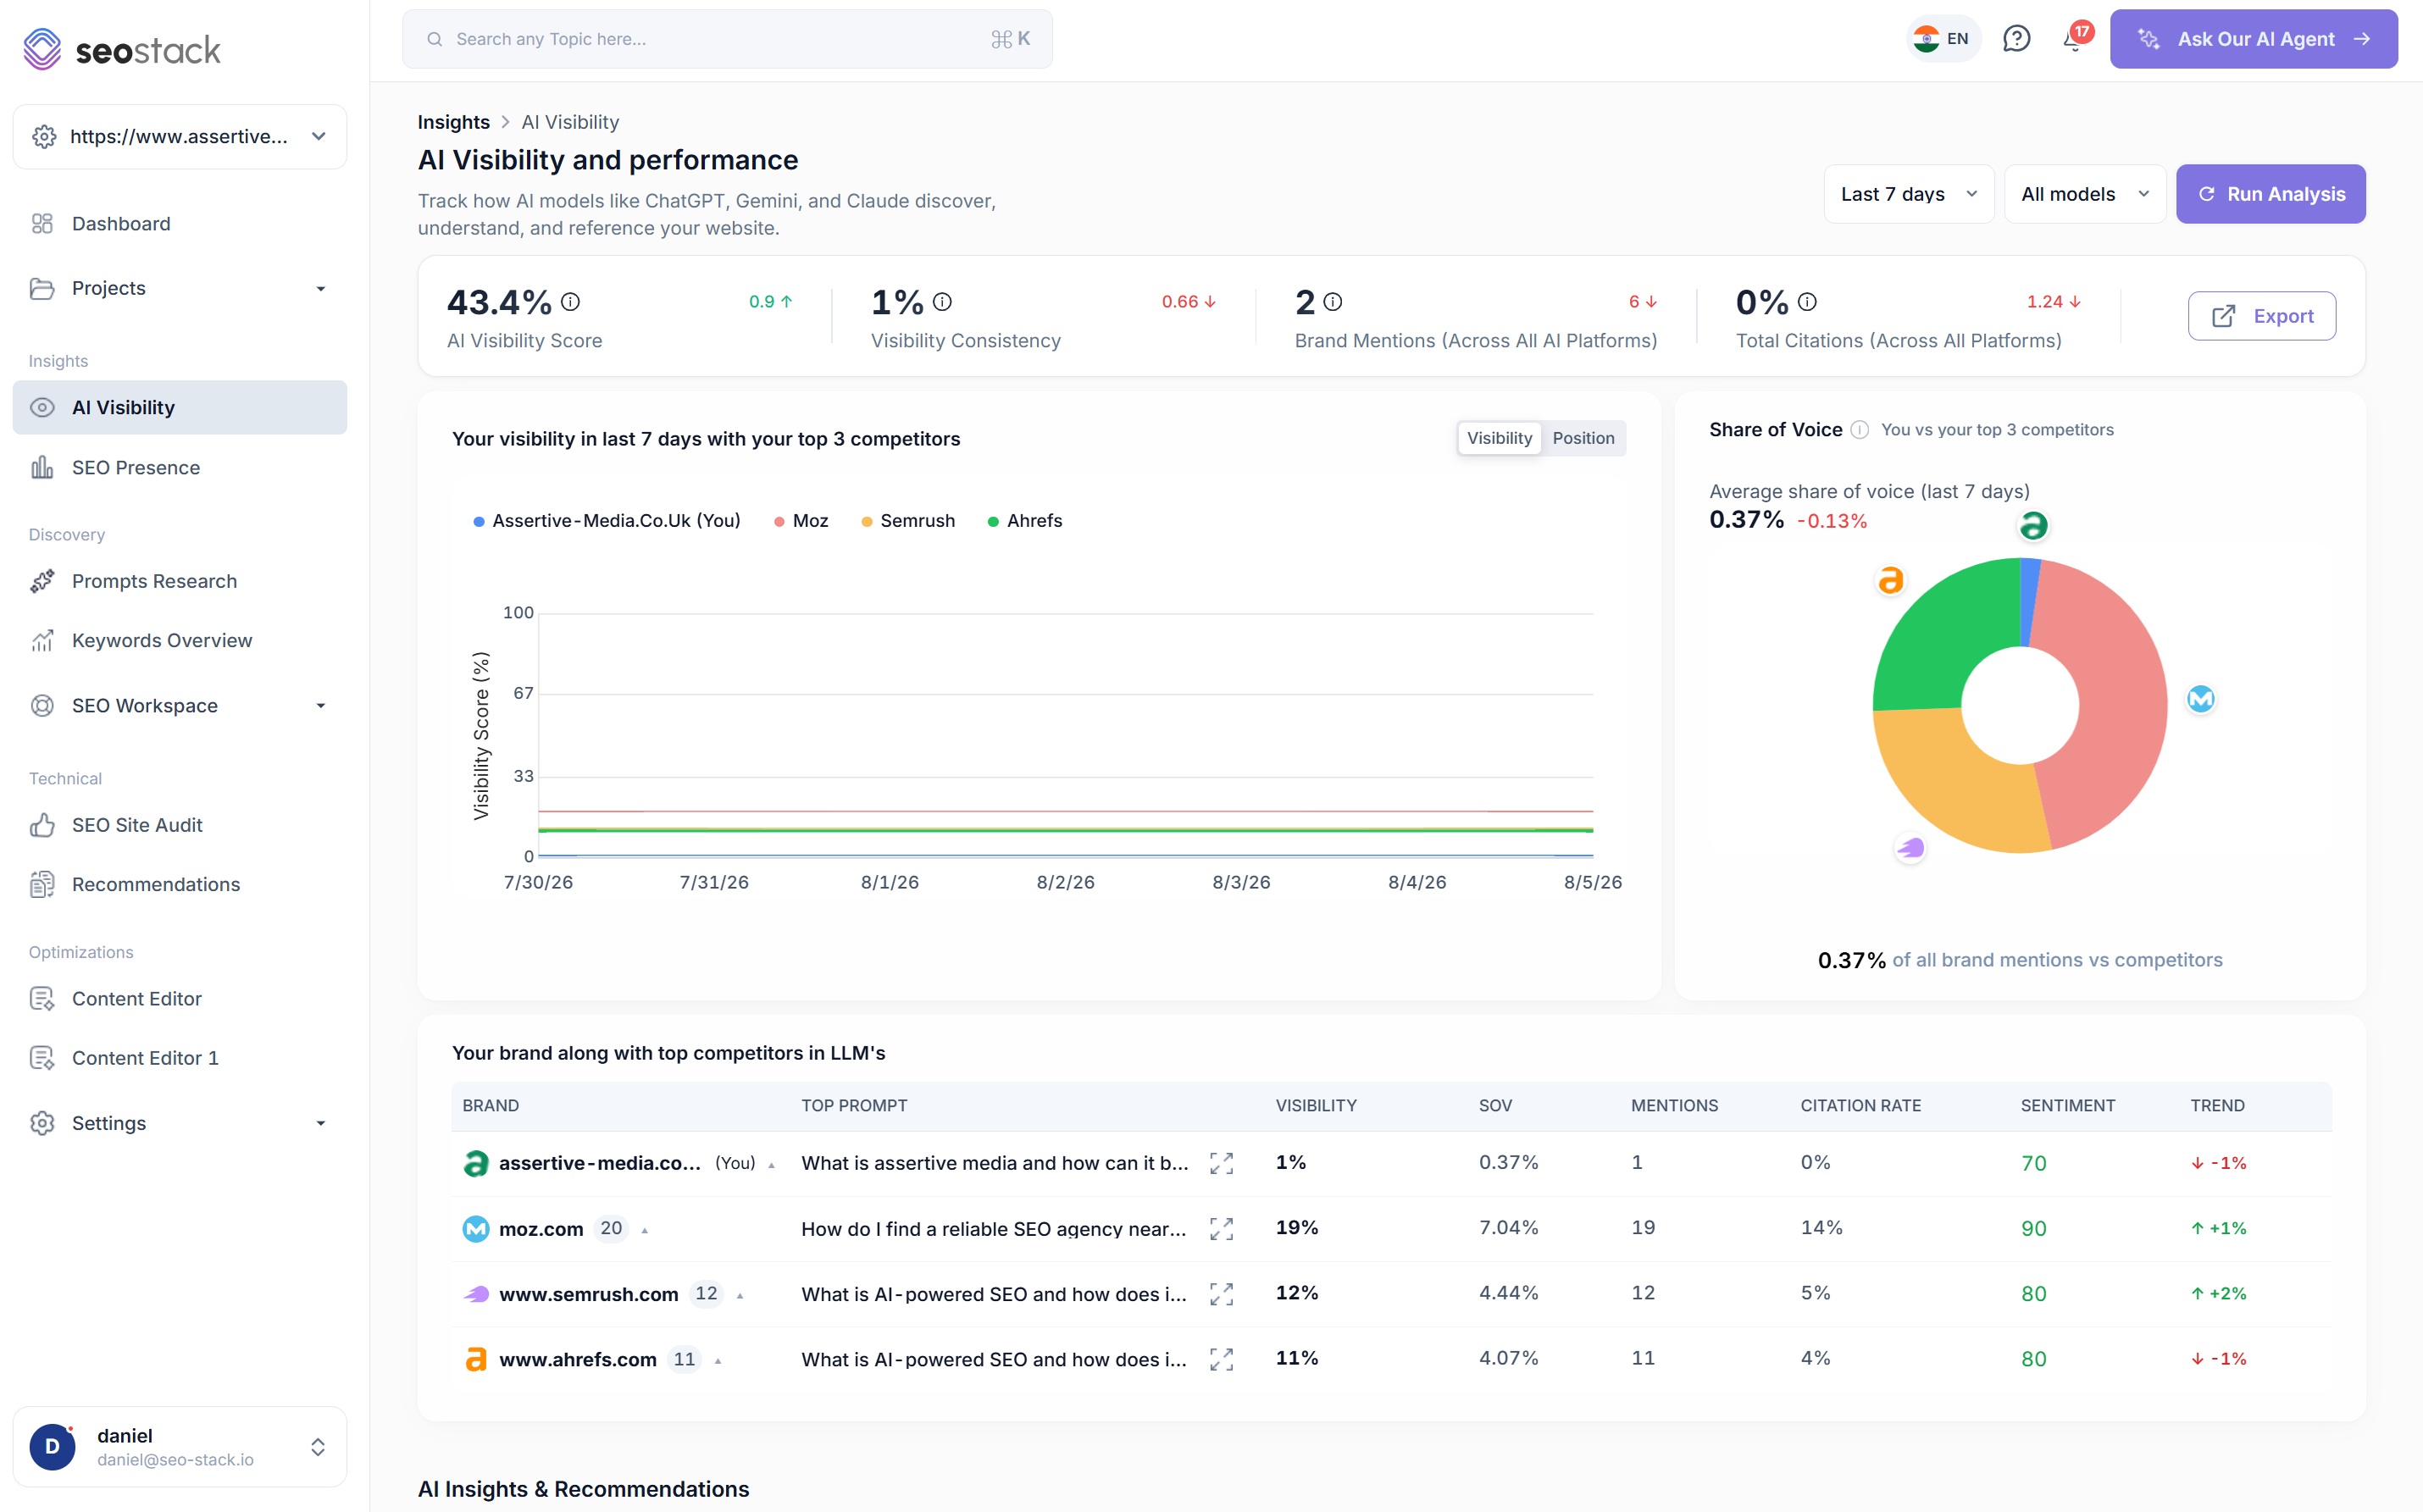
Tracked against competitors you name
Visibility score, citations, share of voice and sentiment across ChatGPT, Gemini and Claude, benchmarked against the retailers you actually lose sales to.
Pointed at buying questions, not brand terms
Prompt research shows which phrasings trigger a mention, so you can aim it at the recommendation questions your categories should be winning rather than at your own name.
And what the citations are worth
The AI Assistant separately reports LLM referral traffic and revenue by AI source out of GA4, so you can see both whether you are cited and whether it sold anything.
The toolset
What you would open, and when
Organised by the job rather than by product category, because that is how a trading week actually runs. Every row links through to the tool if you want the detail behind it.
A handful of things start higher up, i.e. keyword clouds and project management on Pro, and white-label reporting and bulk content generation on Agency. Everything else on this list is on every plan, so what you are choosing between is how many properties you connect and how large each allowance is, rather than which of the useful parts you are allowed.
Enterprise ecommerce SEO
Multiple storefronts, multiple markets
Agency covers 200 websites with 120+ month warehousing, which is enough for a multi-brand group or a retailer running a separate property per market. Team and delegation gives per-property read or write control without touching your origin Search Console accounts, so a market team, a translation agency and a media agency can each see their own properties and nothing else.
The MCP exposes 23 tools over the warehouse with no row limits for piping data into an existing BI stack, and returns up to ten million rows where Google's own API caps a response at 50,000 and stops at sixteen months.
It is monthly with no contract and no procurement cycle, which is what makes it approvable without a six-month enterprise sales process attached to it.
What it does not do
It is not a backlink index and it is not a crawler-first technical suite. Teams running large-scale crawls or competitor link analysis keep those tools alongside, and SEO Stack owns the first-party performance and revenue layer, which is the half that currently sits in two separate Google interfaces with a row cap on one of them.
Saying that plainly is more useful to you than a claim that would fall apart in your second week.
Objections
Before you start
Does this work with Shopify, WooCommerce, Magento and BigCommerce?
Yes, and with anything else that has a Search Console property, because the data comes from Google rather than from your store. There is no app to install, no theme change and no tracking script, so the platform your storefront runs on makes no difference to what you can analyse. Subfolder filtering is how most of the platform-specific work gets done, for example charting /products/ against /collections/ on a Shopify store.
How does GA4 revenue data connect, and what is required?
You authorise the GA4 property the same way you authorise Search Console, and the metrics render together from that point. Sessions, engagement, bounce, transactions and revenue appear next to clicks, impressions, CTR and position against your pages data, and they plot inside the same performance chart. What you need on your side is that ecommerce events are already firing in GA4, which for most stores is the default.
We have 100,000 URLs. Is there a catalogue size limit?
Not on the warehoused data. Every query and every page comes in without truncation, which is the reason the product exists, and exports carry no row limit either. Site auditing does have a monthly page allowance that scales with the plan, so a very large catalogue normally sits on Pro or Agency for the crawl volume rather than for the warehouse.
Do we need BigQuery or engineering time?
Neither. There is no Cloud project to create, no billing account, no dataset schema and no export job for somebody to maintain. You authorise the property and warehousing starts, which on most ecommerce teams is the difference between this happening this month and it queueing behind the replatform.
Can we connect multiple storefronts, brands or country domains?
Yes, and this is the usual shape for retail. Basic covers 10 websites, Pro covers 30 websites and Agency covers 200 websites, with extra properties at $10 each per month. A group running a separate property per market can hold every one of them in the same account and still keep access separated by team.
How far back does history go, and what happens to data from before we connected?
The backfill imports whatever Google still holds, which is its own rolling 16-month window, and everything from the day you connect accumulates permanently. Basic and Pro hold 60-month warehousing and Agency holds 120+ month warehousing. The practical consequence for a retailer is that connecting now is what makes next year's peak trading comparison possible, and delaying is the only expensive option.
Does it replace Screaming Frog, Ahrefs or Semrush?
Not entirely, and it is worth being straight about which parts. There is no backlink index and no third party keyword volume database, so competitor link analysis stays with Ahrefs or Semrush. For very large crawl-first technical work, teams keep a dedicated crawler alongside. What SEO Stack owns is the first-party performance and revenue layer, which is the half nobody currently has warehoused.
Can we get the data into our own BI or reporting stack?
Yes, through the MCP server and unlimited exports. The MCP exposes 23 tools over the warehouse and returns up to ten million rows per call, against Google's own API which caps a response at 50,000 rows and stops at 16 months, so Claude, ChatGPT, n8n, Make or your own scripts can query it directly. Everything on screen also exports to Sheets, CSV or PDF with no row cap.
Can we track AI visibility for product and category terms?
Yes. AI visibility runs against prompts you define, so you can point it at the buying questions your categories should be recommended for rather than at brand terms alone, and it reports visibility score, citations, share of voice and sentiment against named competitors. Prompt research then shows which phrasings actually trigger a mention.
How is our commercial data secured and isolated?
Access is granted per property and per workspace, and a property somebody has not been granted is not listed anywhere in their account, so a merchandising contractor with access to one brand cannot see the others. Granting access inside SEO Stack also changes nothing about the users on your origin Search Console or GA4 accounts.
Connect your store before the next peak season.
Warehousing starts the moment you connect the property, so connect now and by the time you are planning next Q4 you will have the year-on-year depth Google was going to delete, with GA4 revenue sitting beside every query that earned it.
14 day trial · Cancel anytime · No contracts · Nothing to configure