Discovery & Opportunity
New in V3Keyword data you can actually trust, because it is your own
Every keyword figure comes from your own Google Search Console data rather than third party scraped estimates, so the rankings, impressions and clicks you are looking at are the ones Google actually recorded.
Built from
- 100% data privacy
- 99.99% uptime
- Nothing to configure
- Export anytime, no limits
Trusted by leading companies
The problem
Most keyword tools show you scraped estimates from a sample of locations and devices, so the numbers rarely match what your own Search Console is telling you, and you end up making decisions on data that was never really yours in the first place.
Why the data is more reliable
Your own Search Console data, not somebody else's estimate of it
Almost every keyword tool on the market shows you scraped data, which means a third party has crawled the search results from their own locations and made an educated guess at where you rank. SEO Stack does not do that, every figure comes from your own Google Search Console property, so the numbers match what Google has actually recorded for your site.
| Consideration | Scraped keyword tools |  SEO Stack SEO Stack |
|---|---|---|
| Where the data comes from | A third party crawls the search results from their own set of locations and devices, then estimates what your rankings probably are. | Google Search Console, which is Google telling you directly what your pages actually ranked for and what people actually clicked. |
| Which keywords you see | A keyword database the provider has built, so anything outside it is simply missing, and long tail coverage is usually thin. | Every query your site was returned for, including the long tail nobody would ever have thought to track. |
| How accurate the position is | A position sampled at a moment in time from one location, which often will not match what your own reporting says. | The average position Google recorded across every impression, which is the number your own performance is measured on. |
| Devices and countries | Usually a headline figure, with device and location breakdowns priced separately or unavailable. | Filter by device and by country natively, because the underlying data is already segmented that way. |
| Clicks and CTR | Estimated from third party CTR curves rather than measured, so the traffic figures are a model, not a fact. | Real impressions, real clicks and real CTR per keyword, with GA4 metrics alongside them. |
Scraped tools still have their uses, particularly for looking at keywords on websites you do not own. For your own site though, there is no reason to work from an estimate when Google will tell you what actually happened.
Inside the tool
From the whole keyword set down to a single query
The overview tells you where you stand, the trend tells you which way you are going, and clicking into a keyword tells you what to do about it.
Your whole keyword footprint on one screen
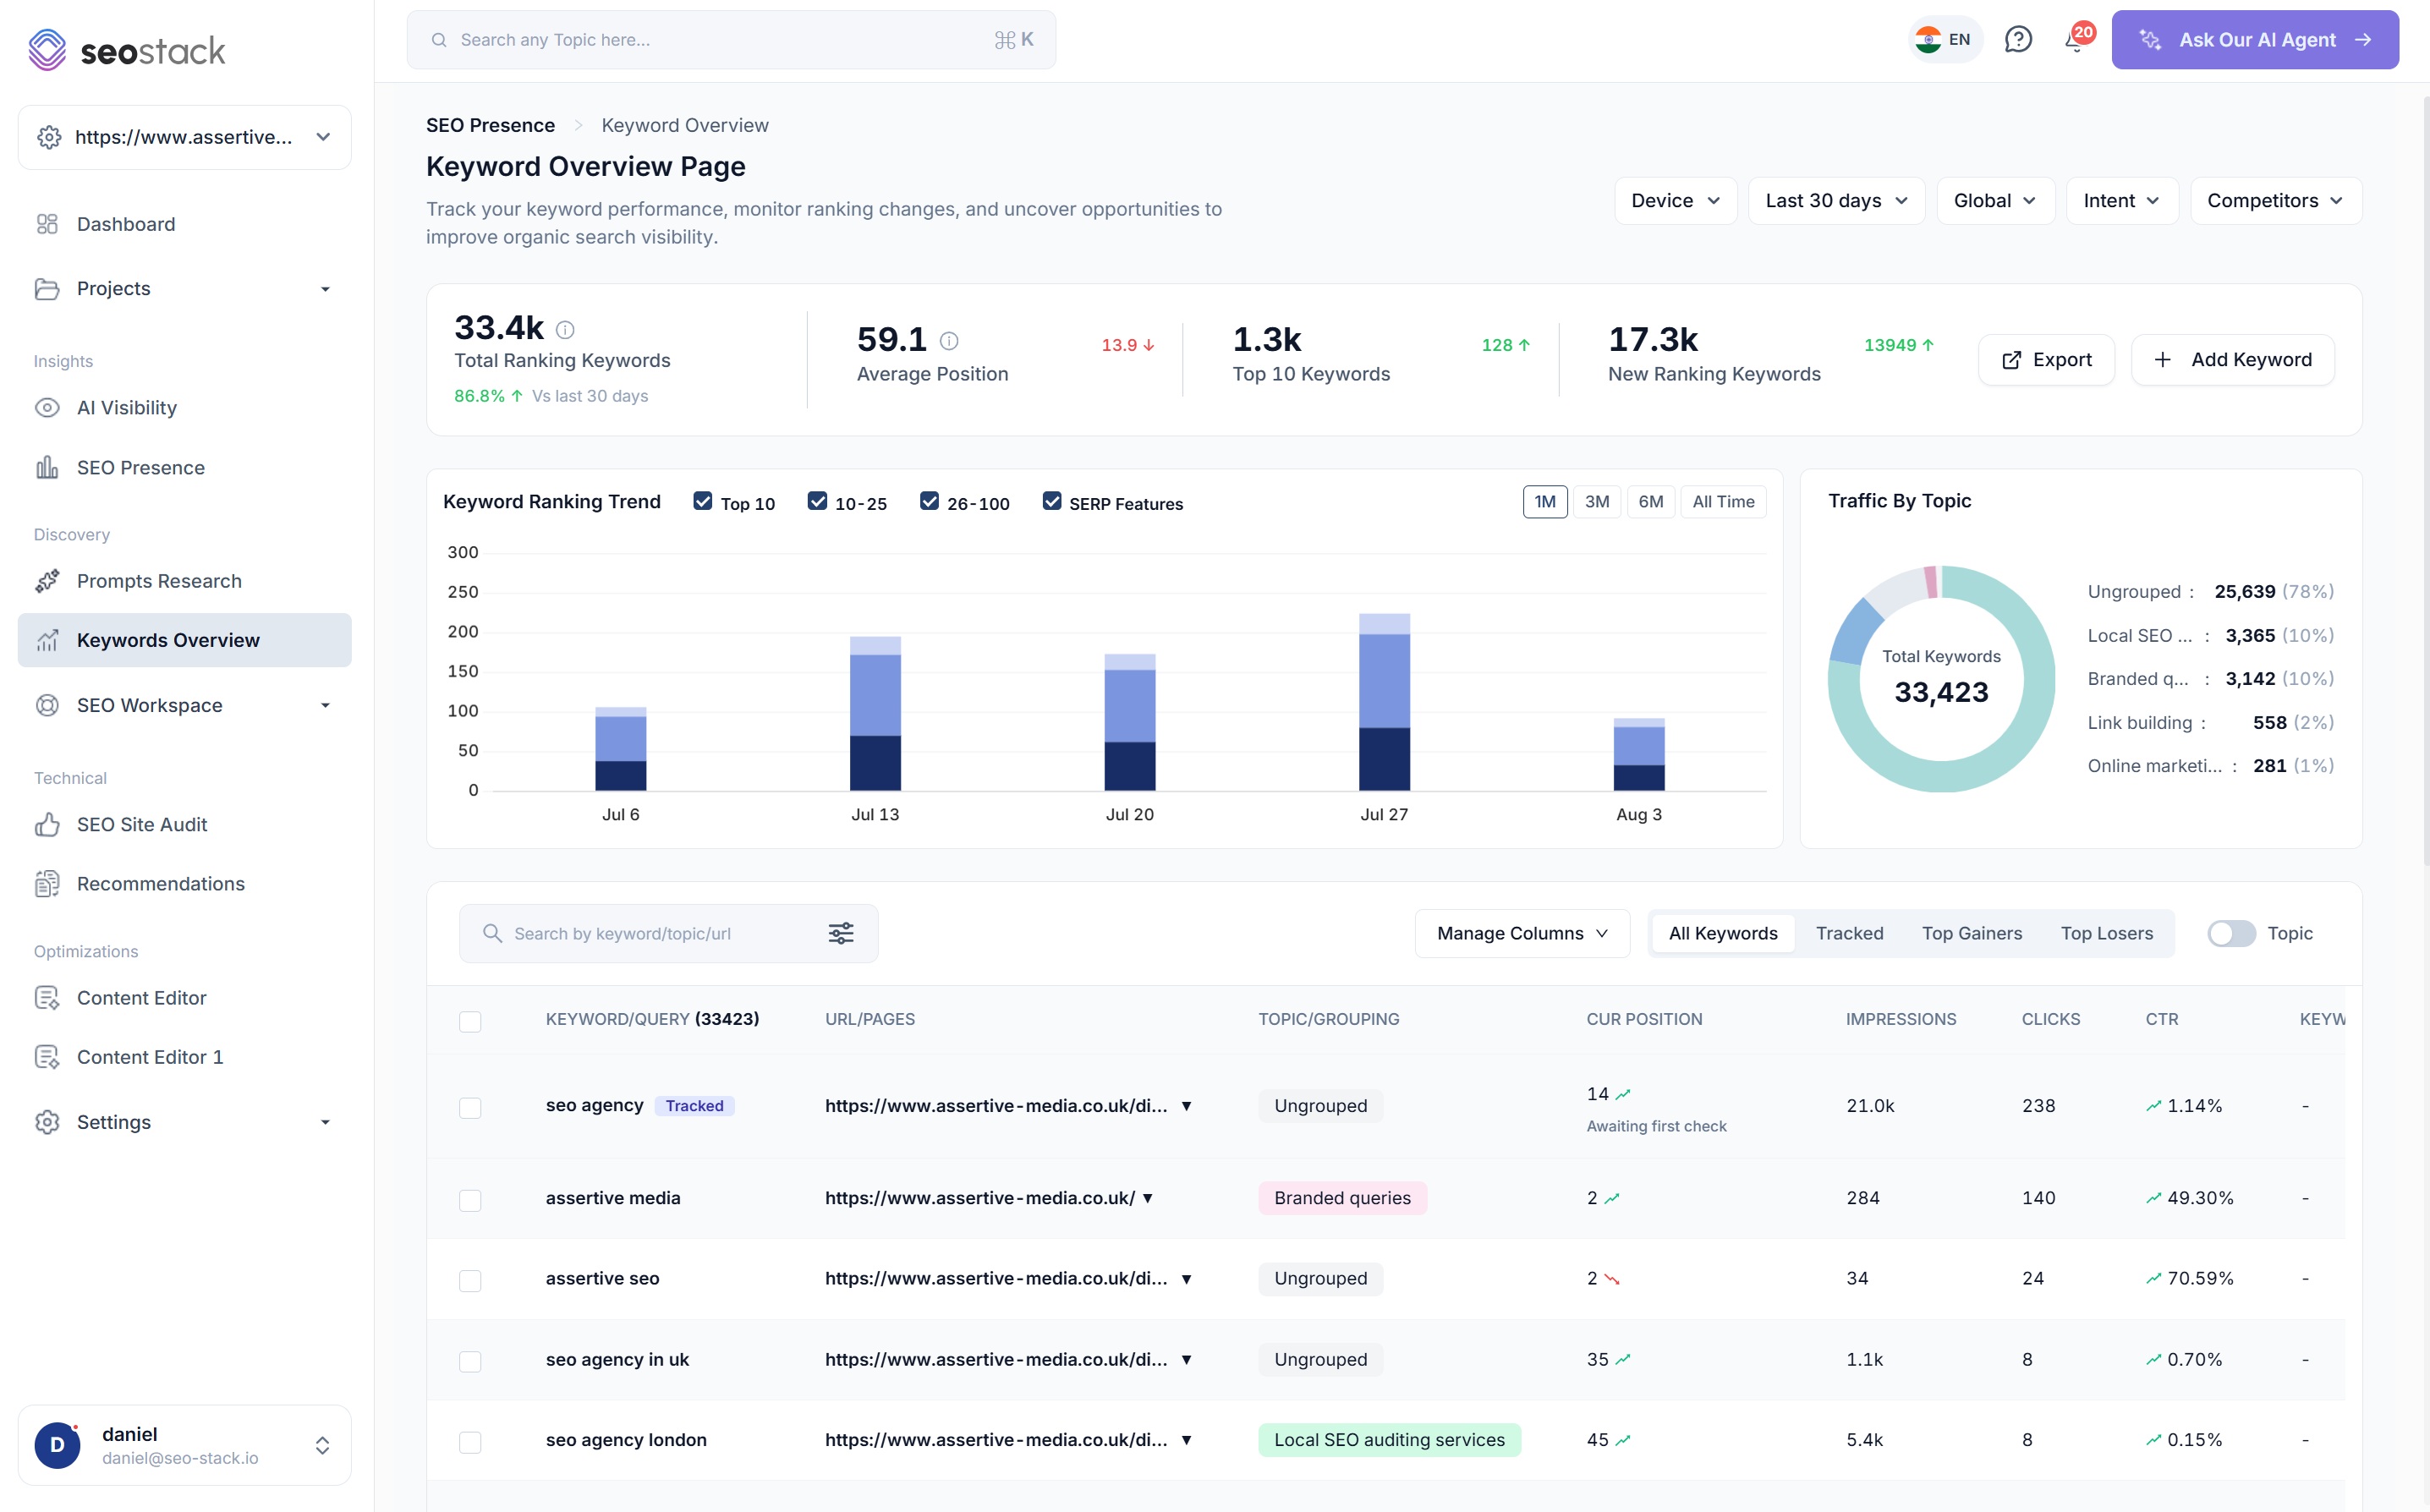
- Total ranking keywords, average position, top 10 keywords and new ranking keywords, each with movement against the previous period
- A keyword ranking trend chart split into top 10, 10 to 25, 26 to 100 and SERP features so you can see how your position distribution is changing
- Traffic by topic as a breakdown of where your ranking keywords actually sit
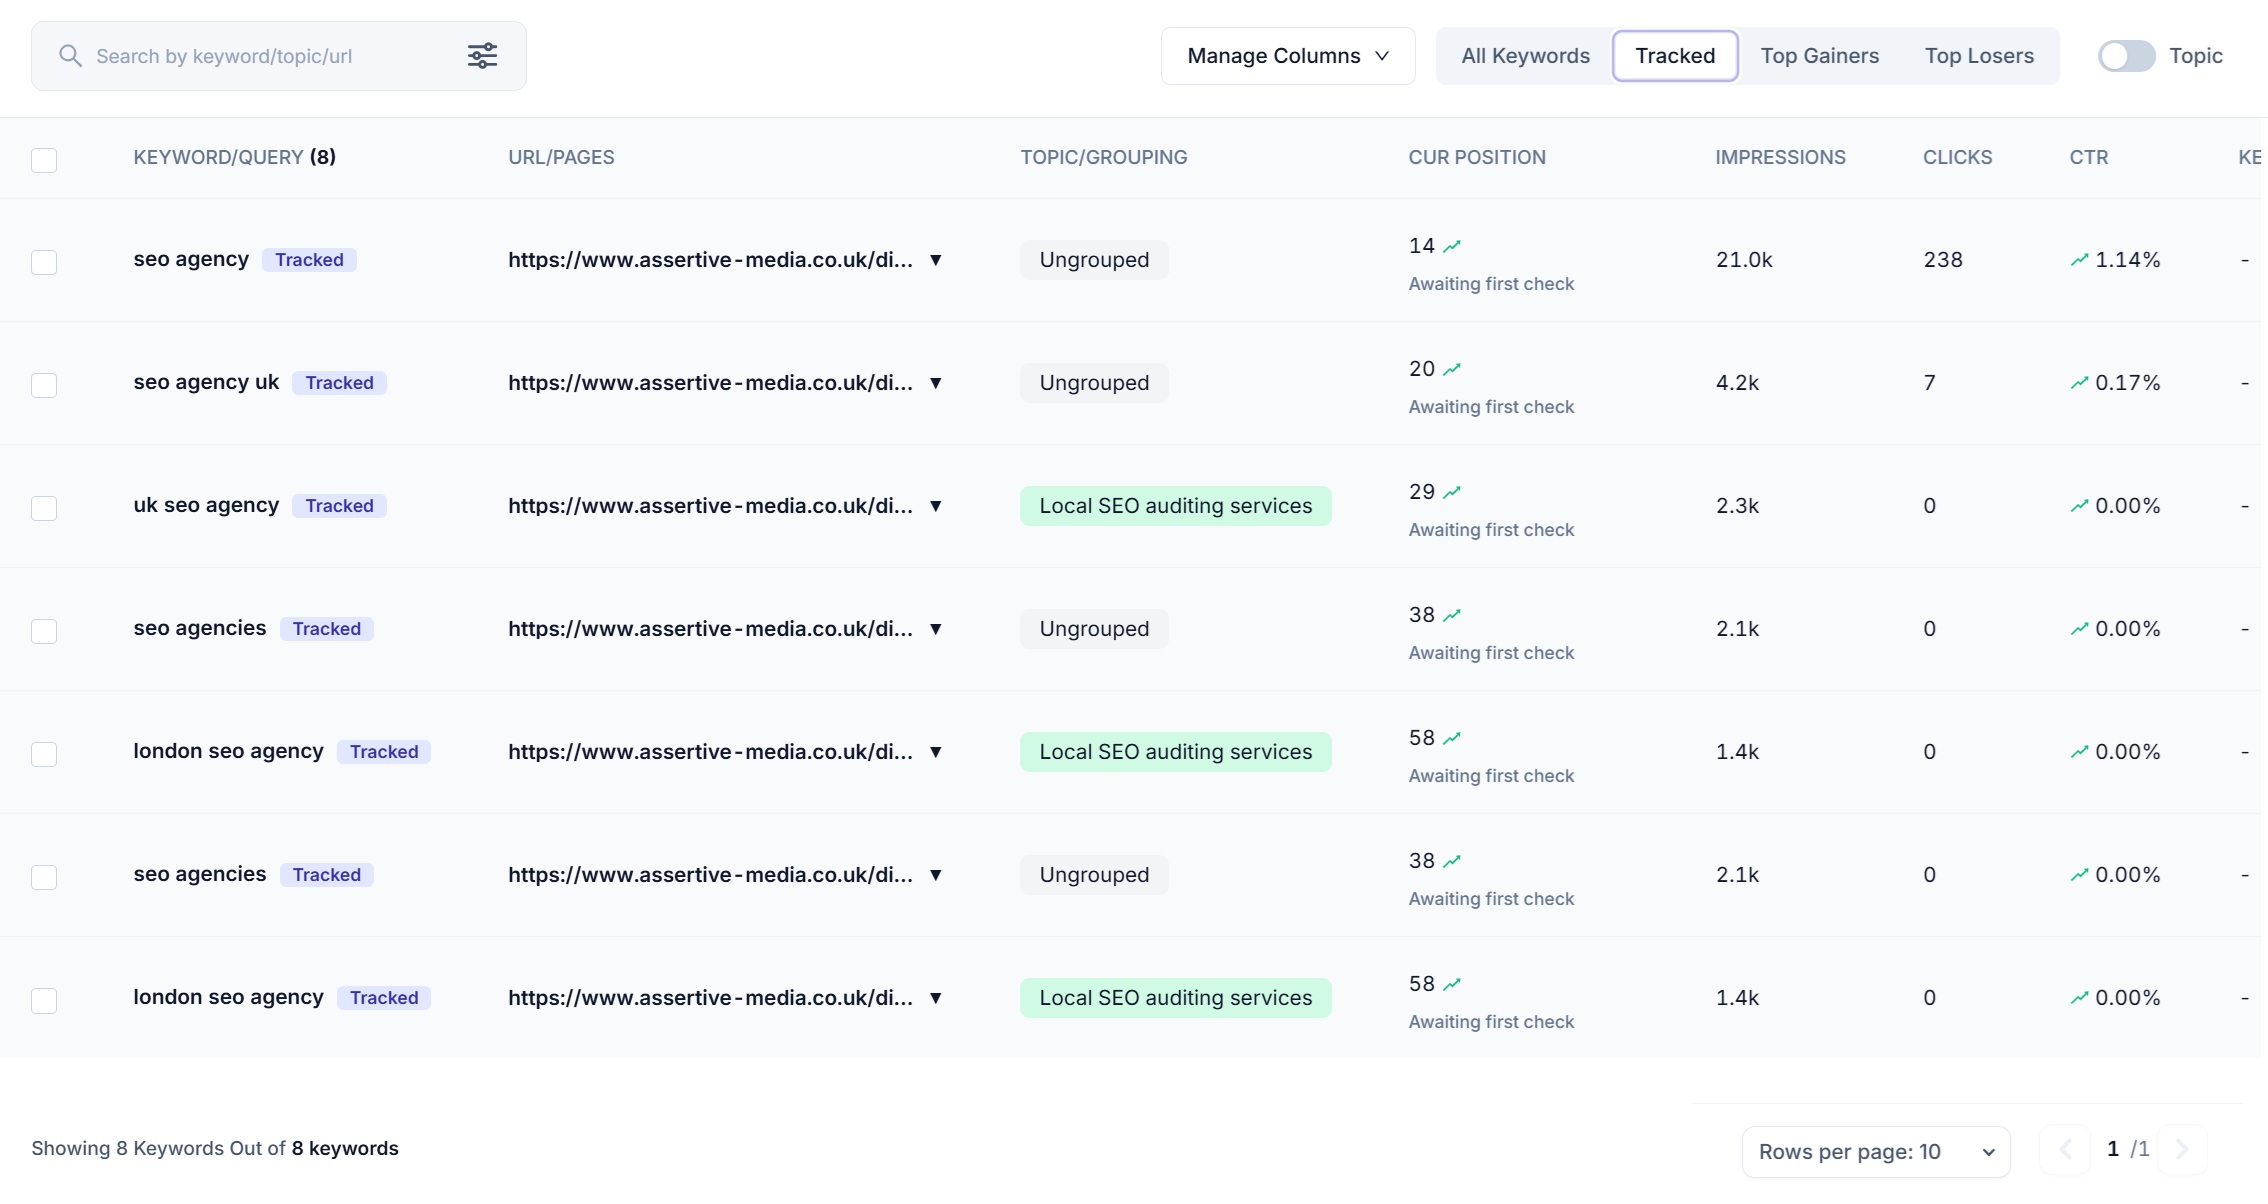
- All keywords, tracked, top gainers and top losers available as separate views
- Manage which columns you see, search the set, and export the lot
Watch your position distribution move month after month
- Switch the trend between 1 month, 3 months, 6 months or all time
- Toggle the position bands on and off so you can isolate what is happening in the top 10 rather than the whole set
- Because your data is warehoused, the all time view keeps reaching back rather than stopping at Google's 16 month cut off
- This is the chart to put in front of anyone who wants to know whether SEO is actually working
Direction matters more than any single number
A site can hold the same average position for a year while quietly moving thousands of keywords out of the top 10 and into the 26 to 100 band, and the distribution chart is where that shows up.
Group keywords into topics, then get the summary
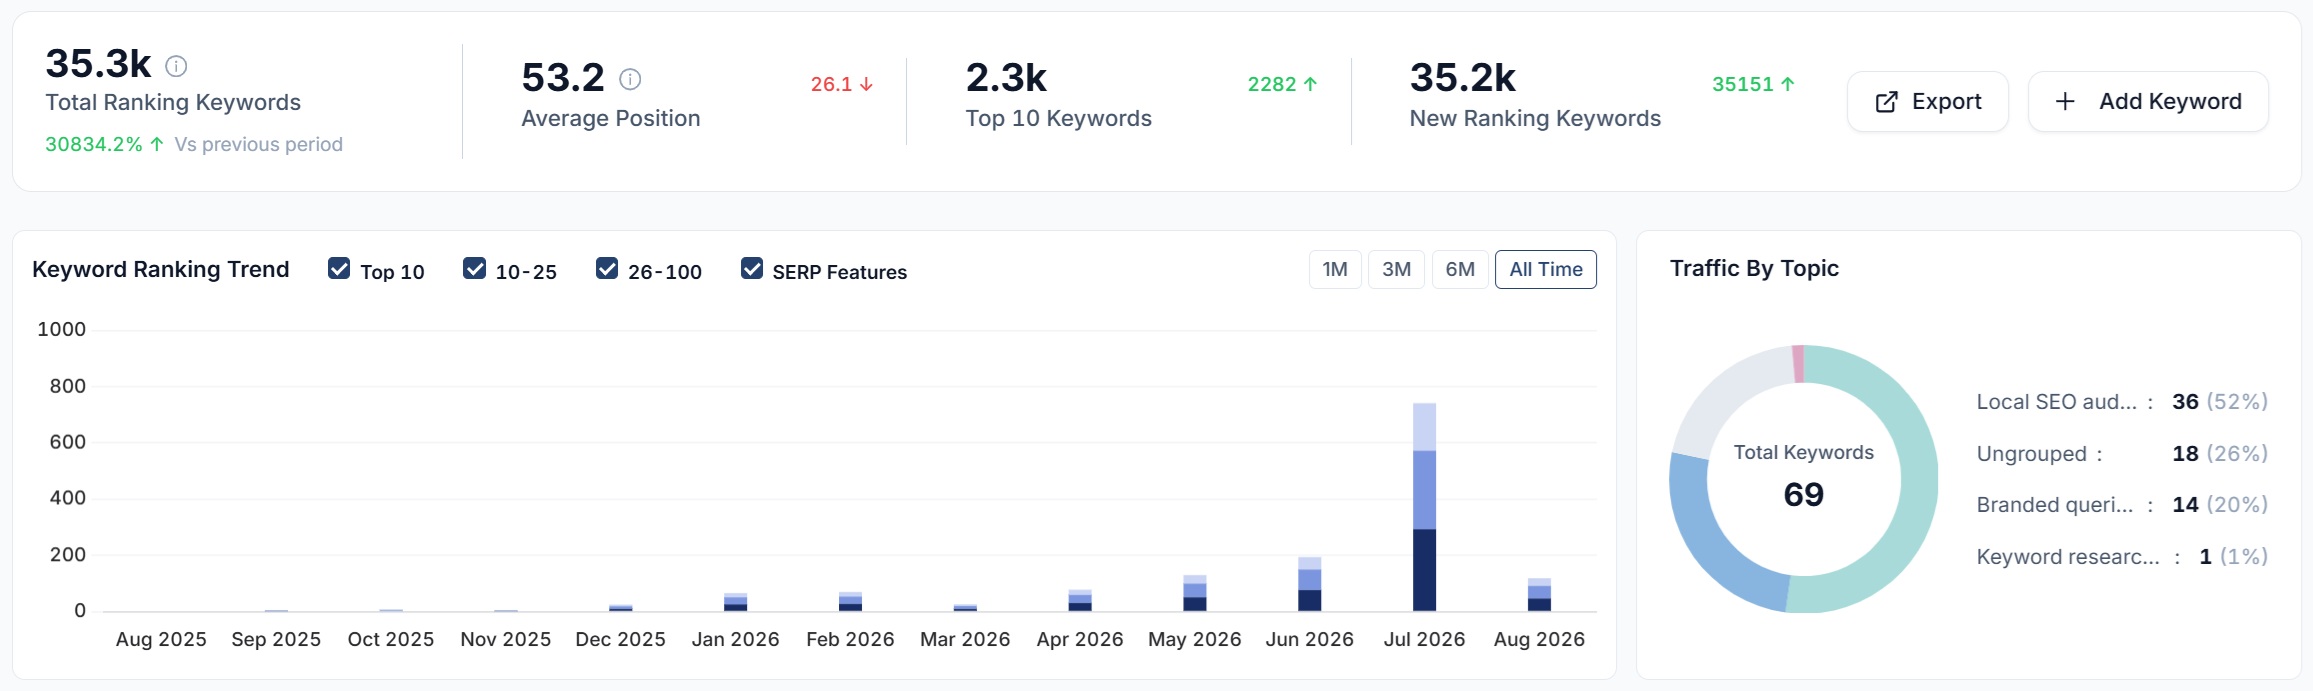
- Group keywords by topic, by intent or by your own keyword group names
- Ask AI to add a topic and it will assign related keywords to it for you, so grouping thousands of keywords is not a manual job
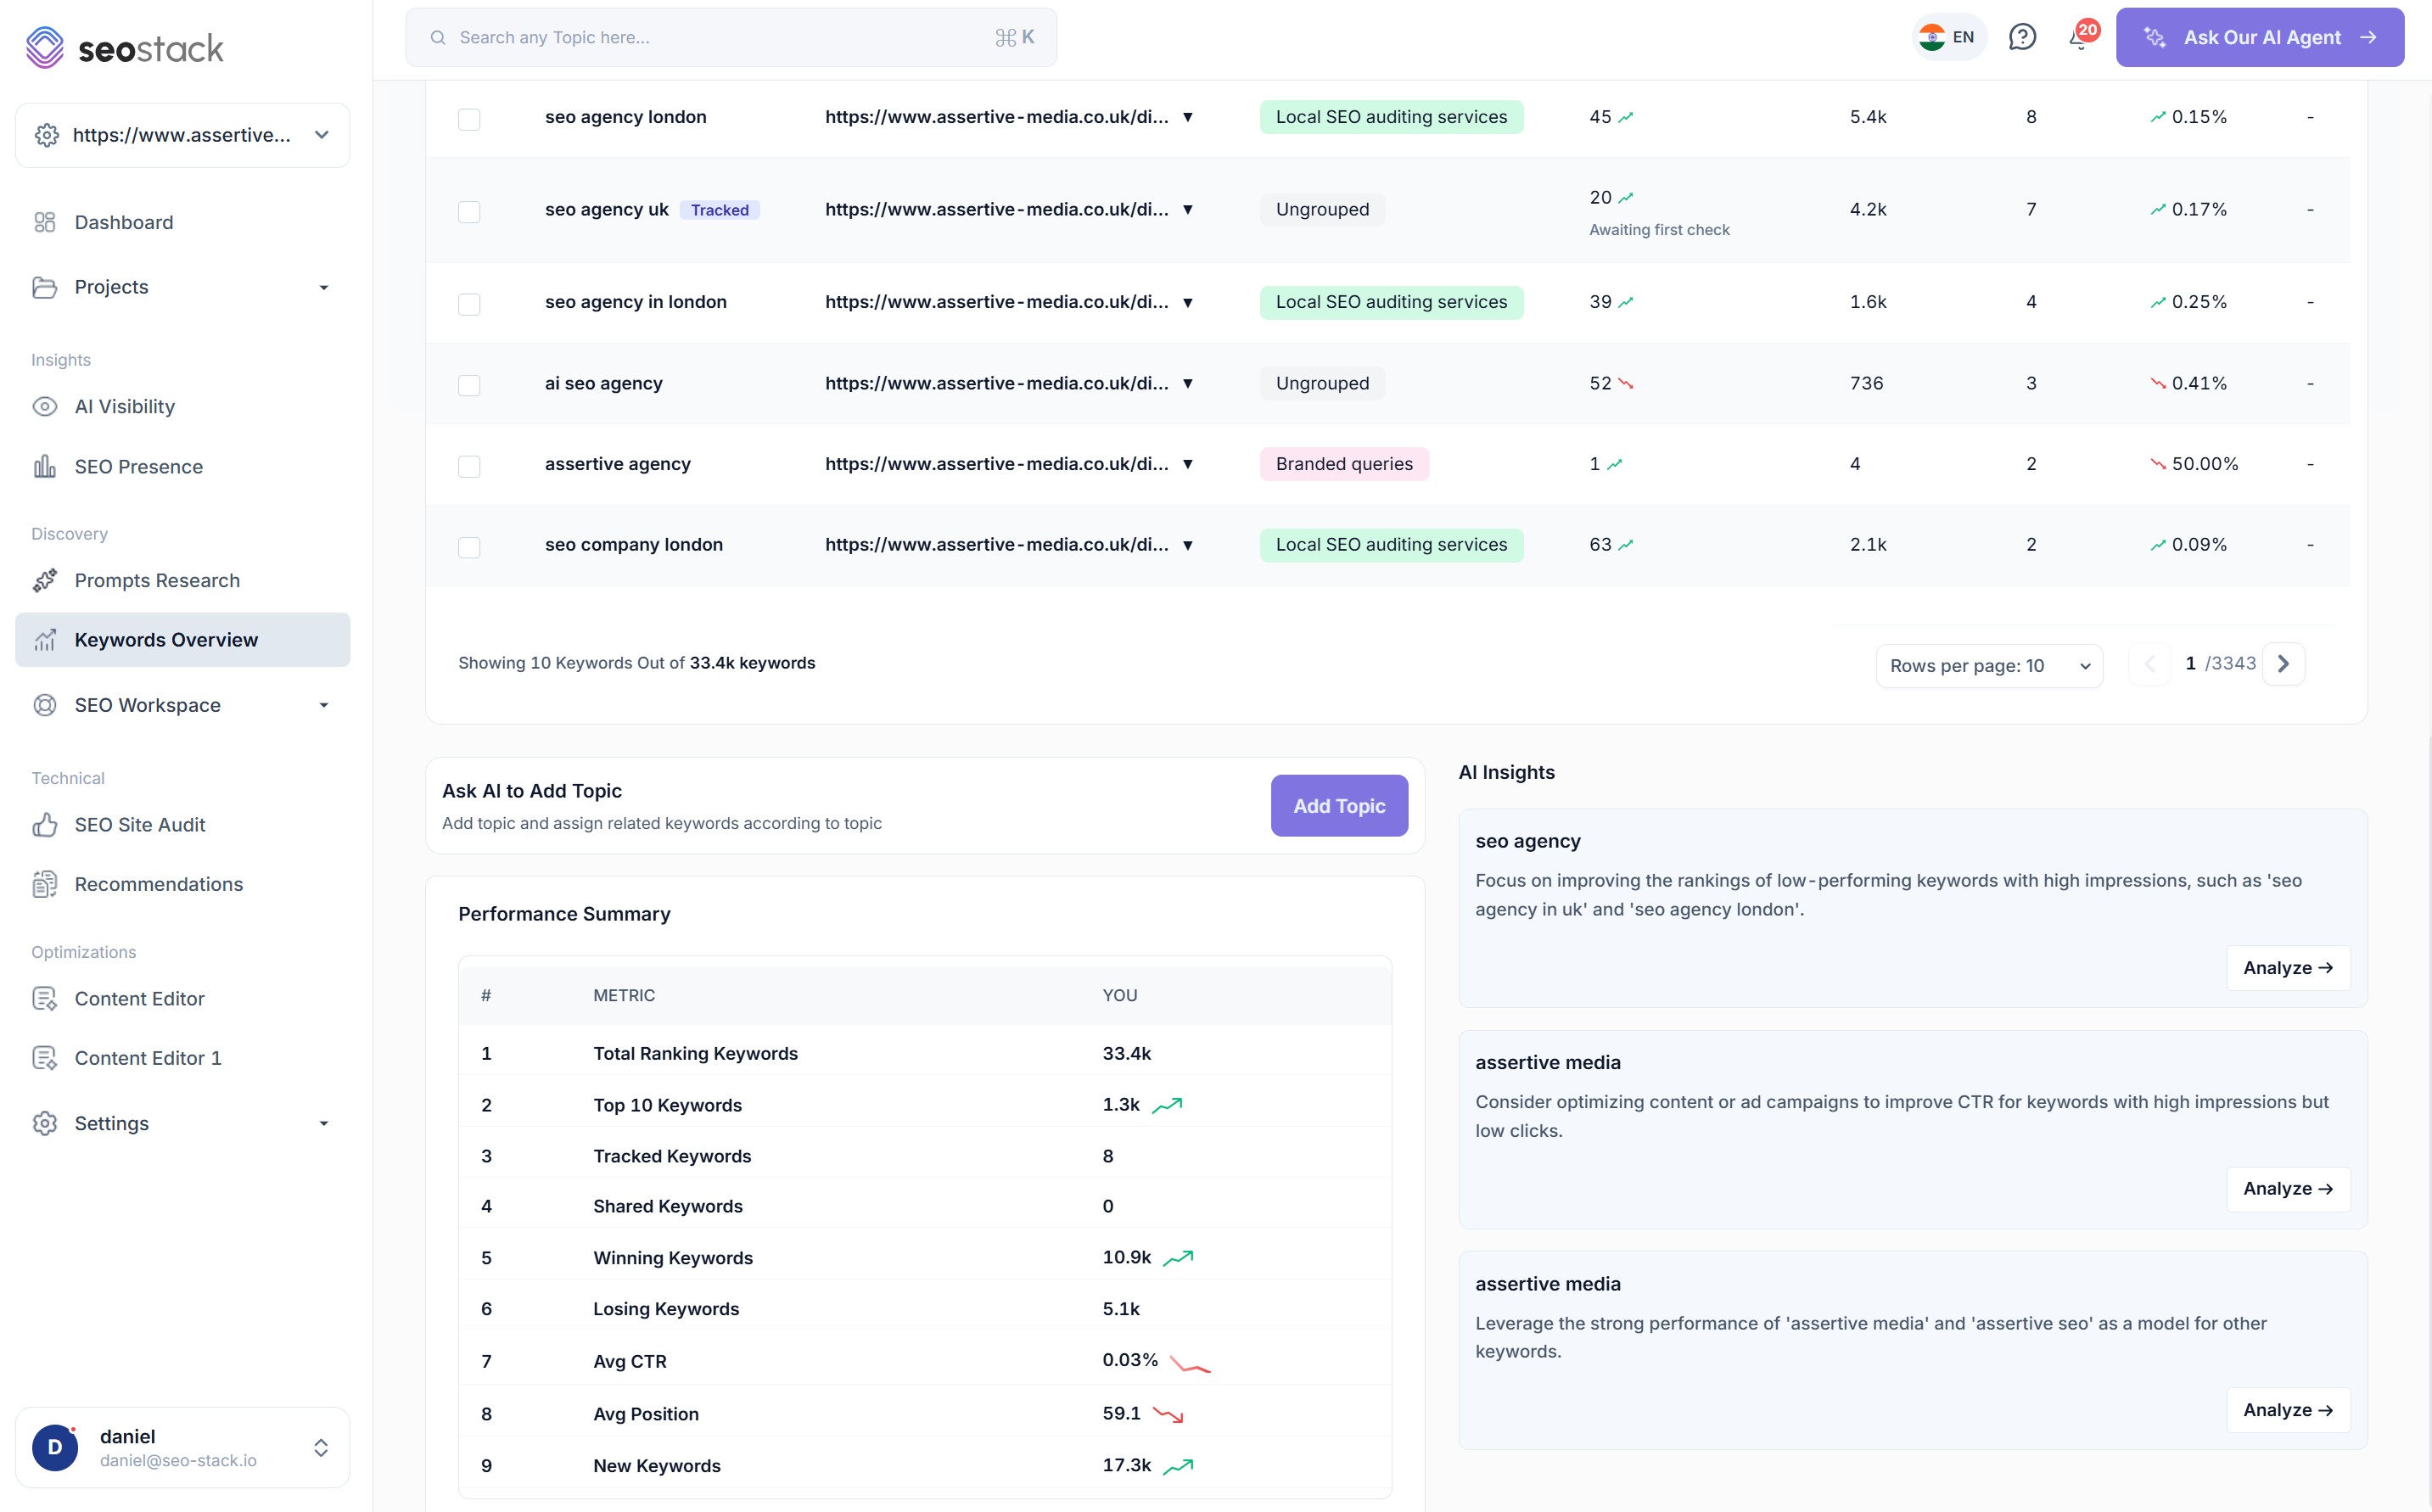
- A performance summary covering total ranking keywords, top 10, tracked, winning, losing, average CTR, average position and new keywords
- AI Insights pick out the specific keywords worth working on and explain why
- Analyse any insight to go deeper on it
Click any keyword and see everything behind it
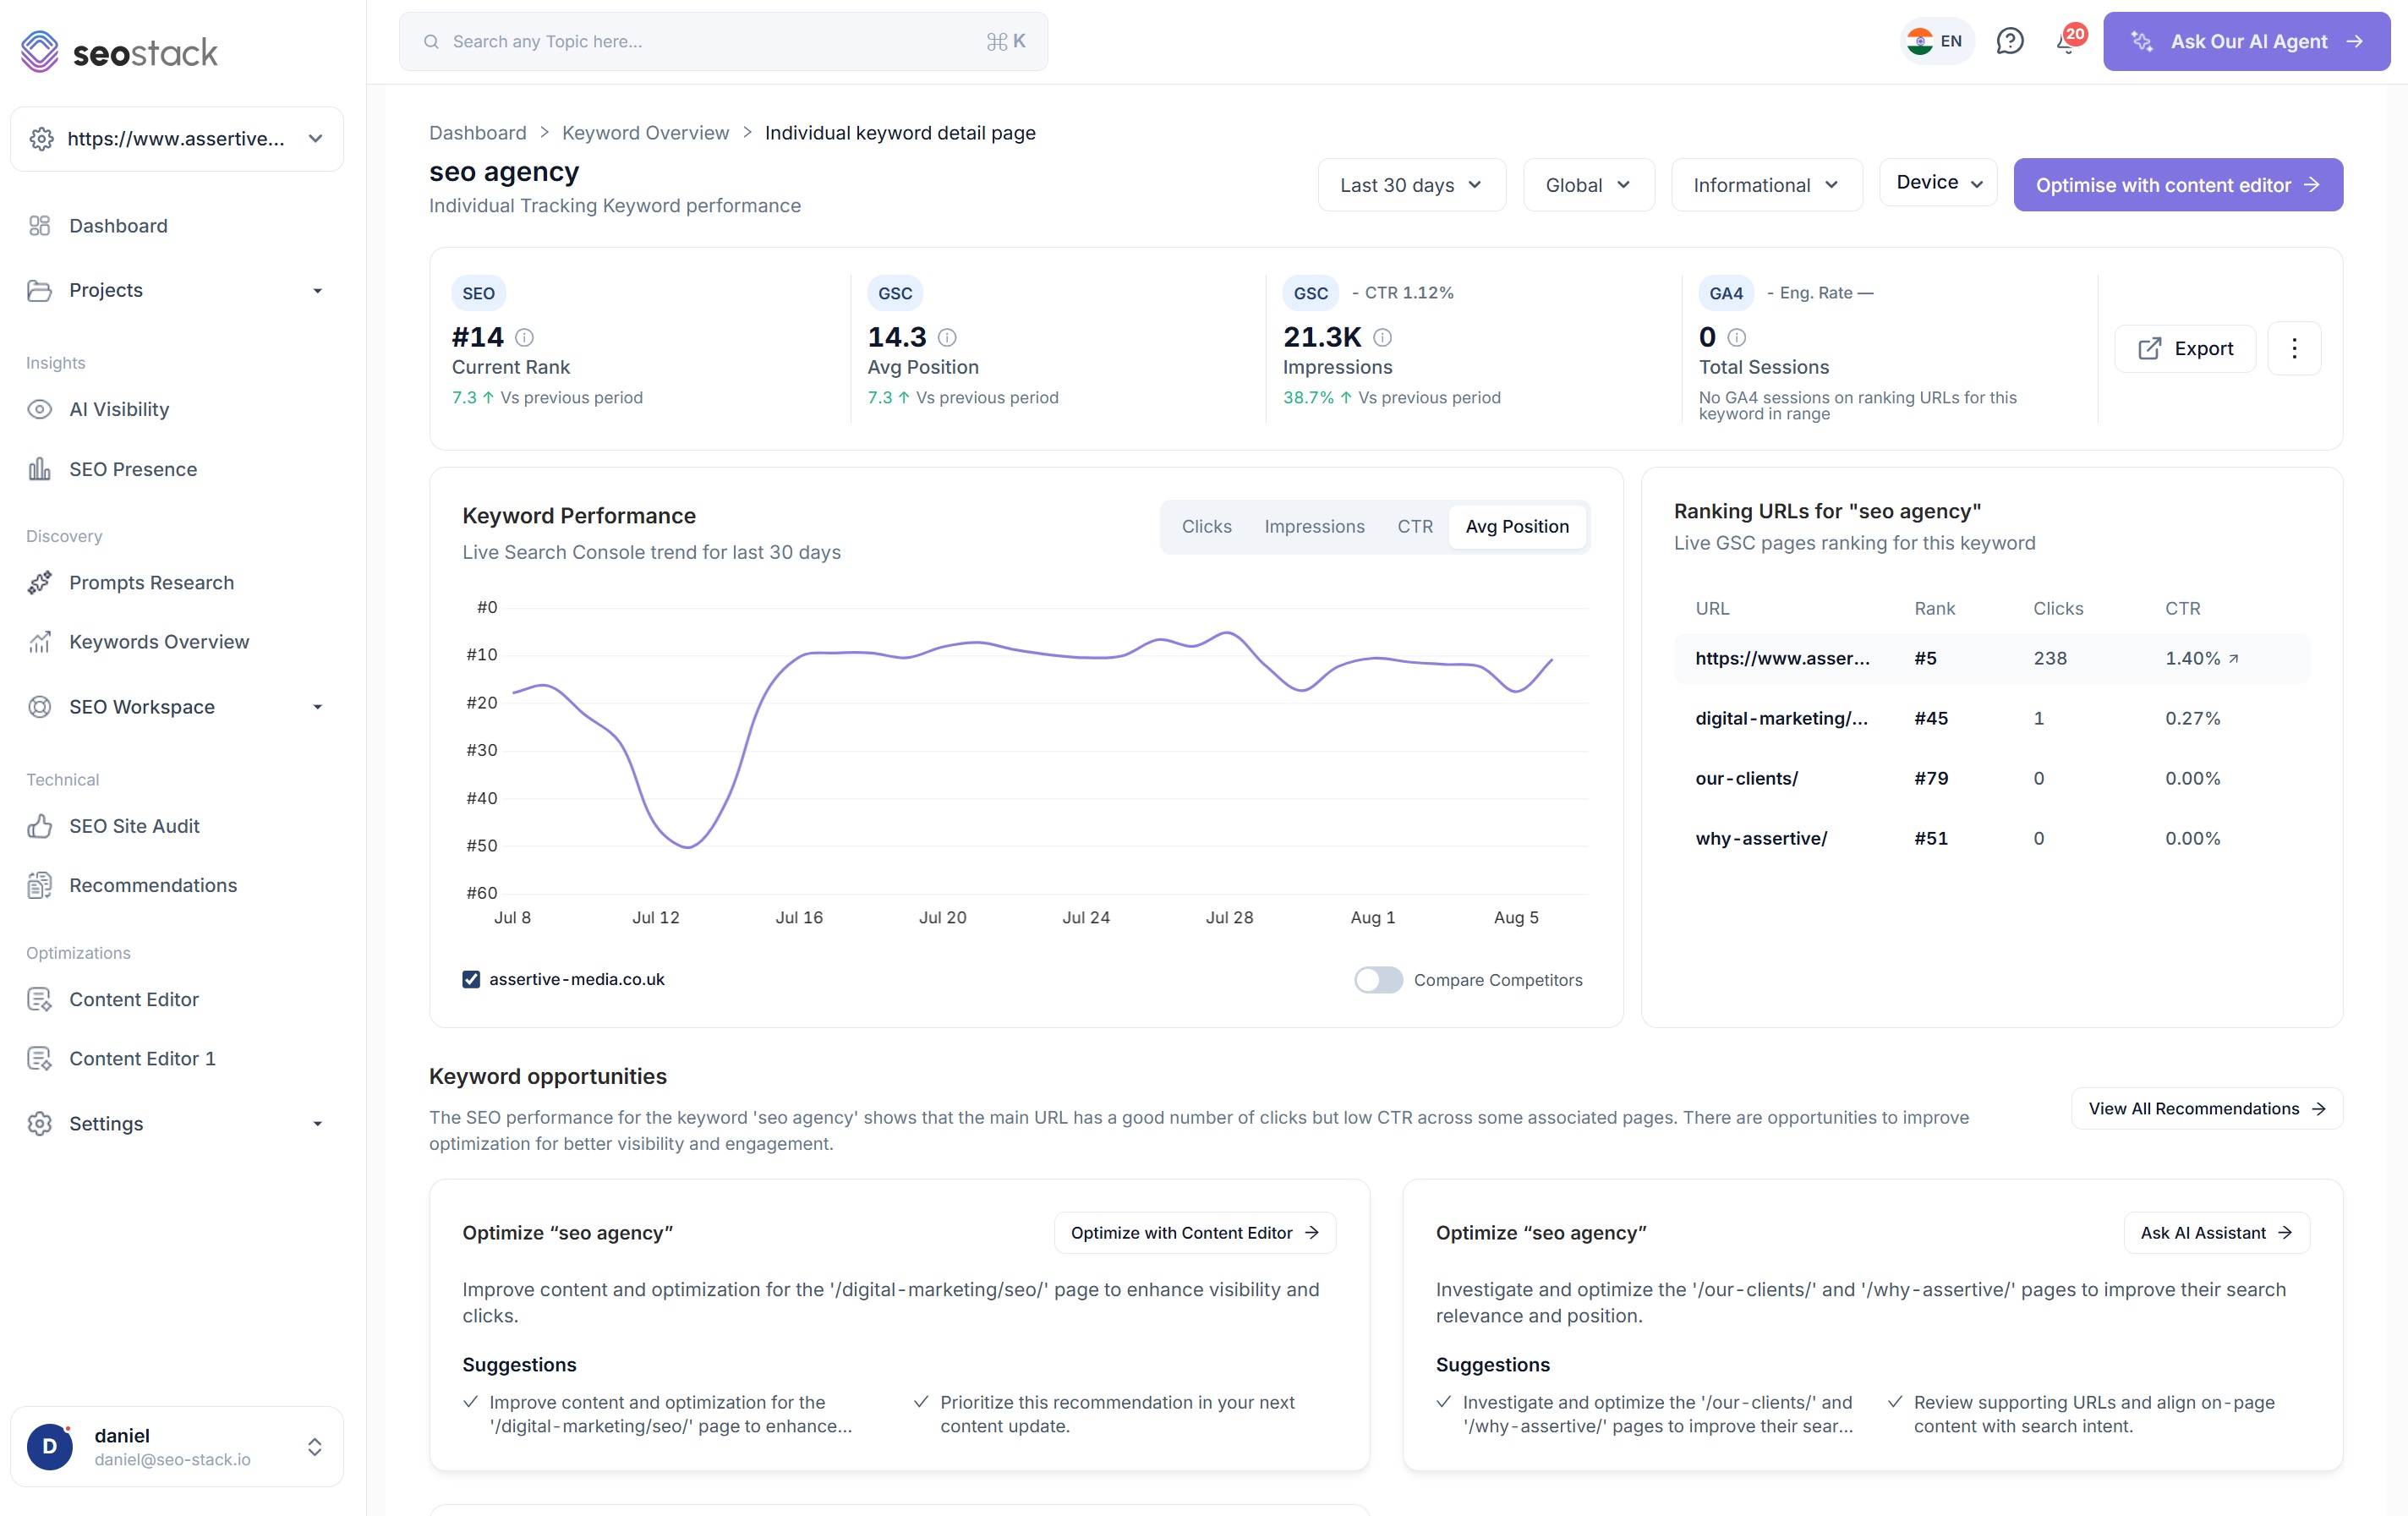
- Current rank, average position, impressions and GA4 sessions for that single keyword
- A keyword performance chart you can switch between clicks, impressions, CTR and average position
- Every URL Google is returning for the keyword, with rank, clicks and CTR on each one
- Keyword opportunities written out, with suggestions on what to change
- Compare competitors on the same keyword, or send it straight into the Content Editor
This is where cannibalisation becomes obvious
When four of your own URLs are all being returned for the same keyword and none of them rank well, you are looking at the cause rather than guessing at it.
Filtering & segmentation
Slice the keyword set until it answers your actual question
Every view can be filtered by device, timeframe, country, intent and competitor, so you are never stuck looking at a single blended number that hides more than it shows.
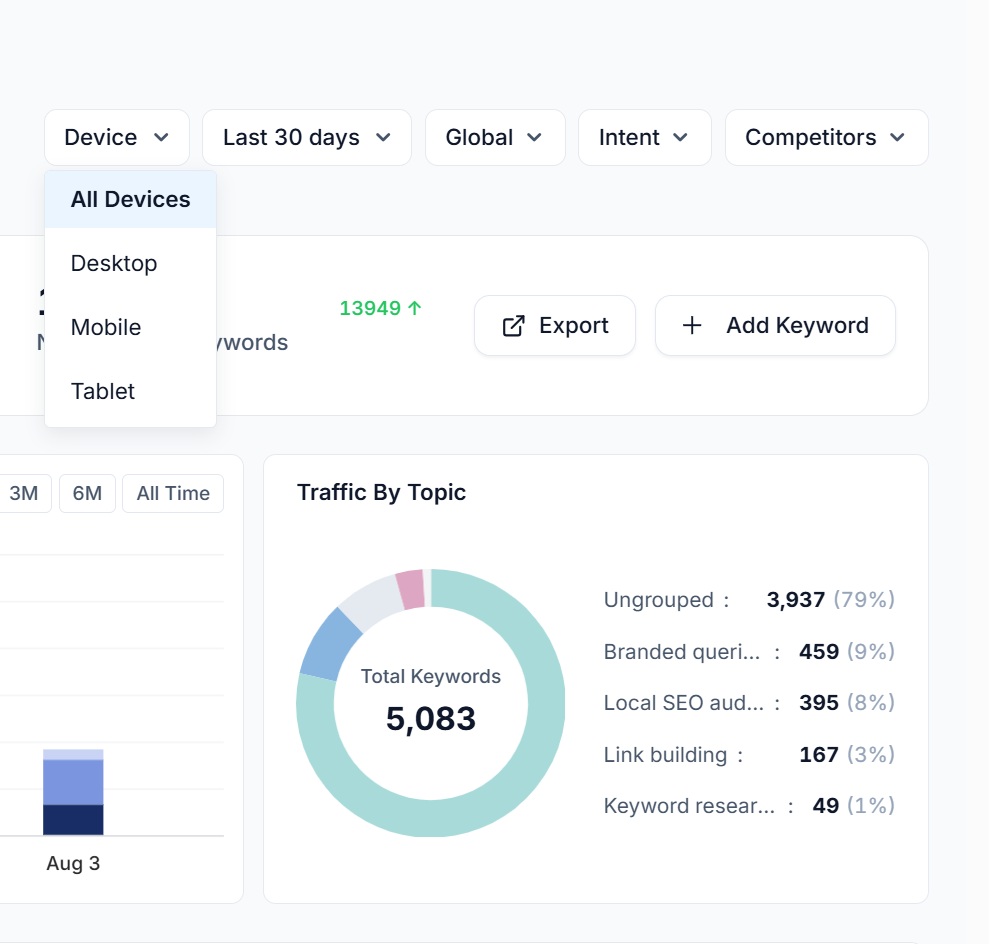
Device
Split desktop, mobile and tablet, which matters more than most people allow for, because a keyword sitting at position 6 on desktop and position 18 on mobile is really two different problems.
Country and location
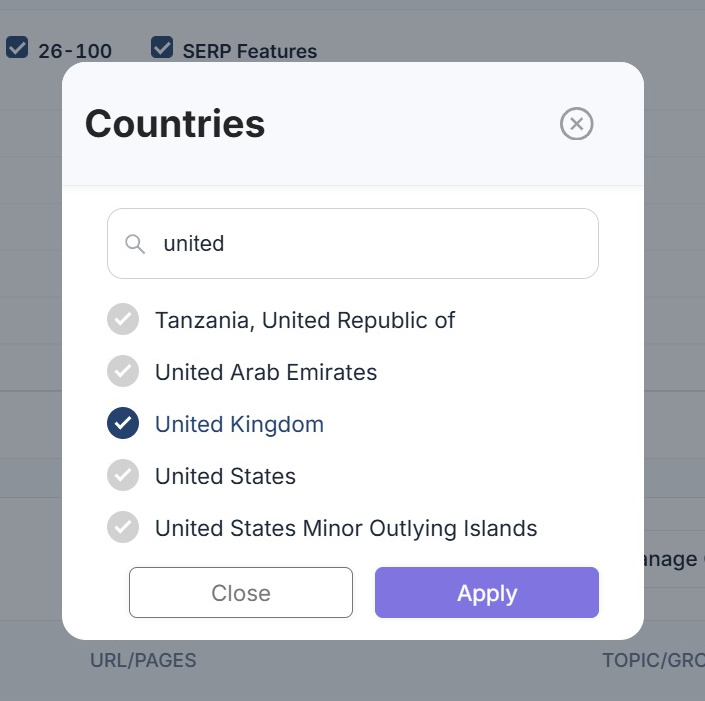
Filter globally or down to individual countries, so an international site can be assessed market by market rather than as one blended average that describes nobody.
Intent
Segment by intent so you can separate the informational keywords bringing in readers from the commercial and transactional ones bringing in customers.
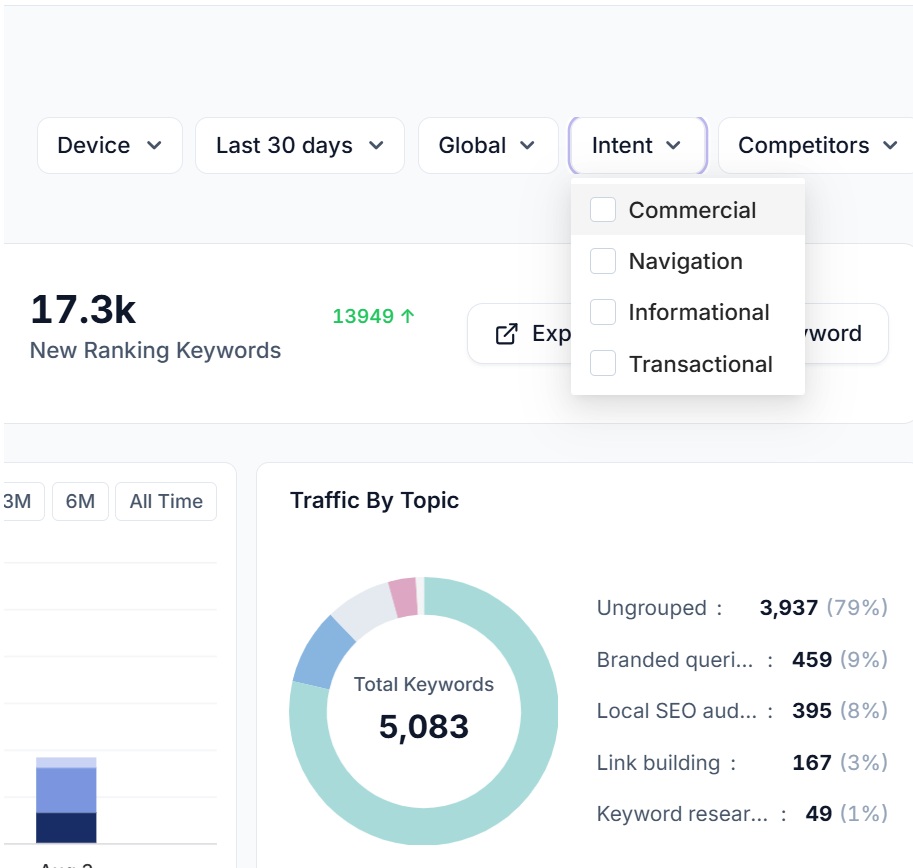
Timeframe
Set the period you want to look at, and because everything is warehoused you can keep going back rather than running into Google's limit part way through the analysis.
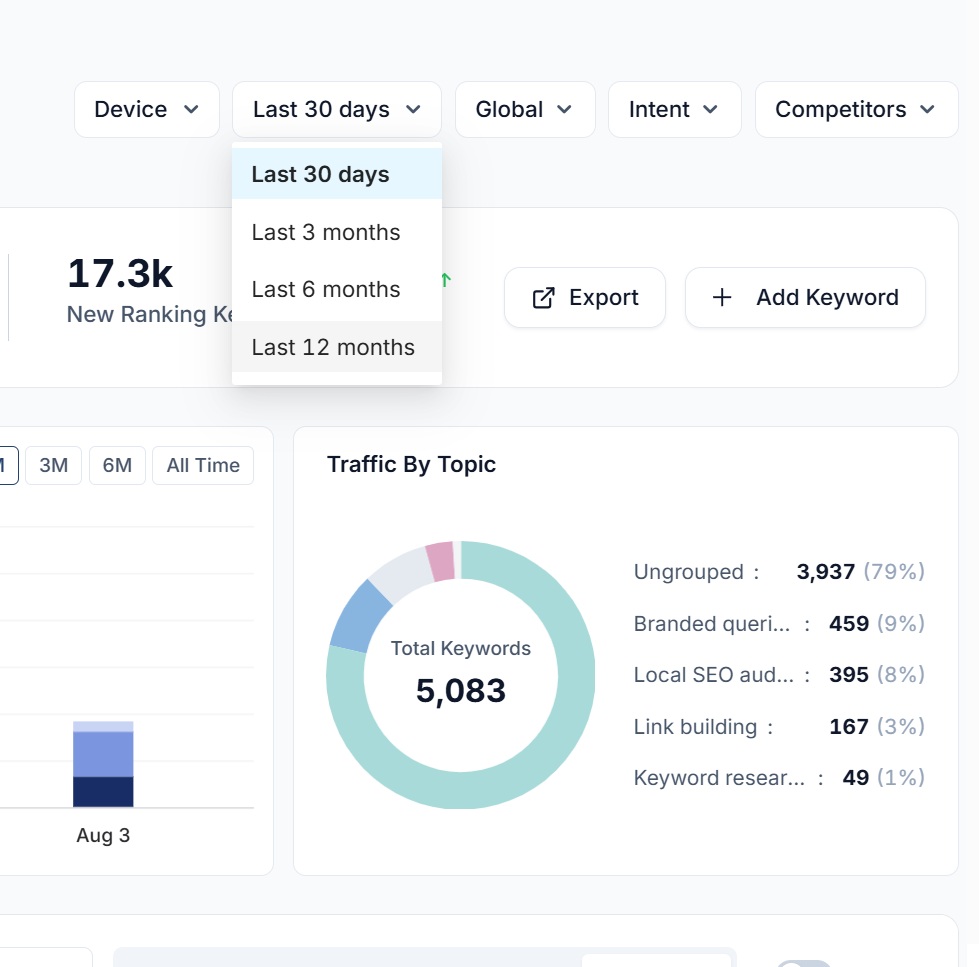
Movement & tracking
See what gained, what lost and what you are tracking
Position changes within whatever timeframe you have set, split into the keywords climbing and the ones falling away, plus a tracked set for the keywords that genuinely matter to the business.
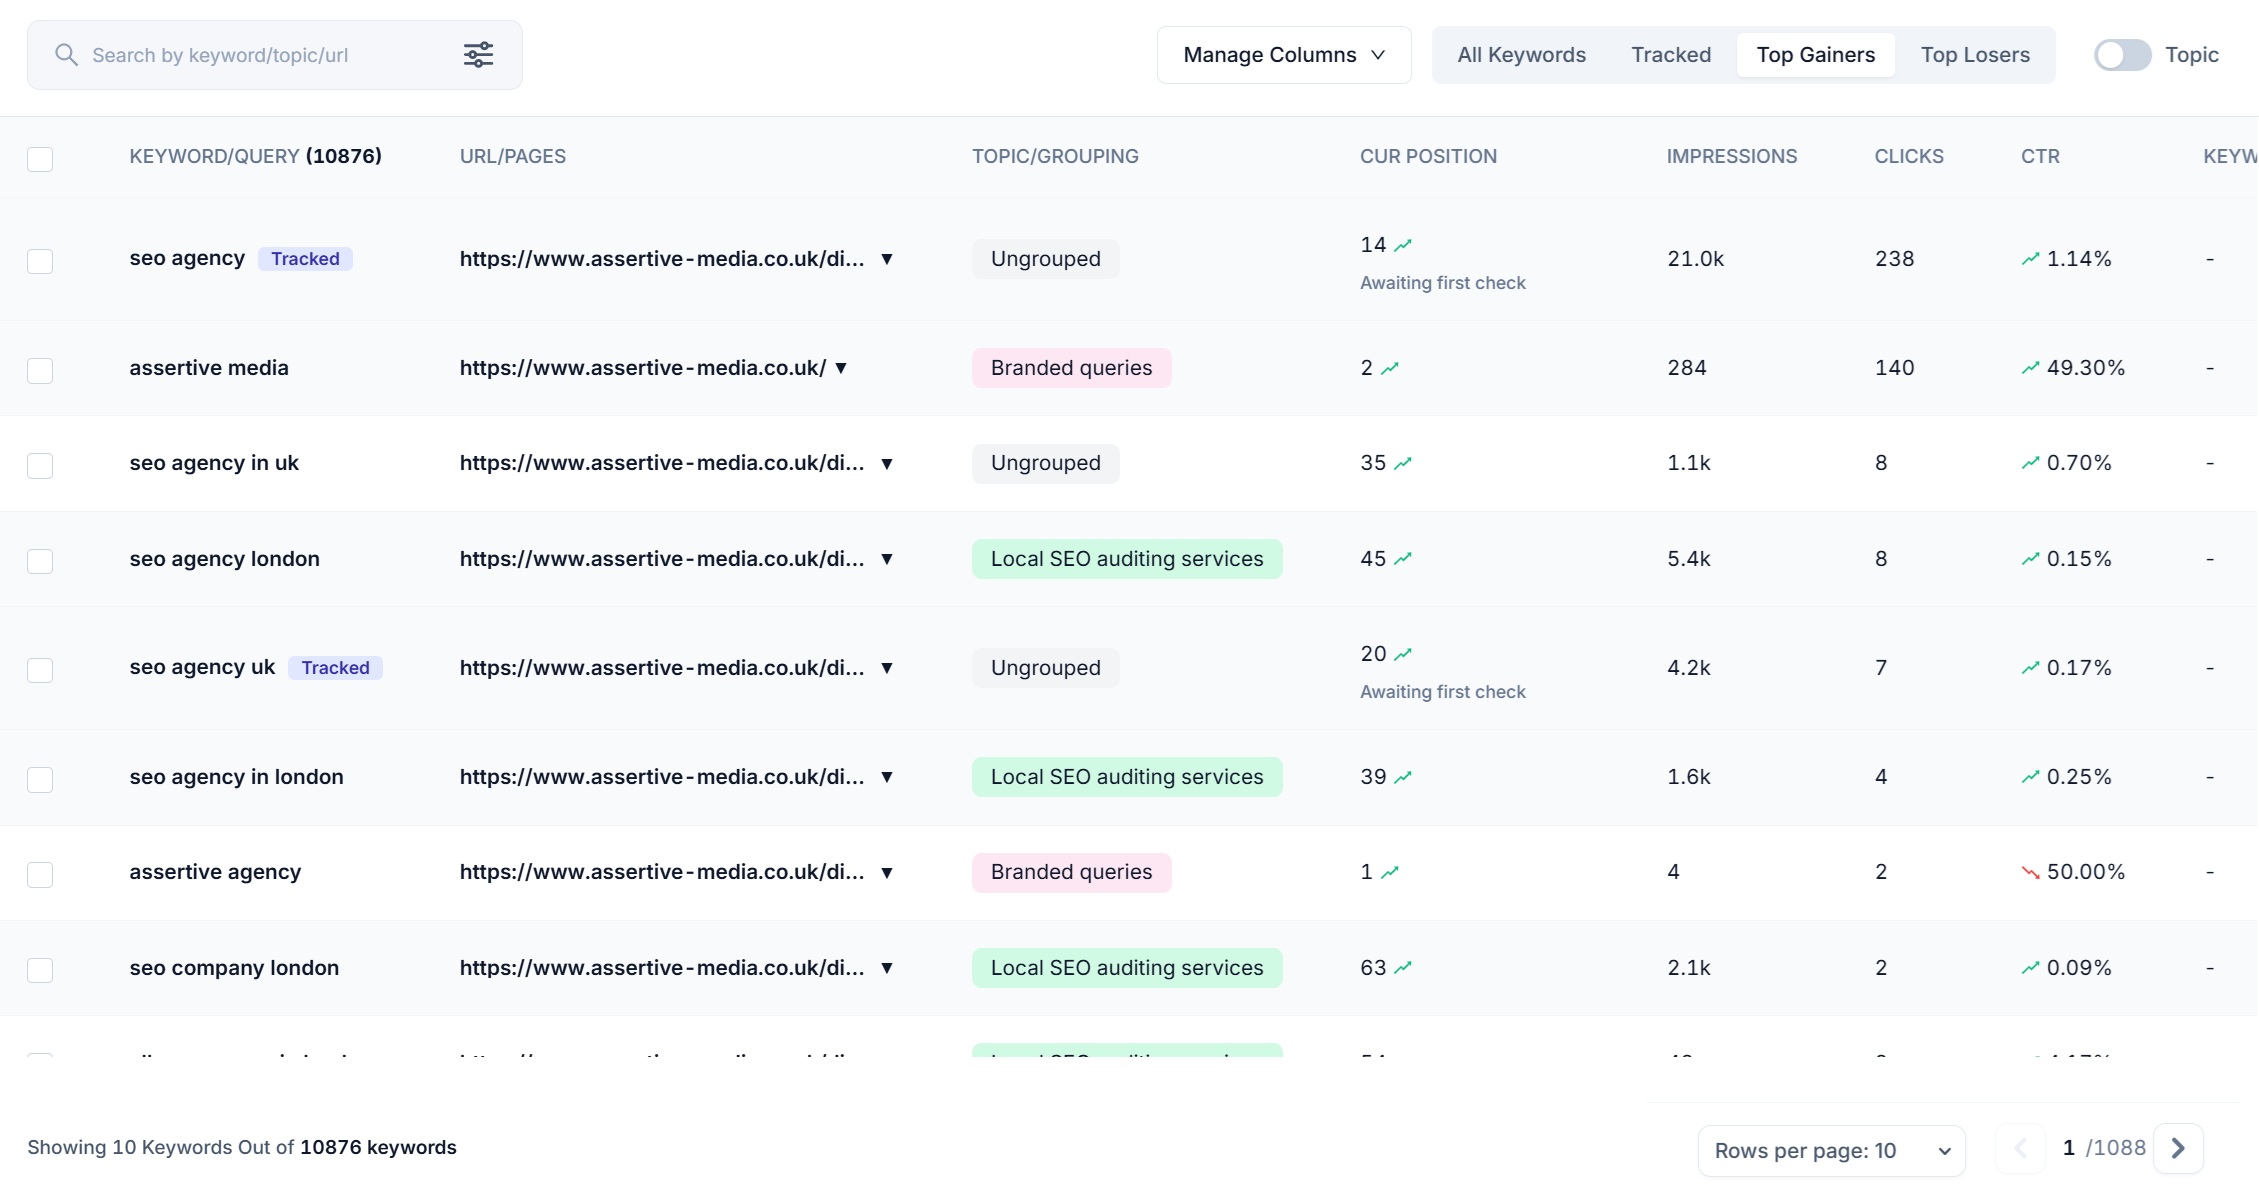
Top gainers
The keywords that have improved the most across your chosen period, which is usually where you find out that something you shipped three weeks ago is working.
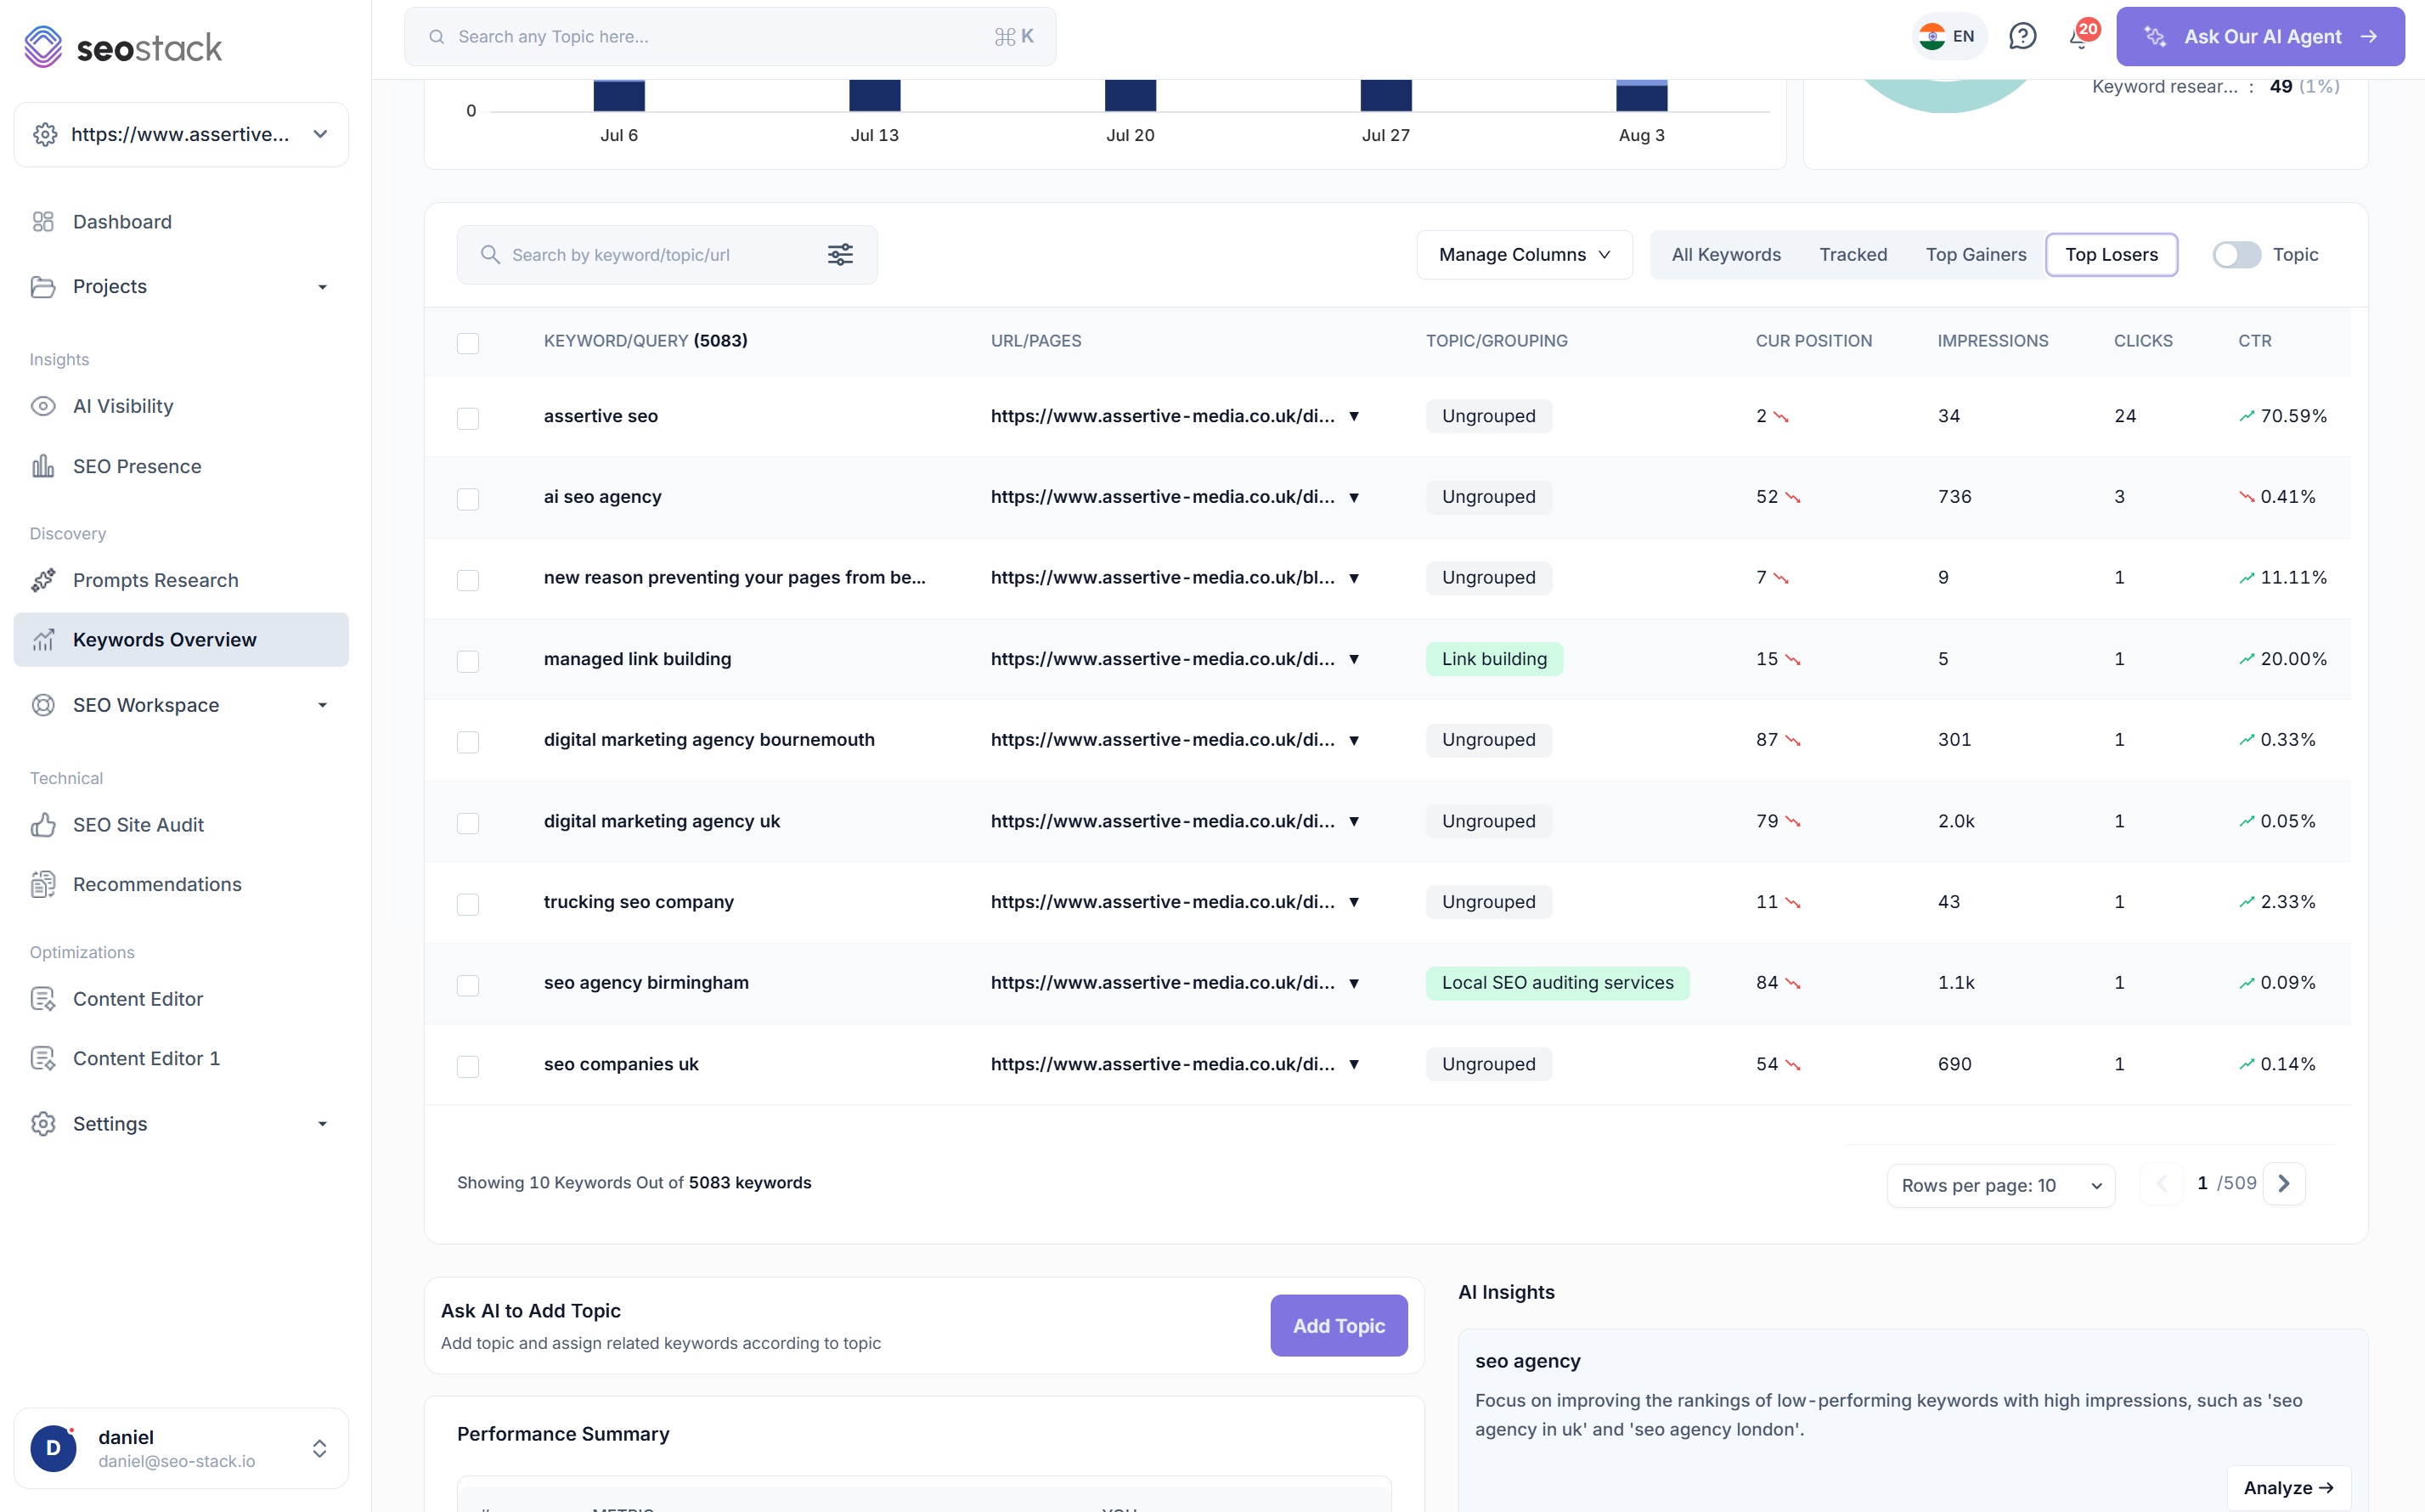
Top losers
The keywords that have dropped the furthest, ranked so you can start with whatever is costing you the most rather than whatever you noticed first.
Tracked keywords
Set up specific keyword groups for rank tracking so the terms that matter commercially are monitored properly rather than getting lost among tens of thousands of others.
AI Insights across your whole keyword set
Alongside the performance summary you get written insights on which keywords are worth prioritising and why, and you can ask the AI Assistant to generate topic groups so that grouping tens of thousands of keywords stops being a manual job.
What people use it for
The jobs this actually gets used for
Proving SEO is working
The position distribution chart over time is the clearest way to show that a campaign is moving keywords up through the bands, and it is far more convincing than a single average position figure that barely moves.
Identifying cannibalisation
Because you can see every URL Google is returning for a keyword, you can spot the cases where several of your own pages are competing for the same term and none of them are winning it.
Finding opportunities
Keywords with high impressions and low clicks, or pages sitting just outside the top 10, are usually the quickest wins available, and they are visible as soon as you sort for them.
Understanding which pages rank
Knowing which URL Google chooses to return for a keyword tells you whether your intended landing page is doing its job or whether something else on the site has taken it over.
Benchmarking against competitors
Competitor data sits alongside your own, so you can see where you are genuinely behind rather than assuming it, and target the keywords where the gap is worth closing.
Reporting you can defend
Because everything comes from Search Console, nobody can argue that the numbers are a third party estimate, which removes an entire category of pointless conversation from client reporting.
What you get out of it
The outcome, not the feature list
See the real trajectory of your rankings rather than a third party estimate of it
Spot cannibalisation by seeing every URL Google returns for a keyword
Find the keywords with impressions but no clicks that are worth working on next
Connect a property. Watch the data start stacking.
Warehousing begins the moment you connect your Search Console property, there is no Google Cloud project to set up, no BigQuery and no schema to design. You simply connect your property and SEO Stack starts storing every row of your data from that day onwards.
- Credit card required
- Cancel within the trial and you won't be billed
- No contracts