Search Console Data
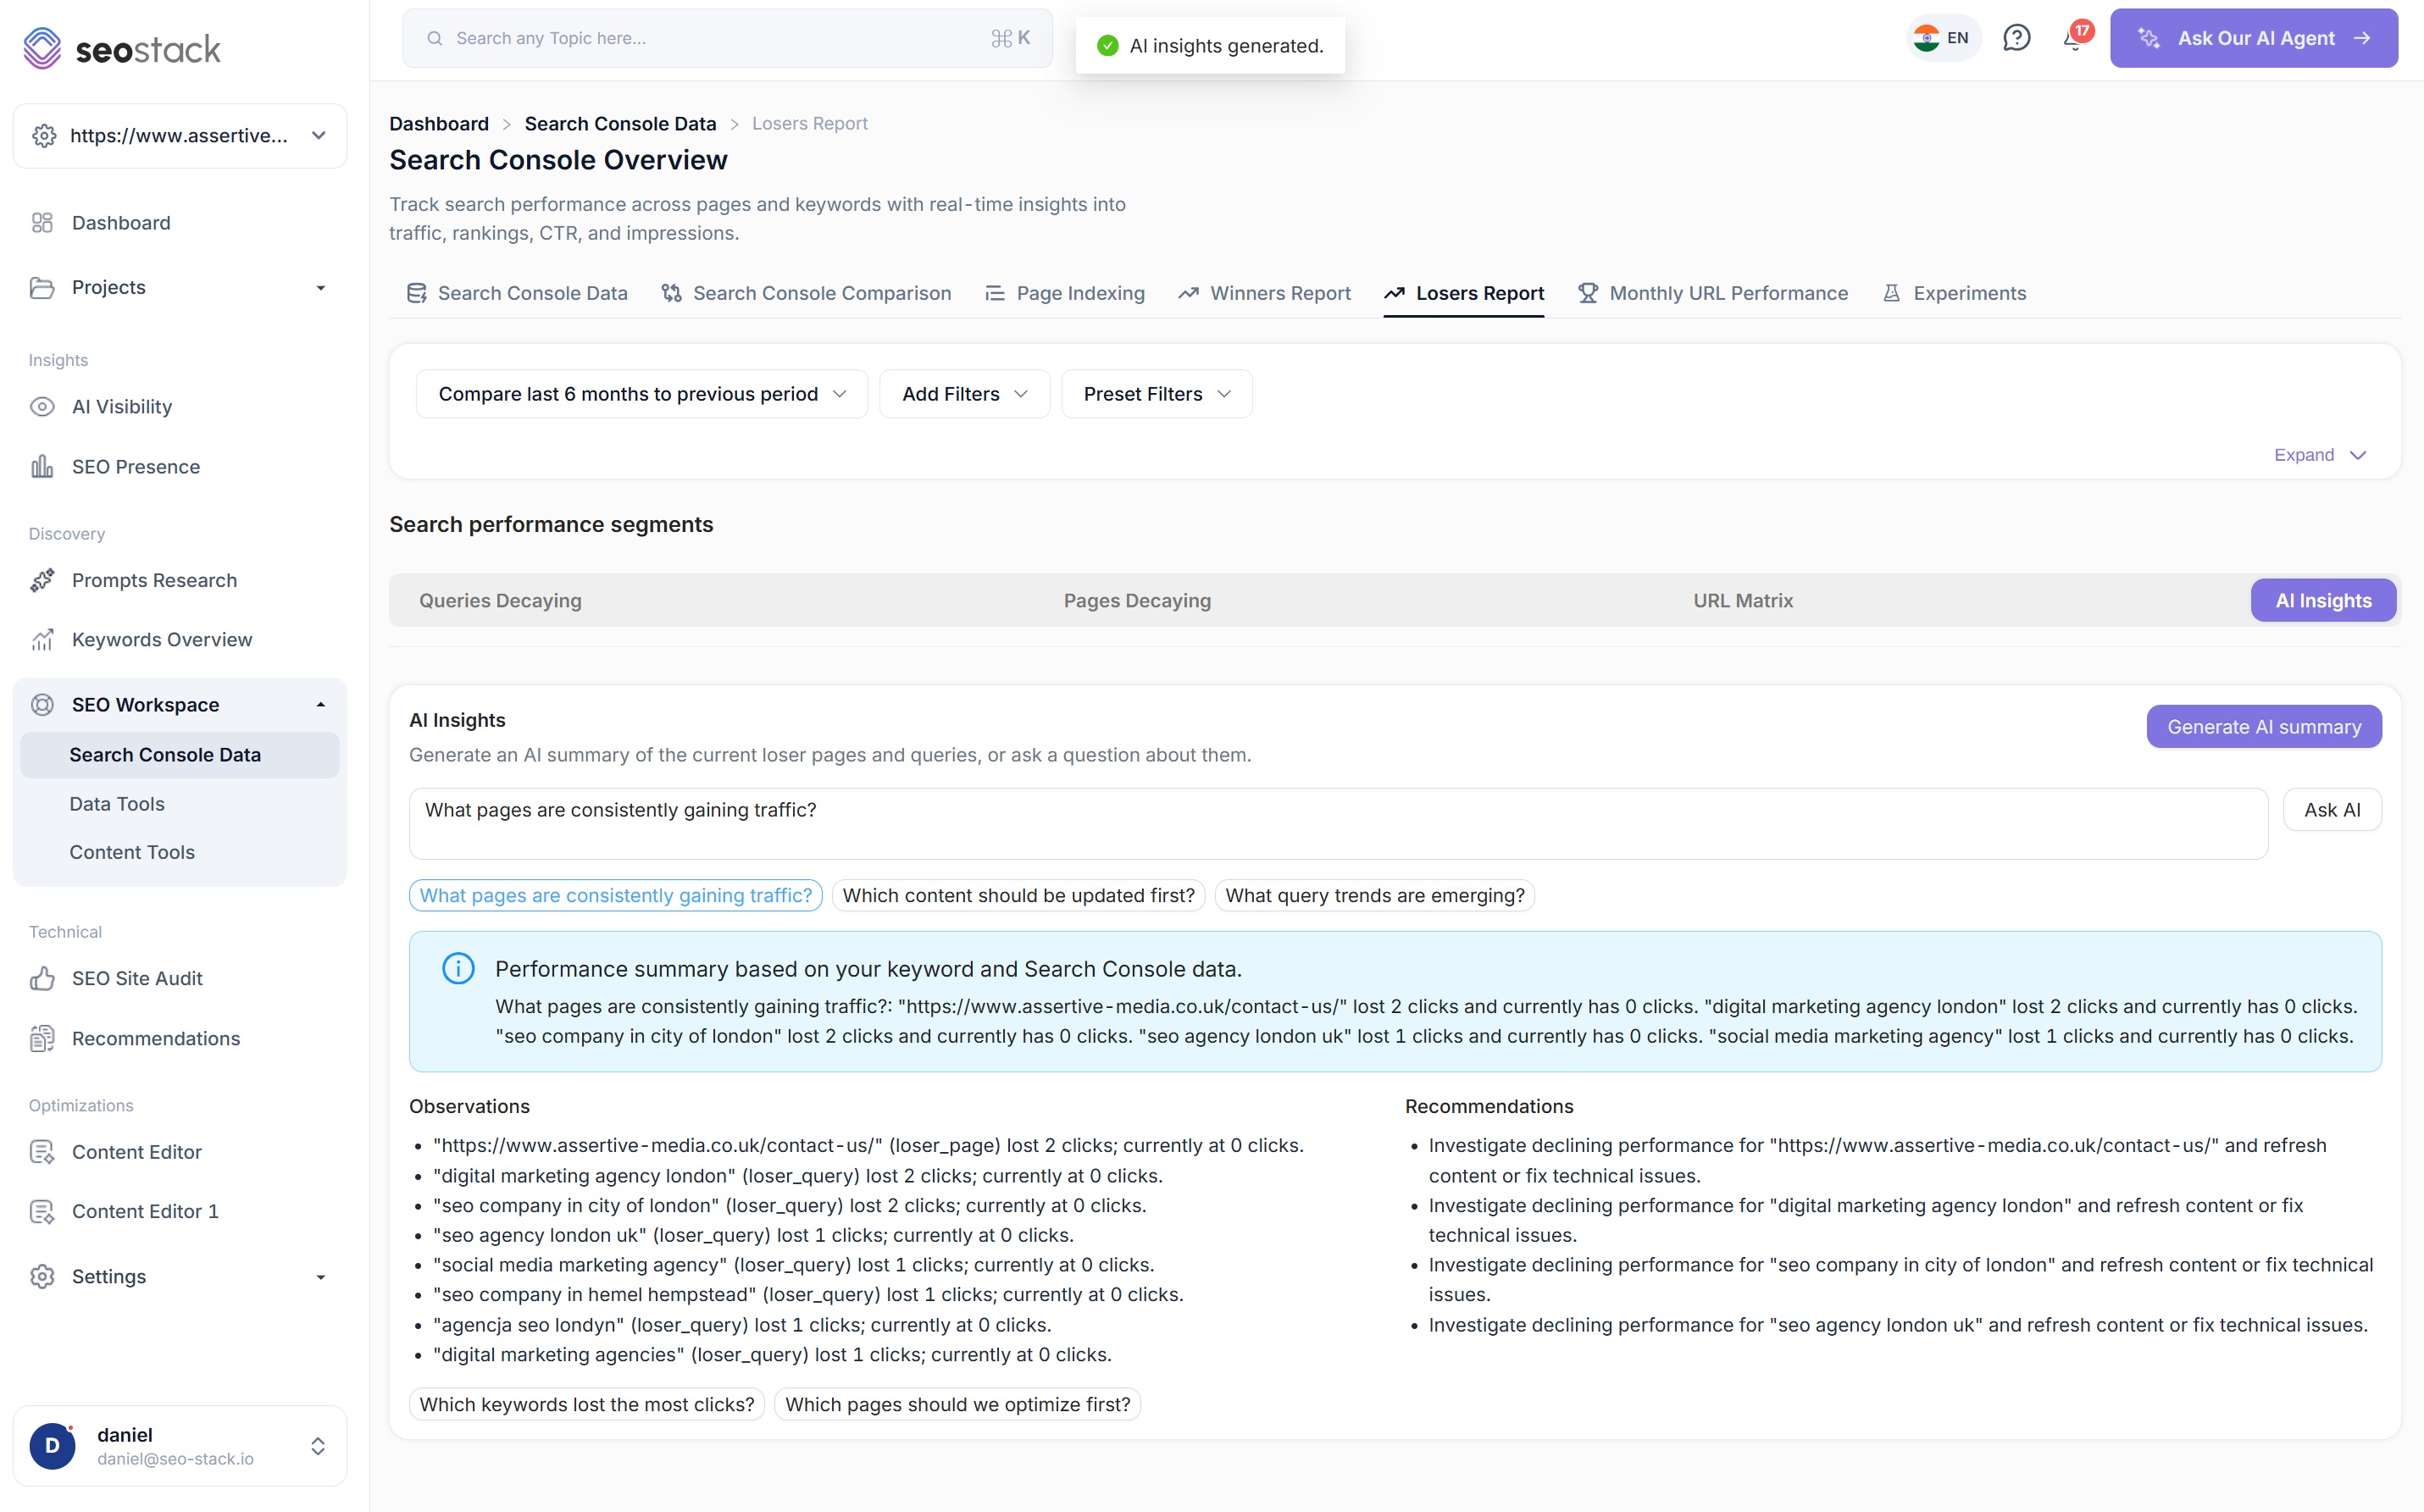
The queries and pages that grew, and the ones quietly dying
Two purpose-built reports that answer the first question in every SEO meeting: what's working, and what's slipping? Segmented by query and by page, with a month-by-month click trend on every row.
- 100% data privacy
- 99.99% uptime
- Nothing to configure
- Export anytime, no limits
The problem
Search Console gives you no winners or losers data whatsoever. There is no holistic view of where clicks are being gained or lost across your pages and queries, so working out what actually moved means exporting two date ranges, reconciling them by hand, and hoping you did not fat finger a formula.
Winners & Losers, in three moves
SEO Stack vs Search Console
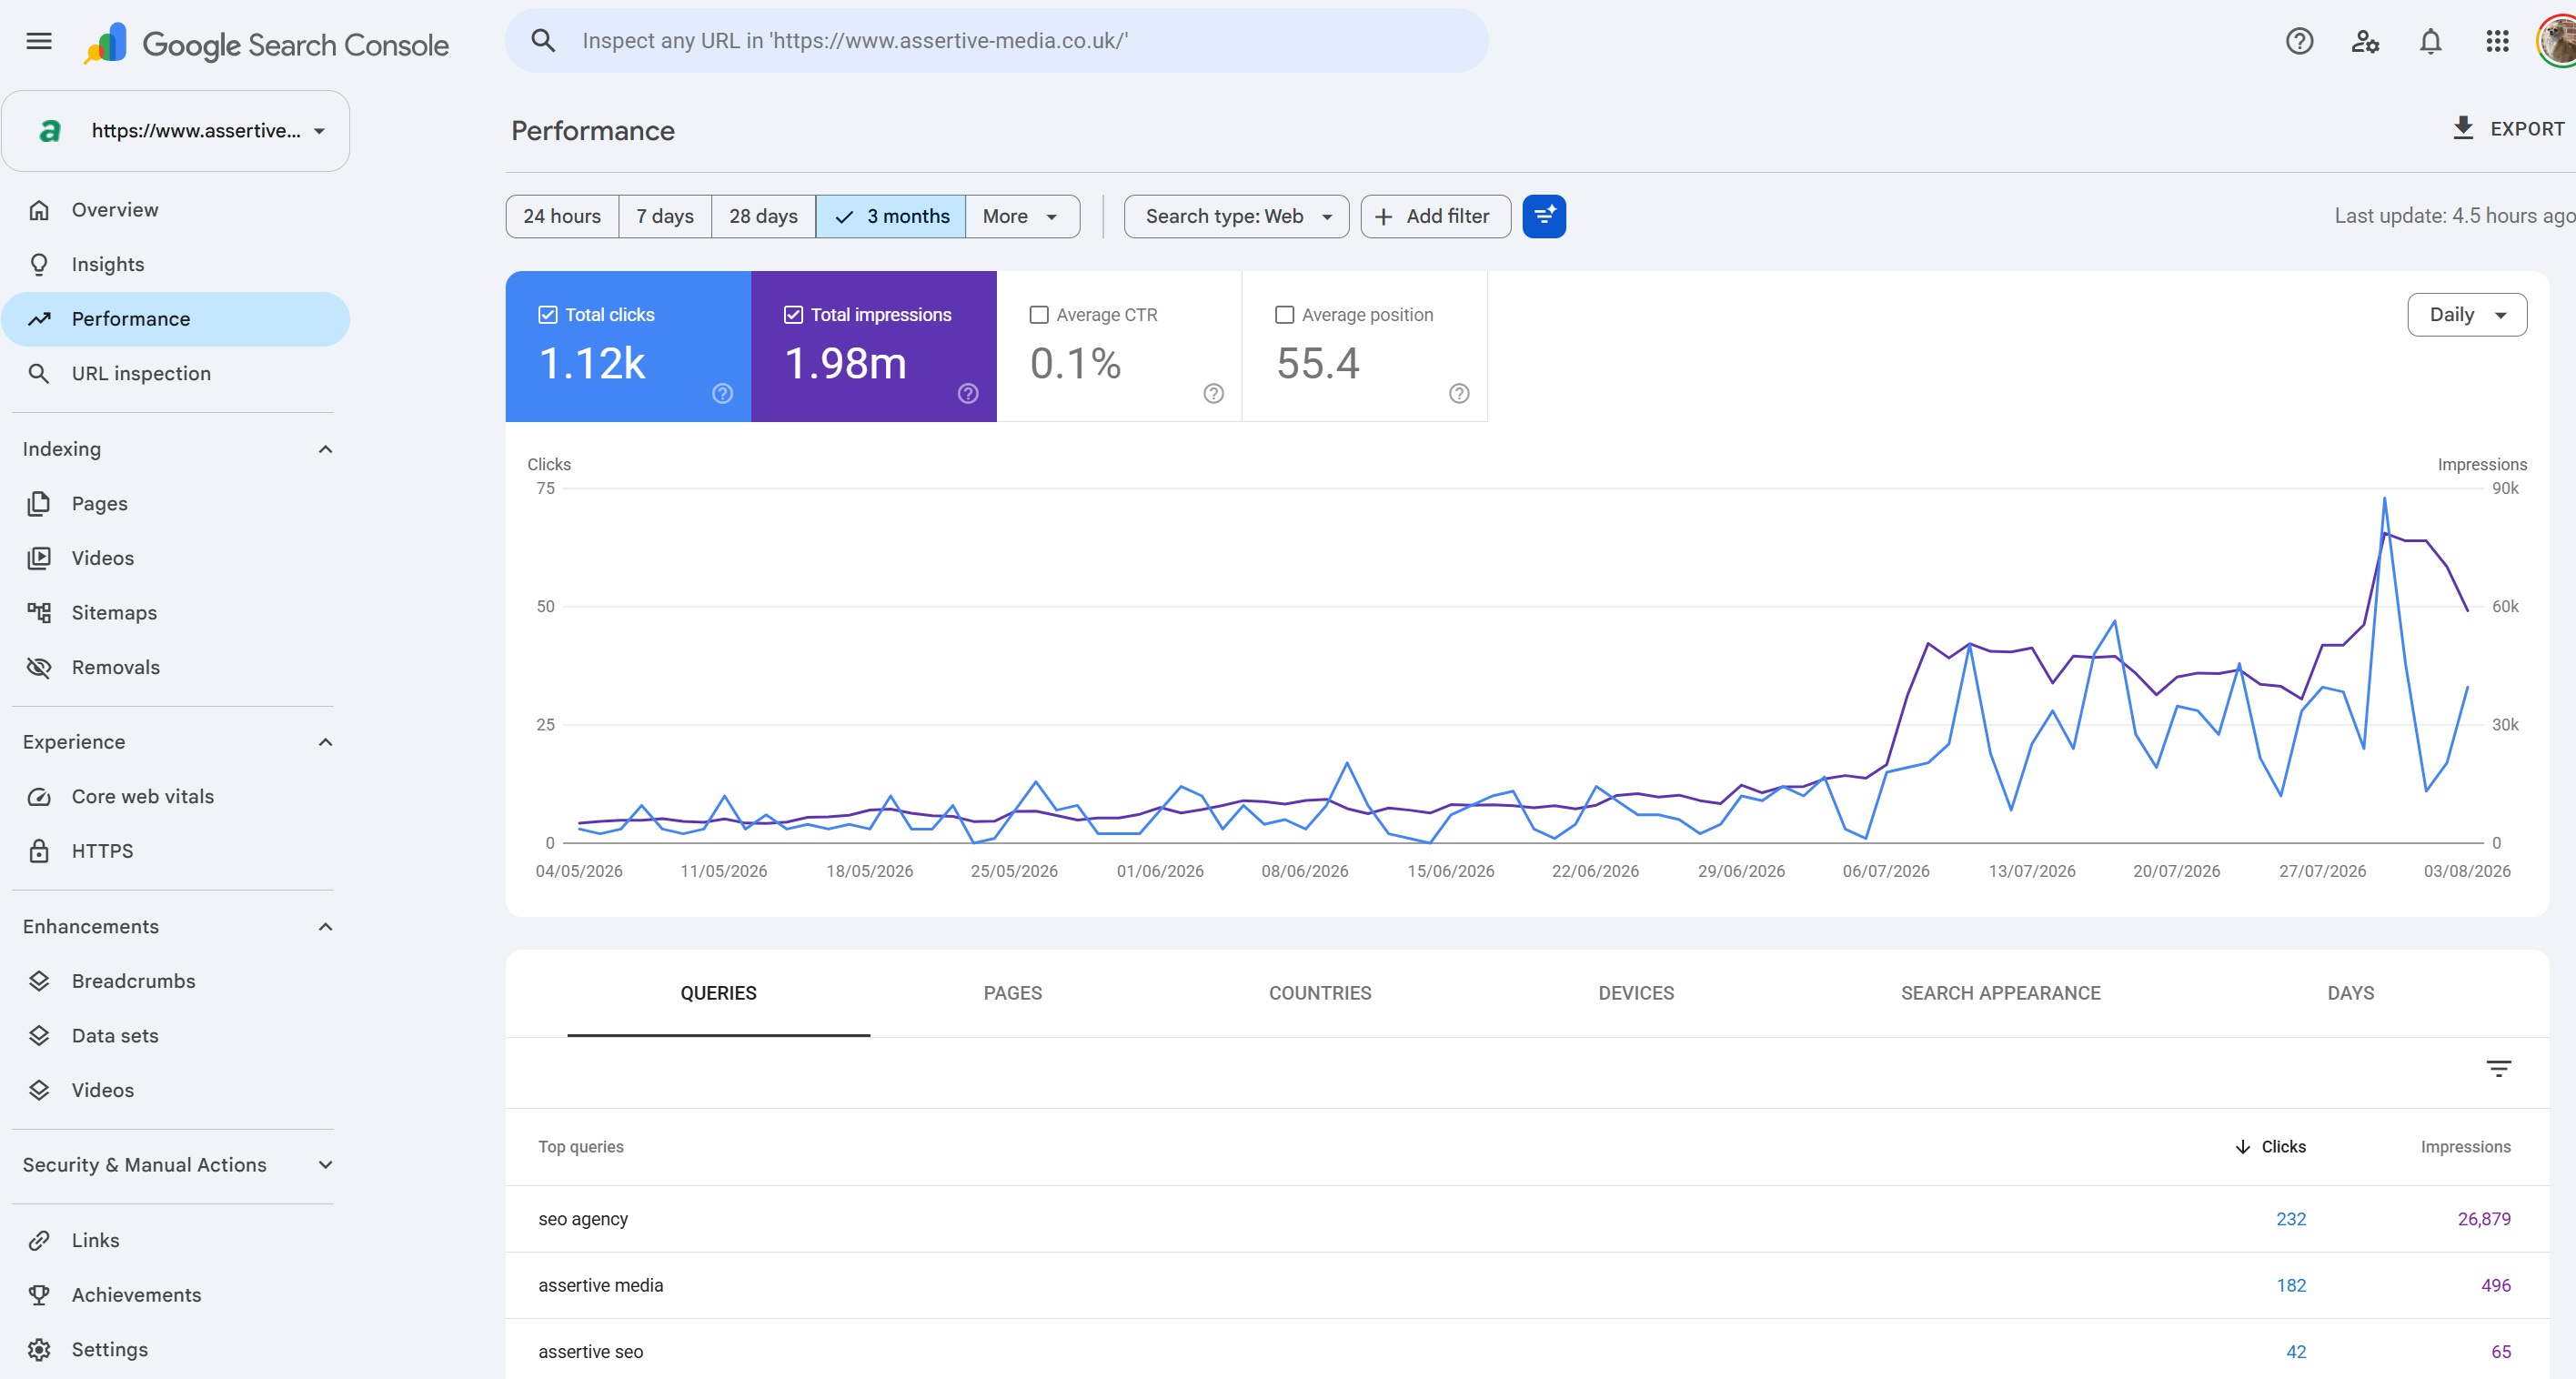
Search Console has no winners or losers report at all
This is not a case of a limit being set too low. The view simply does not exist, so every SEO ends up rebuilding it by hand from two exports.
| Capability |  Search Console Search Console | SEO Stack |
|---|---|---|
| A winners or losers view | Does not exist. There is no report that segments queries or pages by direction, so the only route is exporting two date ranges and reconciling them yourself. | Purpose built Winners and Losers reports for both queries and pages, so what grew and what fell is on screen before you have opened a spreadsheet. |
| Seeing loss holistically | No aggregate view of decline. A page quietly dying shows up only if you already knew to look for it. | Decay is surfaced across the whole property at once, ranked, so pages losing ground find you rather than the other way round. |
| Month by month movement | Comparison gives you two totals and nothing about the shape of the change between them. | A month by month click column on every row, plus a sparkline, so a steady slide reads differently from a single bad month. |
| URL level trends | No matrix view. Per URL trajectory has to be assembled by hand. | A URL matrix showing how each URL has trended over time, so you can see which templates and folders compound and which stall. |
| Explaining the cause | Nothing. The data is the end of the road. | AI Insights reads the movement and tells you where growth or decay is coming from and the likely reasons, and you can ask it follow up questions. |
| Filtering and export | One filter per dimension, capped at 1,000 rows in the view and the export. | Layered filters, saved filter libraries, custom comparison periods, and full exports with no row cap. |
Six views, one question
What grew, what fell, and why
Queries and pages, growth and decay, plus a URL matrix and an AI layer that explains the movement rather than just reporting it.
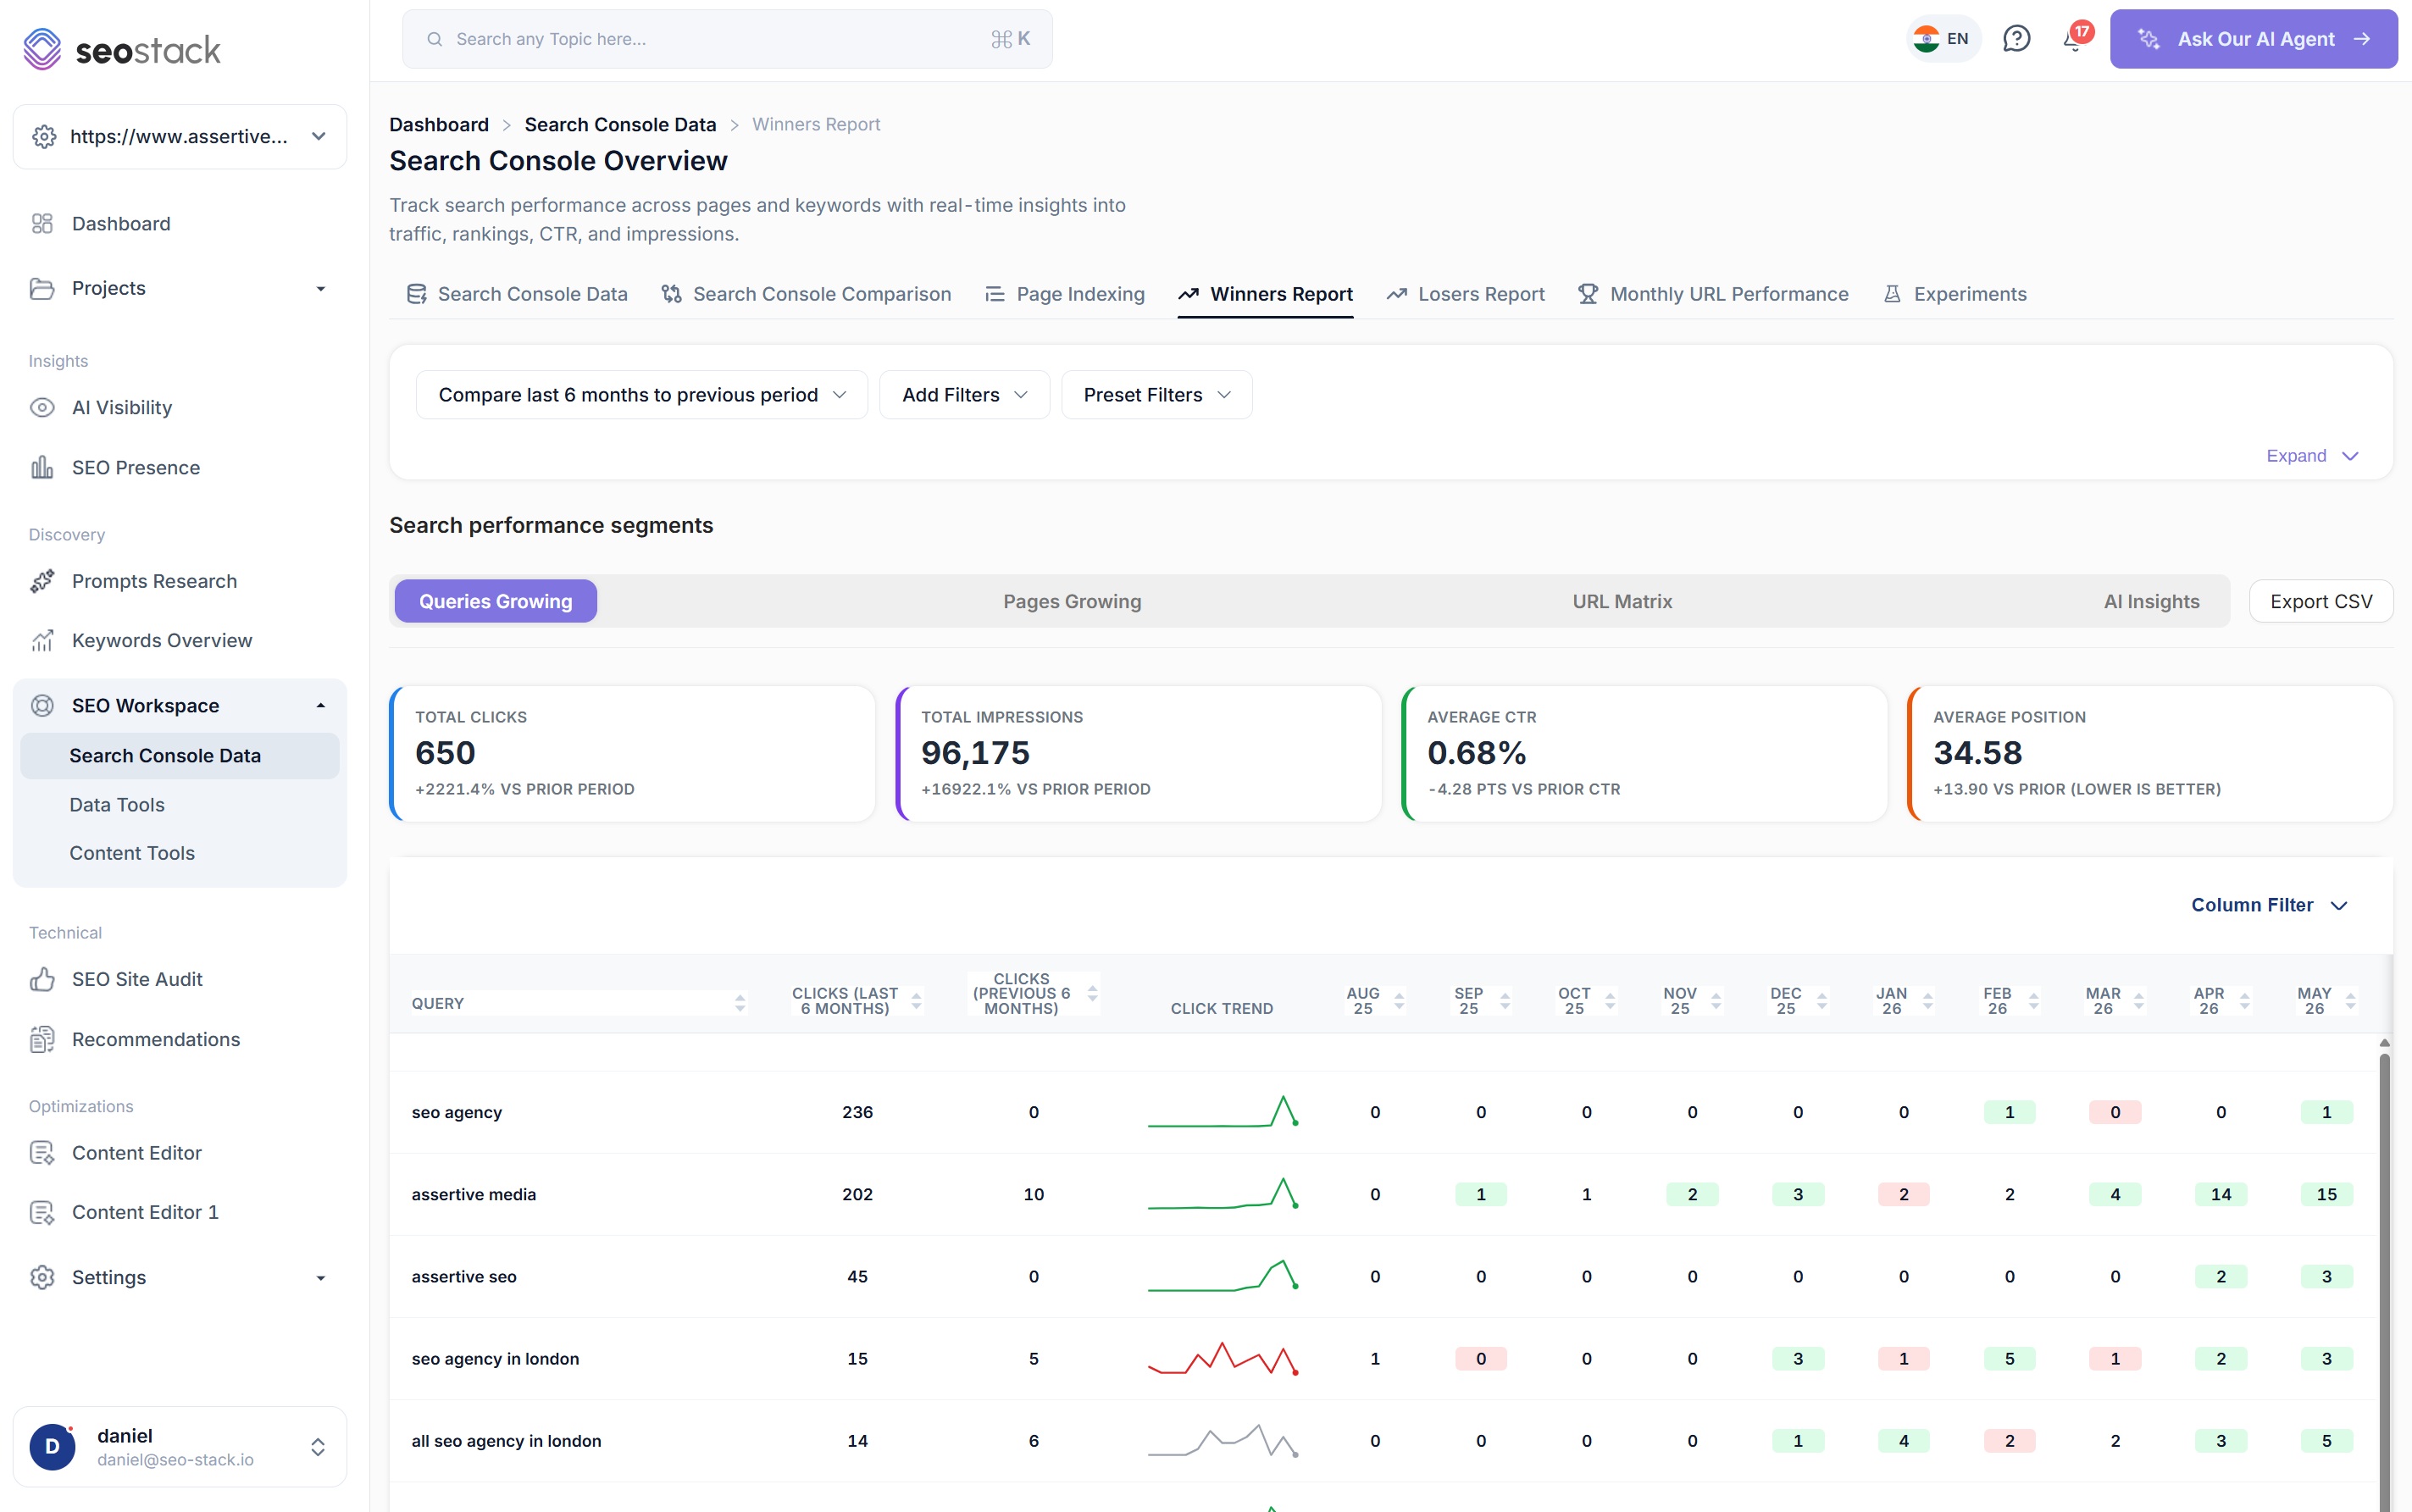
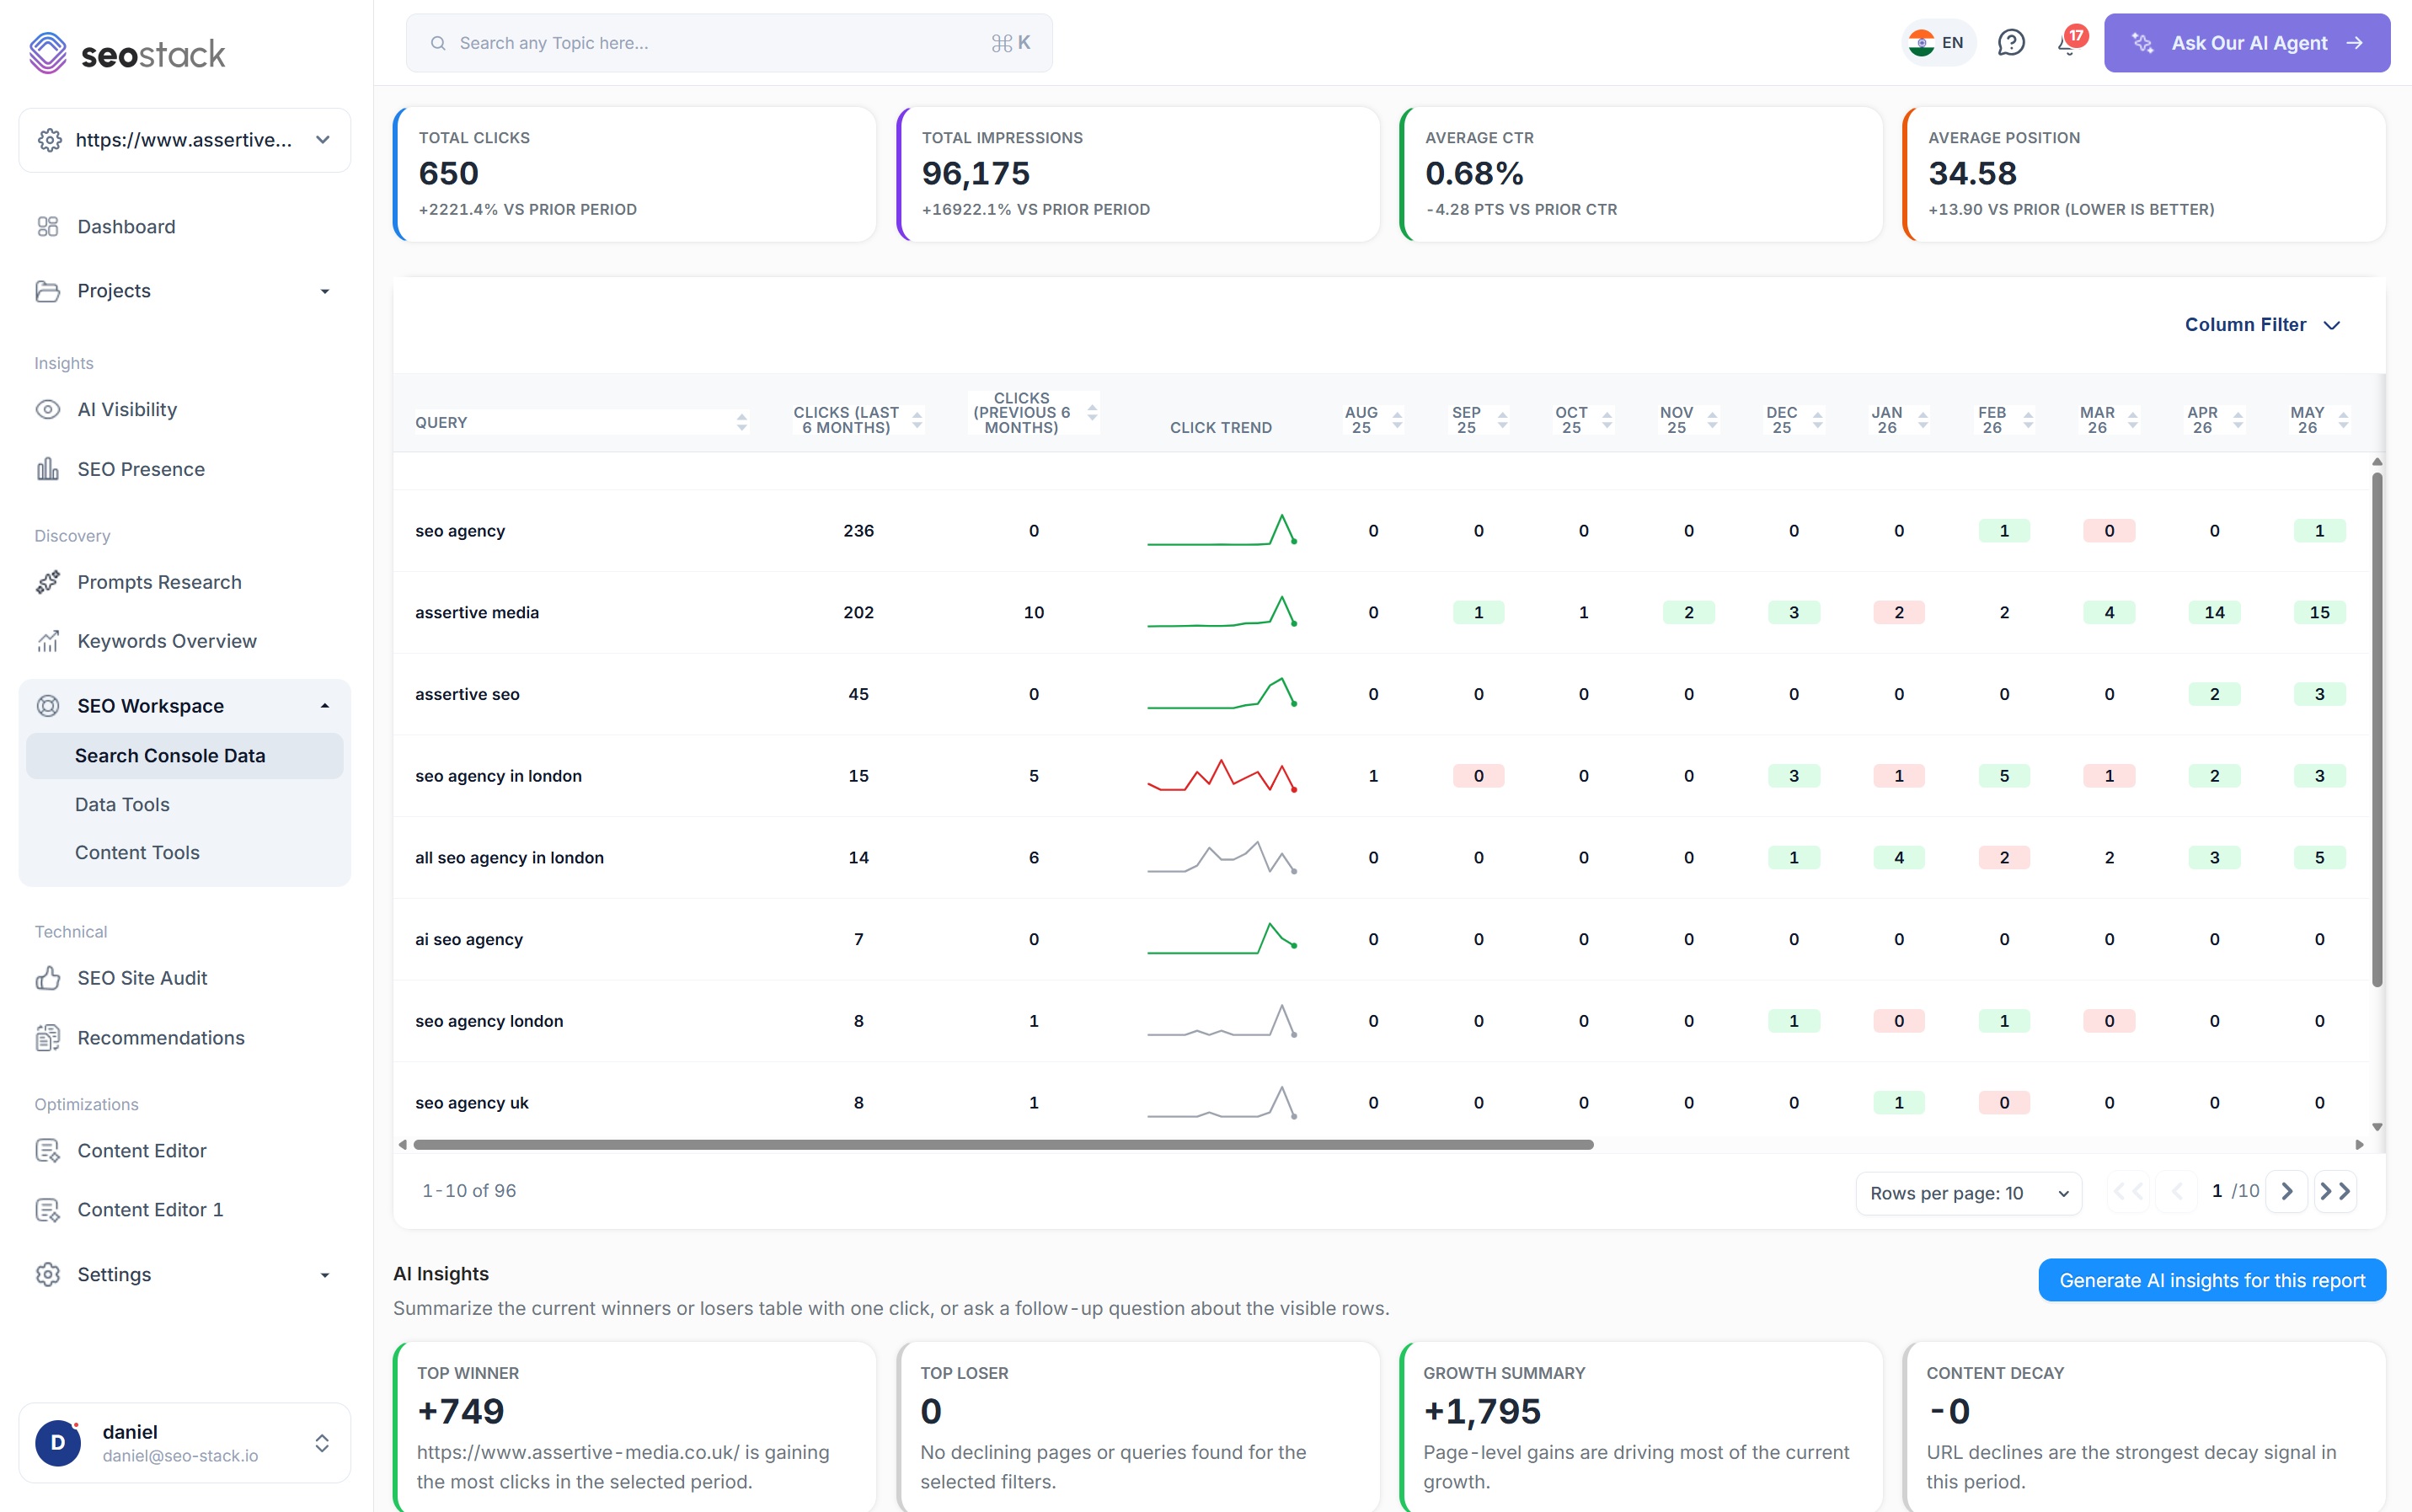
Every query gaining ground, ranked
- Clicks this period against the previous period, with the difference on every row
- Month by month click columns so you can see the shape of the growth
- A sparkline per query, so a spike reads differently from a steady climb
- Sort by any column to find the biggest movers, or the newest
Open the meeting with the wins already on screen
No export, no VLOOKUP, no reconciling two date ranges by hand before the meeting.
The queries quietly slipping away
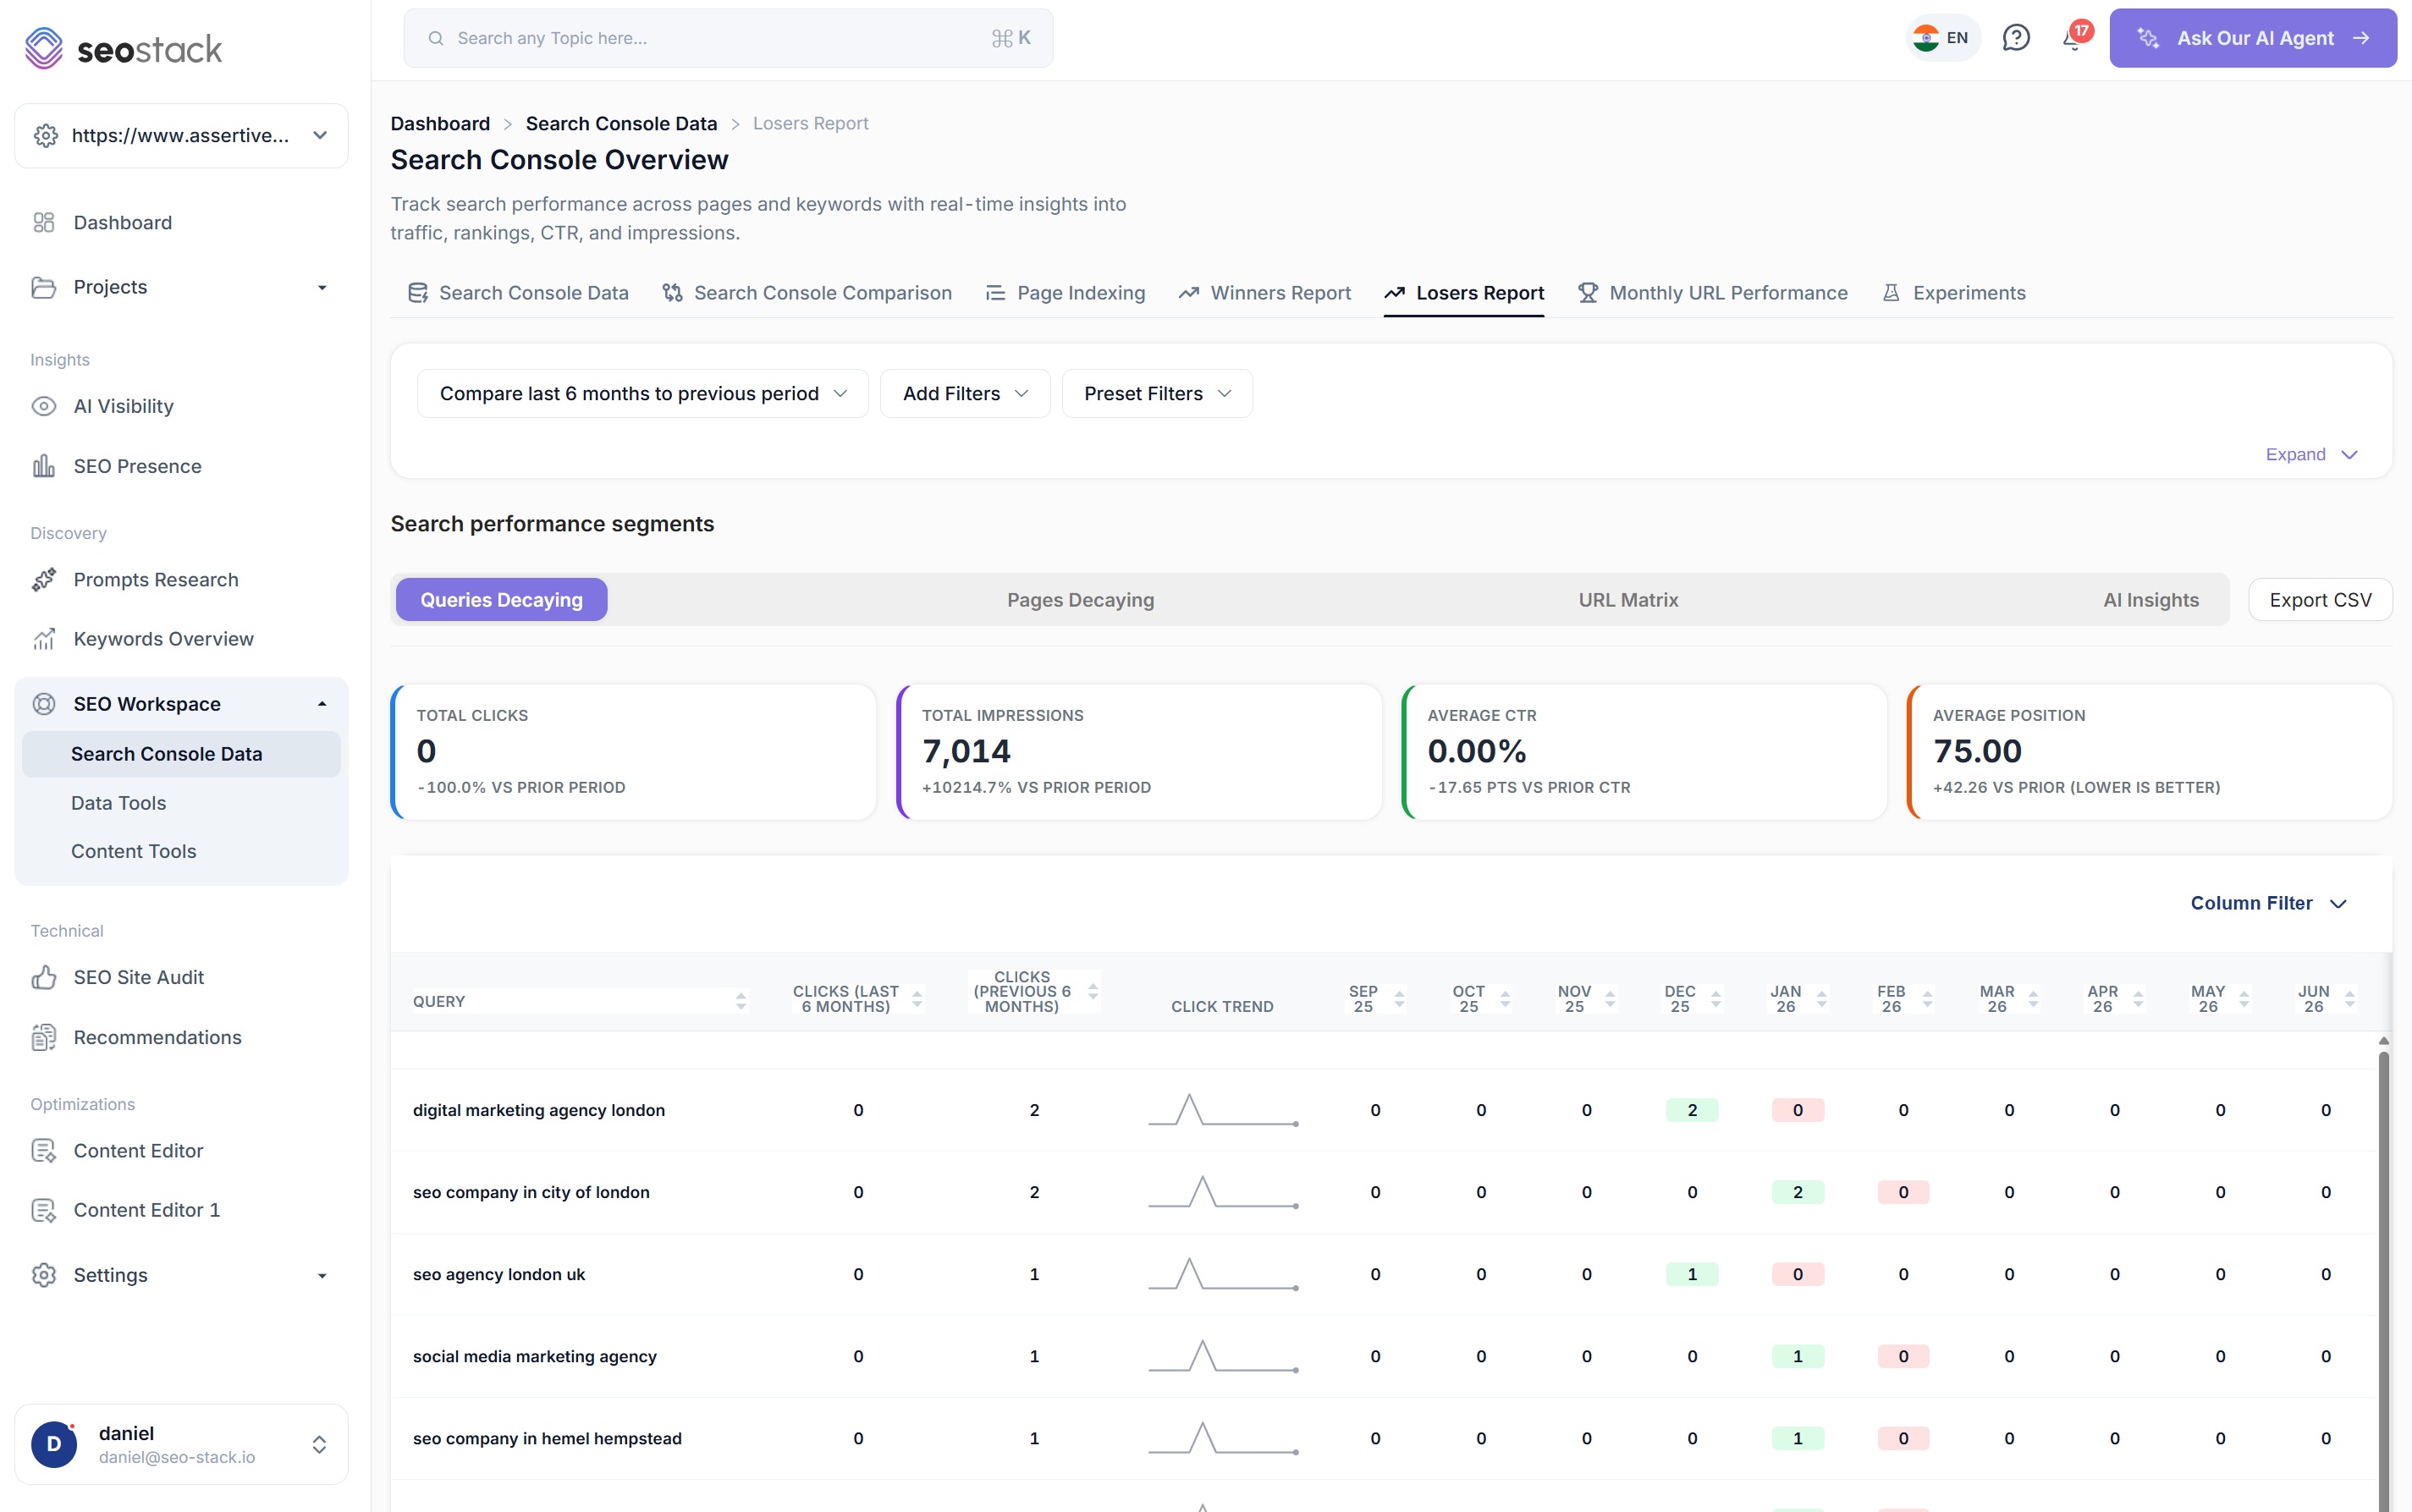
- The same view inverted, ranked by loss rather than gain
- Catch decay while it is still a small number rather than a quarterly problem
- Separate a single bad month from a sustained slide using the monthly columns
- Export the list straight into a remediation plan
Which pages are actually compounding
- Page level growth across the whole property, not just the queries
- Spot which templates and folders reward further investment
- Month by month movement on every URL
- Filter to a sub folder to assess a single content programme
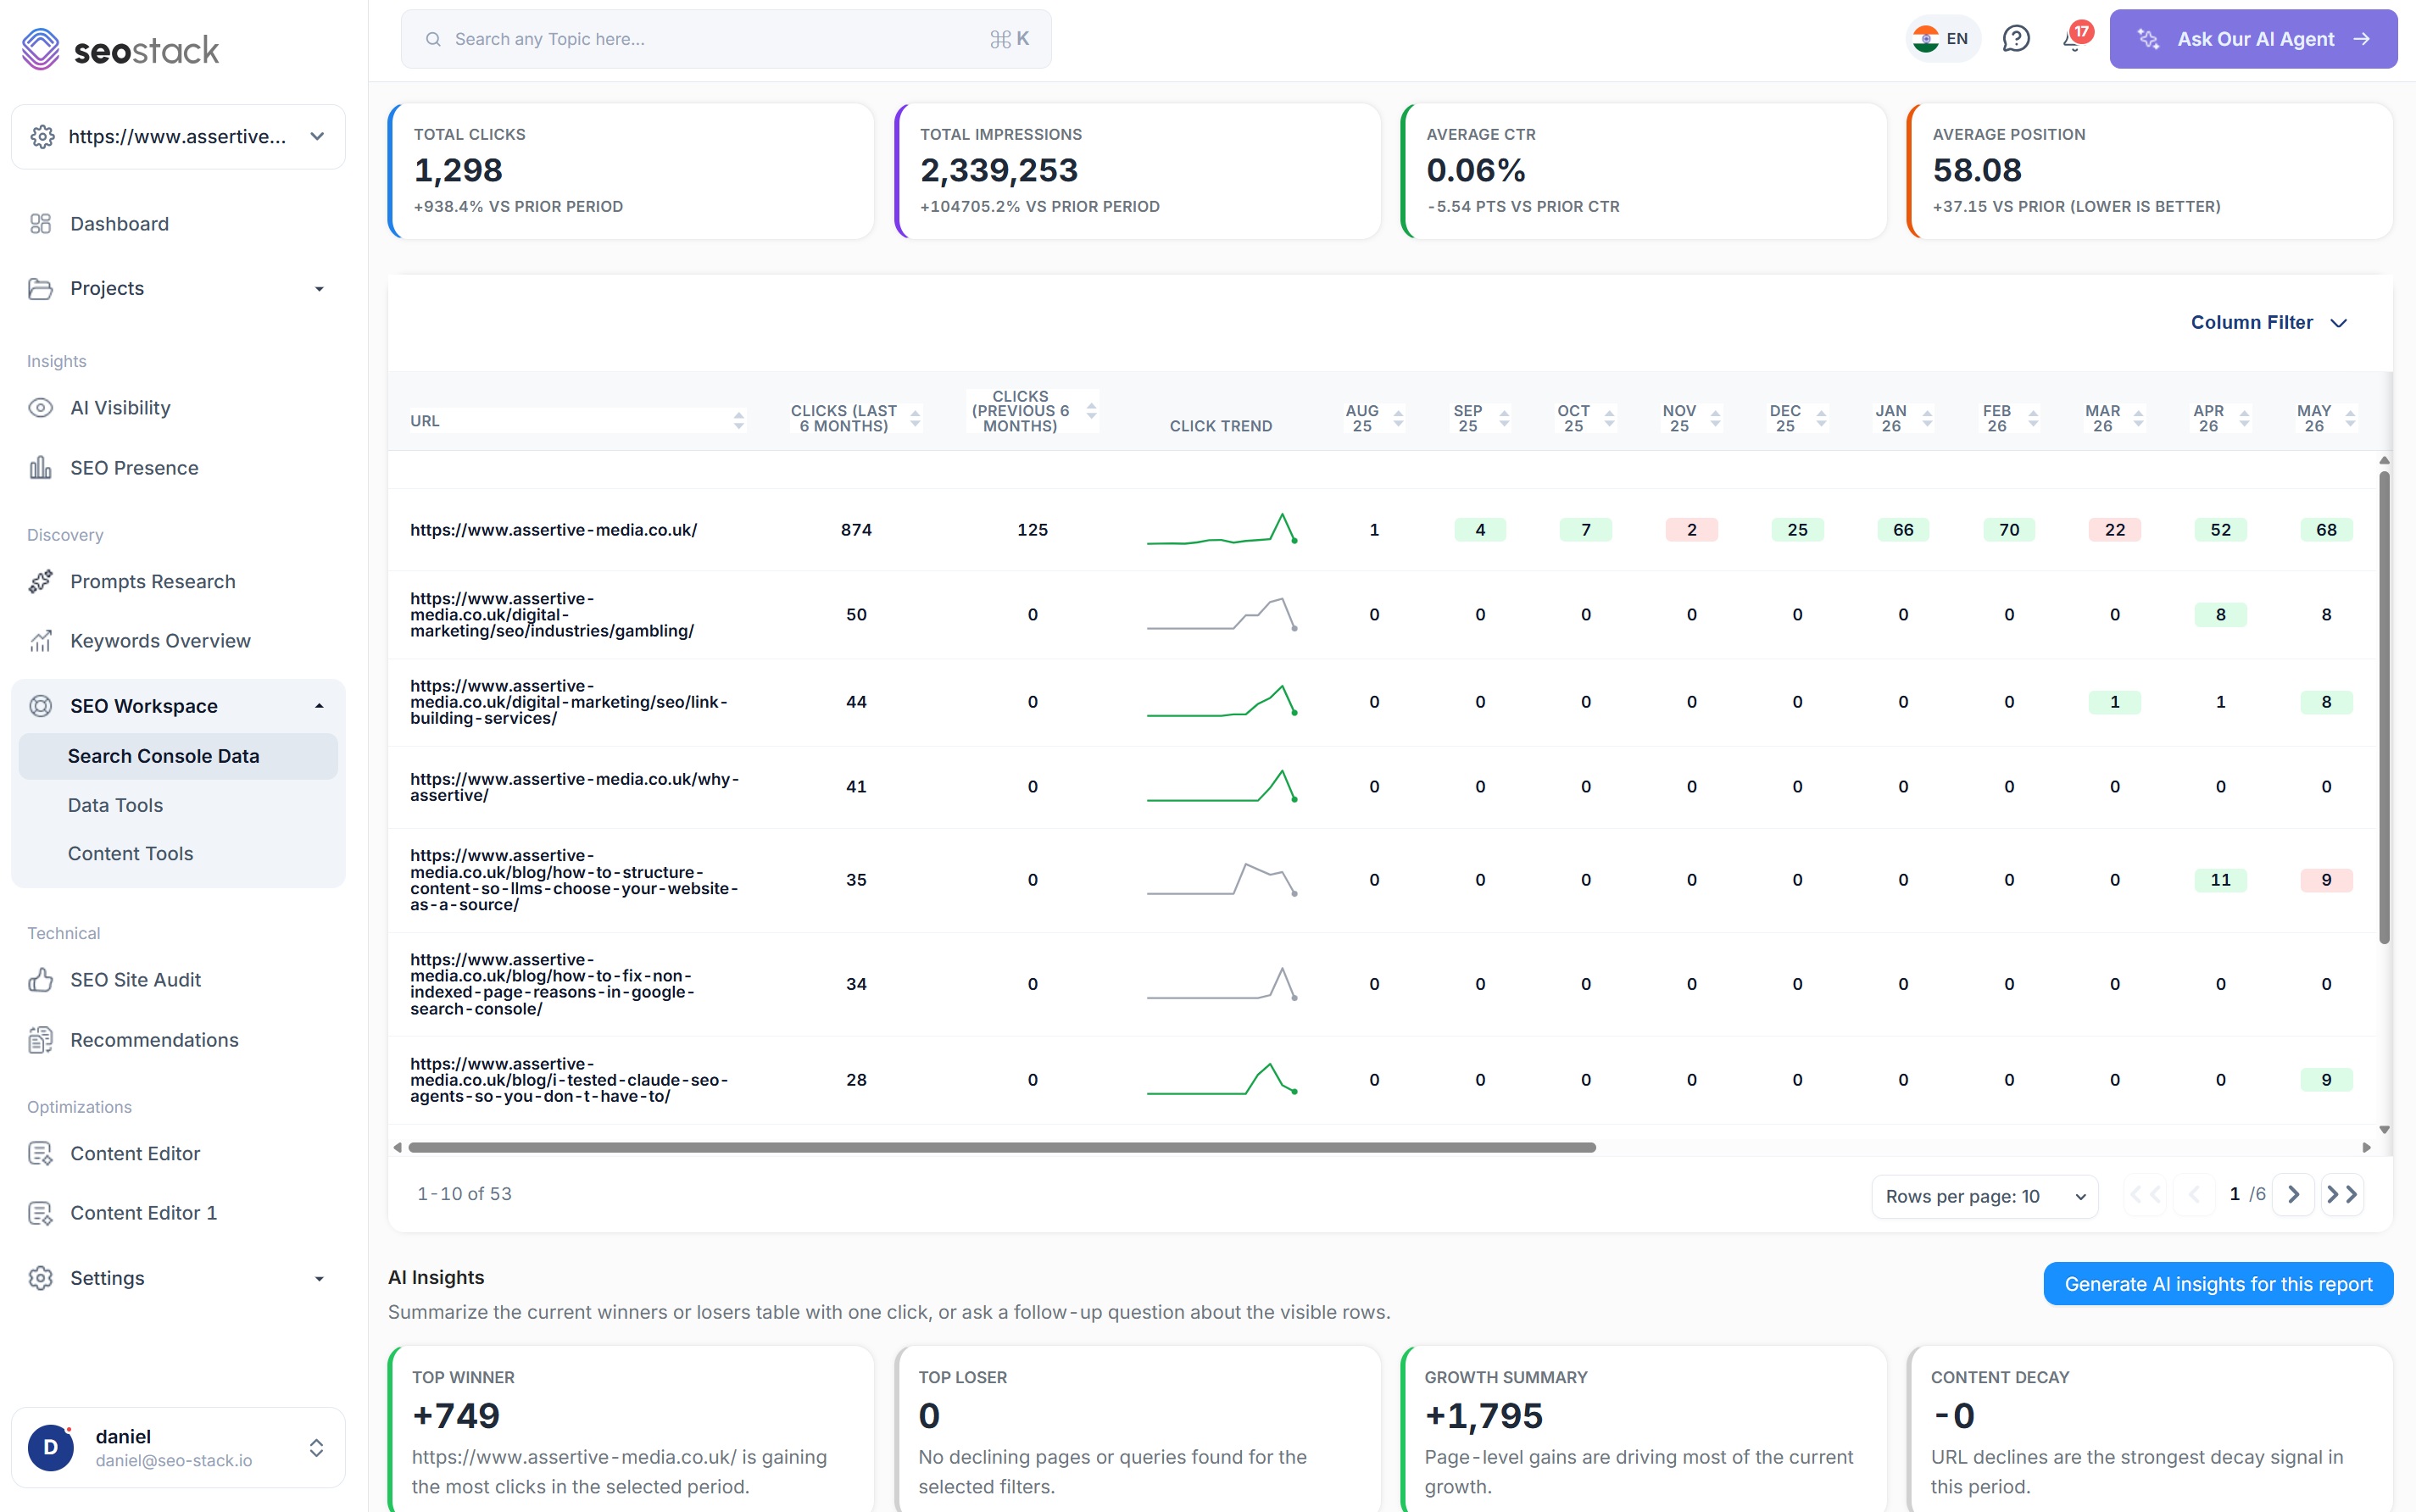
Decay you would otherwise find too late
- Pages losing clicks surfaced across the whole site at once
- Ranked by loss, so the worst offenders are the first thing you see
- Pairs with Weak & Dead URL Discovery for a defensible prune list
- Full export, no row cap
Loss finds you, not the other way round
A page dying slowly is invisible in Search Console unless you already suspected it. Here it is ranked on the first screen.
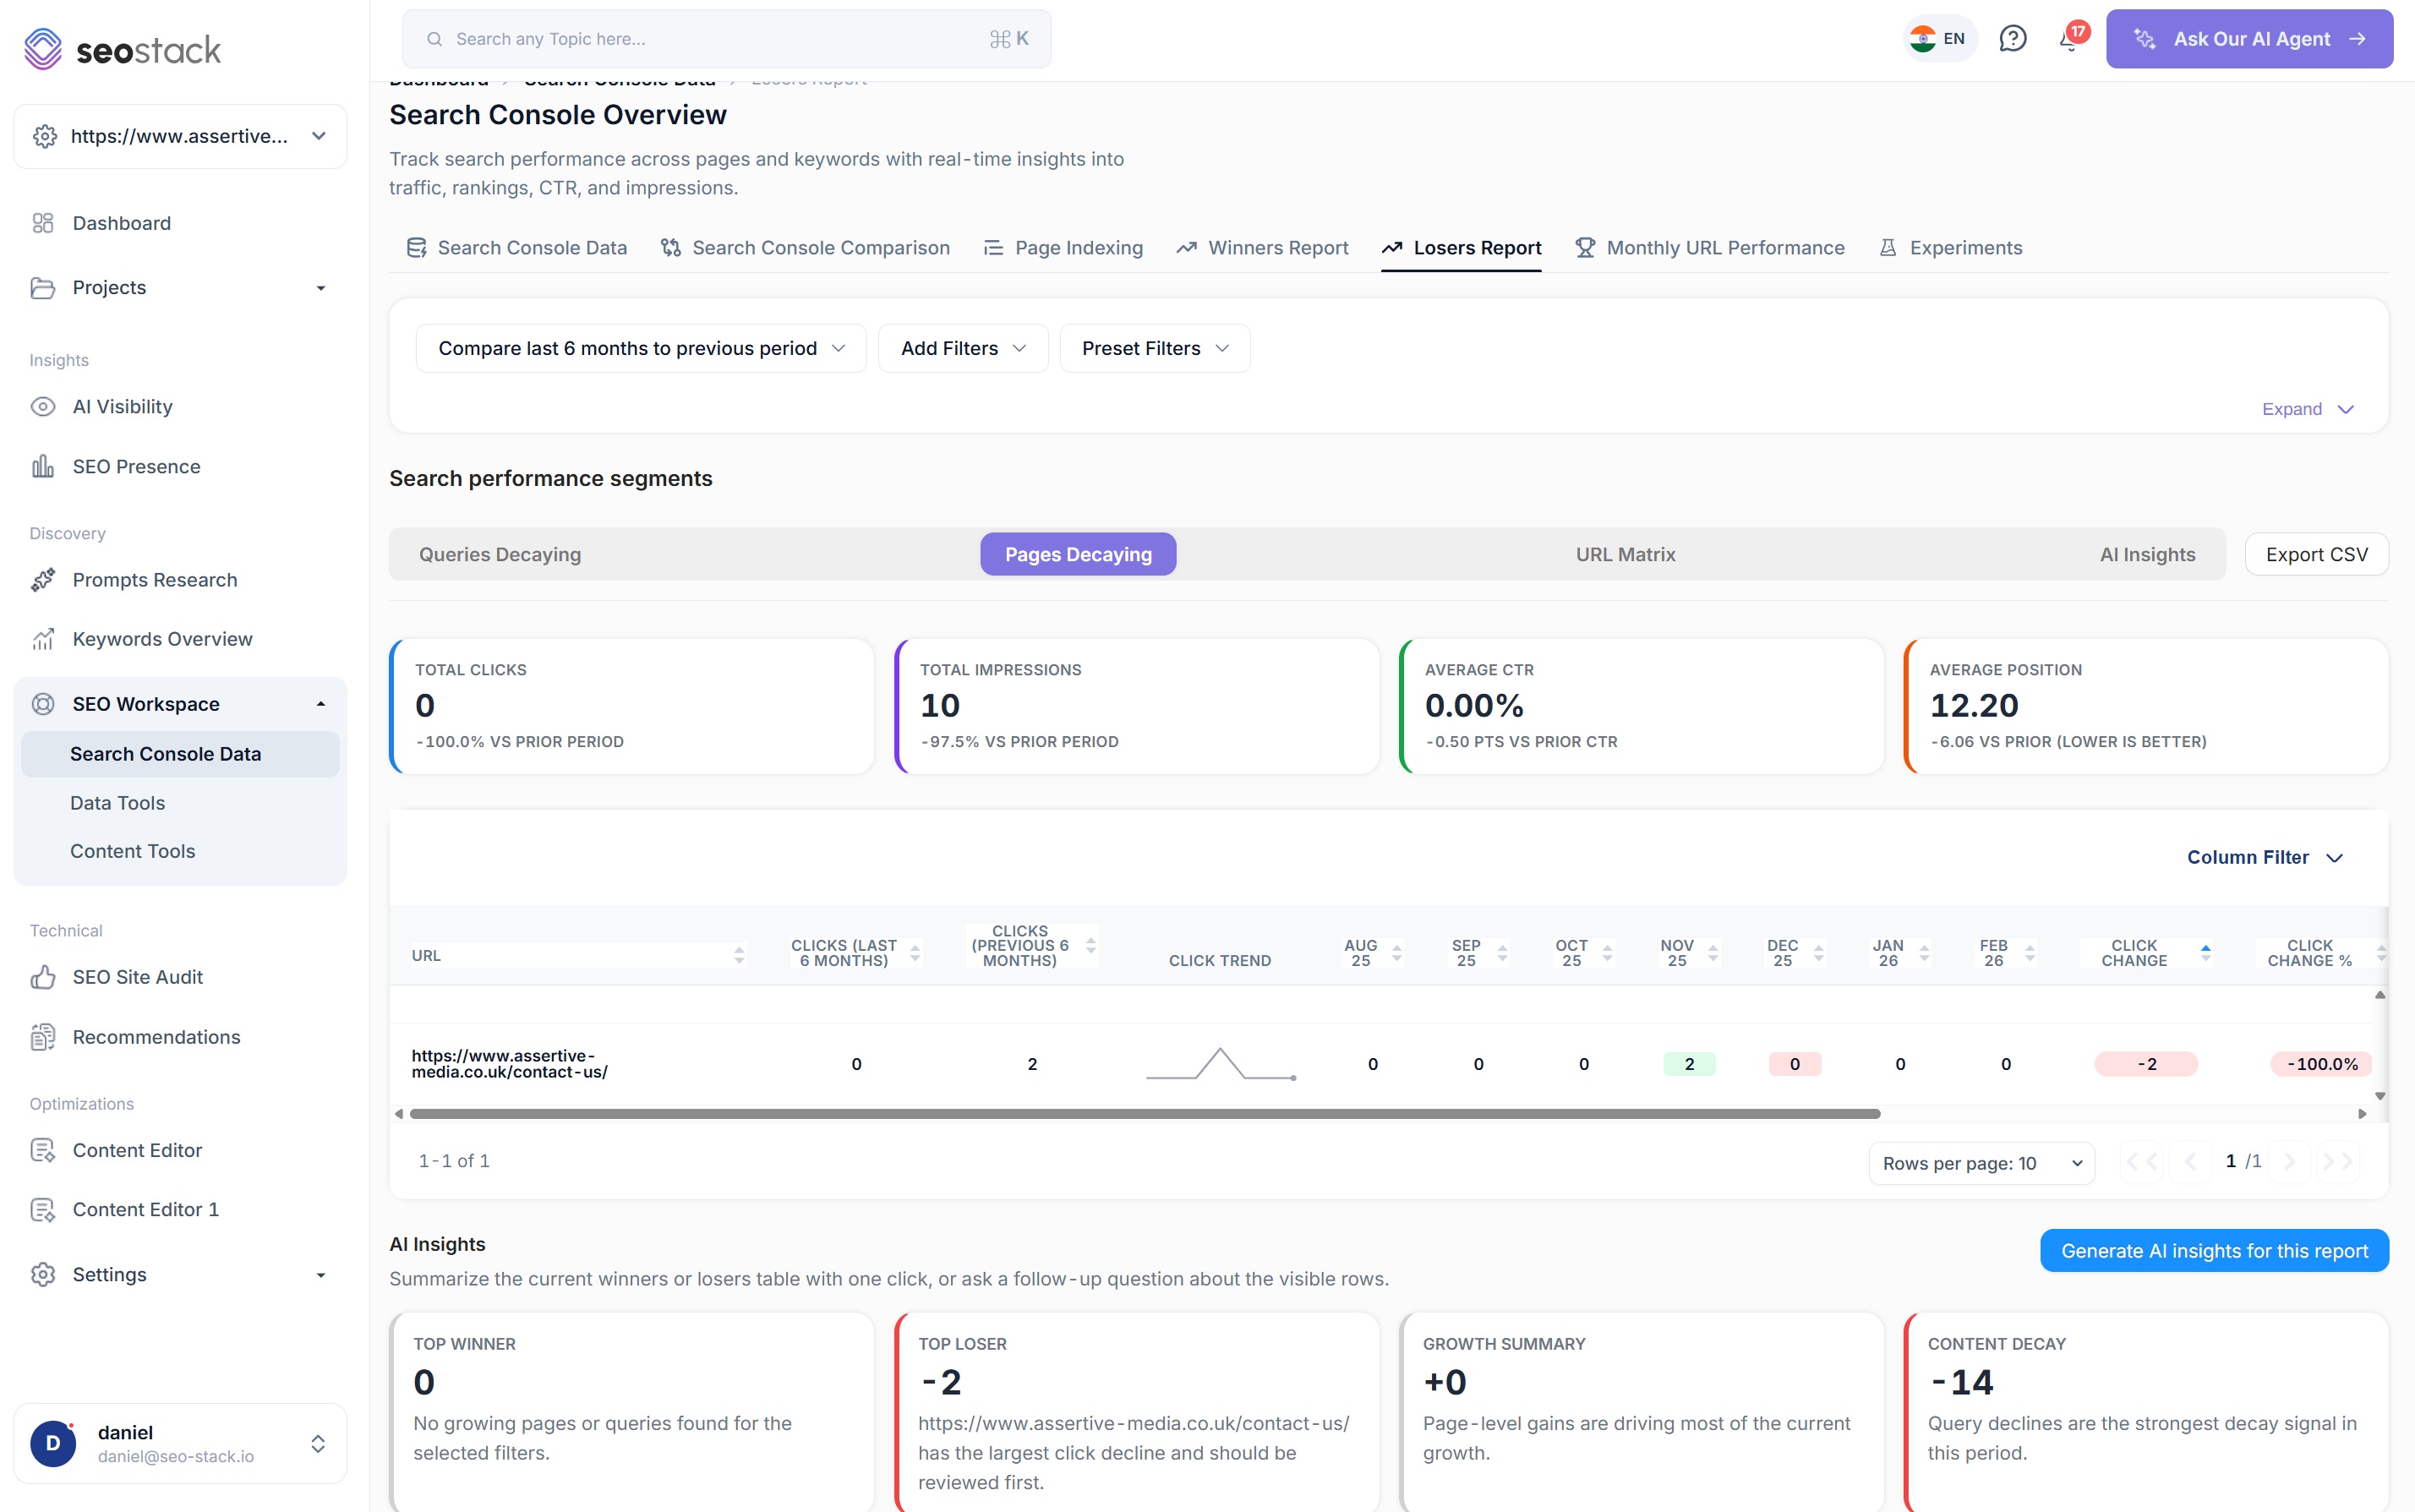
Every URL's trajectory in one grid
- How each URL has trended over time, side by side
- See which content investments compounded and which never took off
- Compare batches, such as everything published in a given quarter
- Sort and filter to isolate a template, folder or campaign
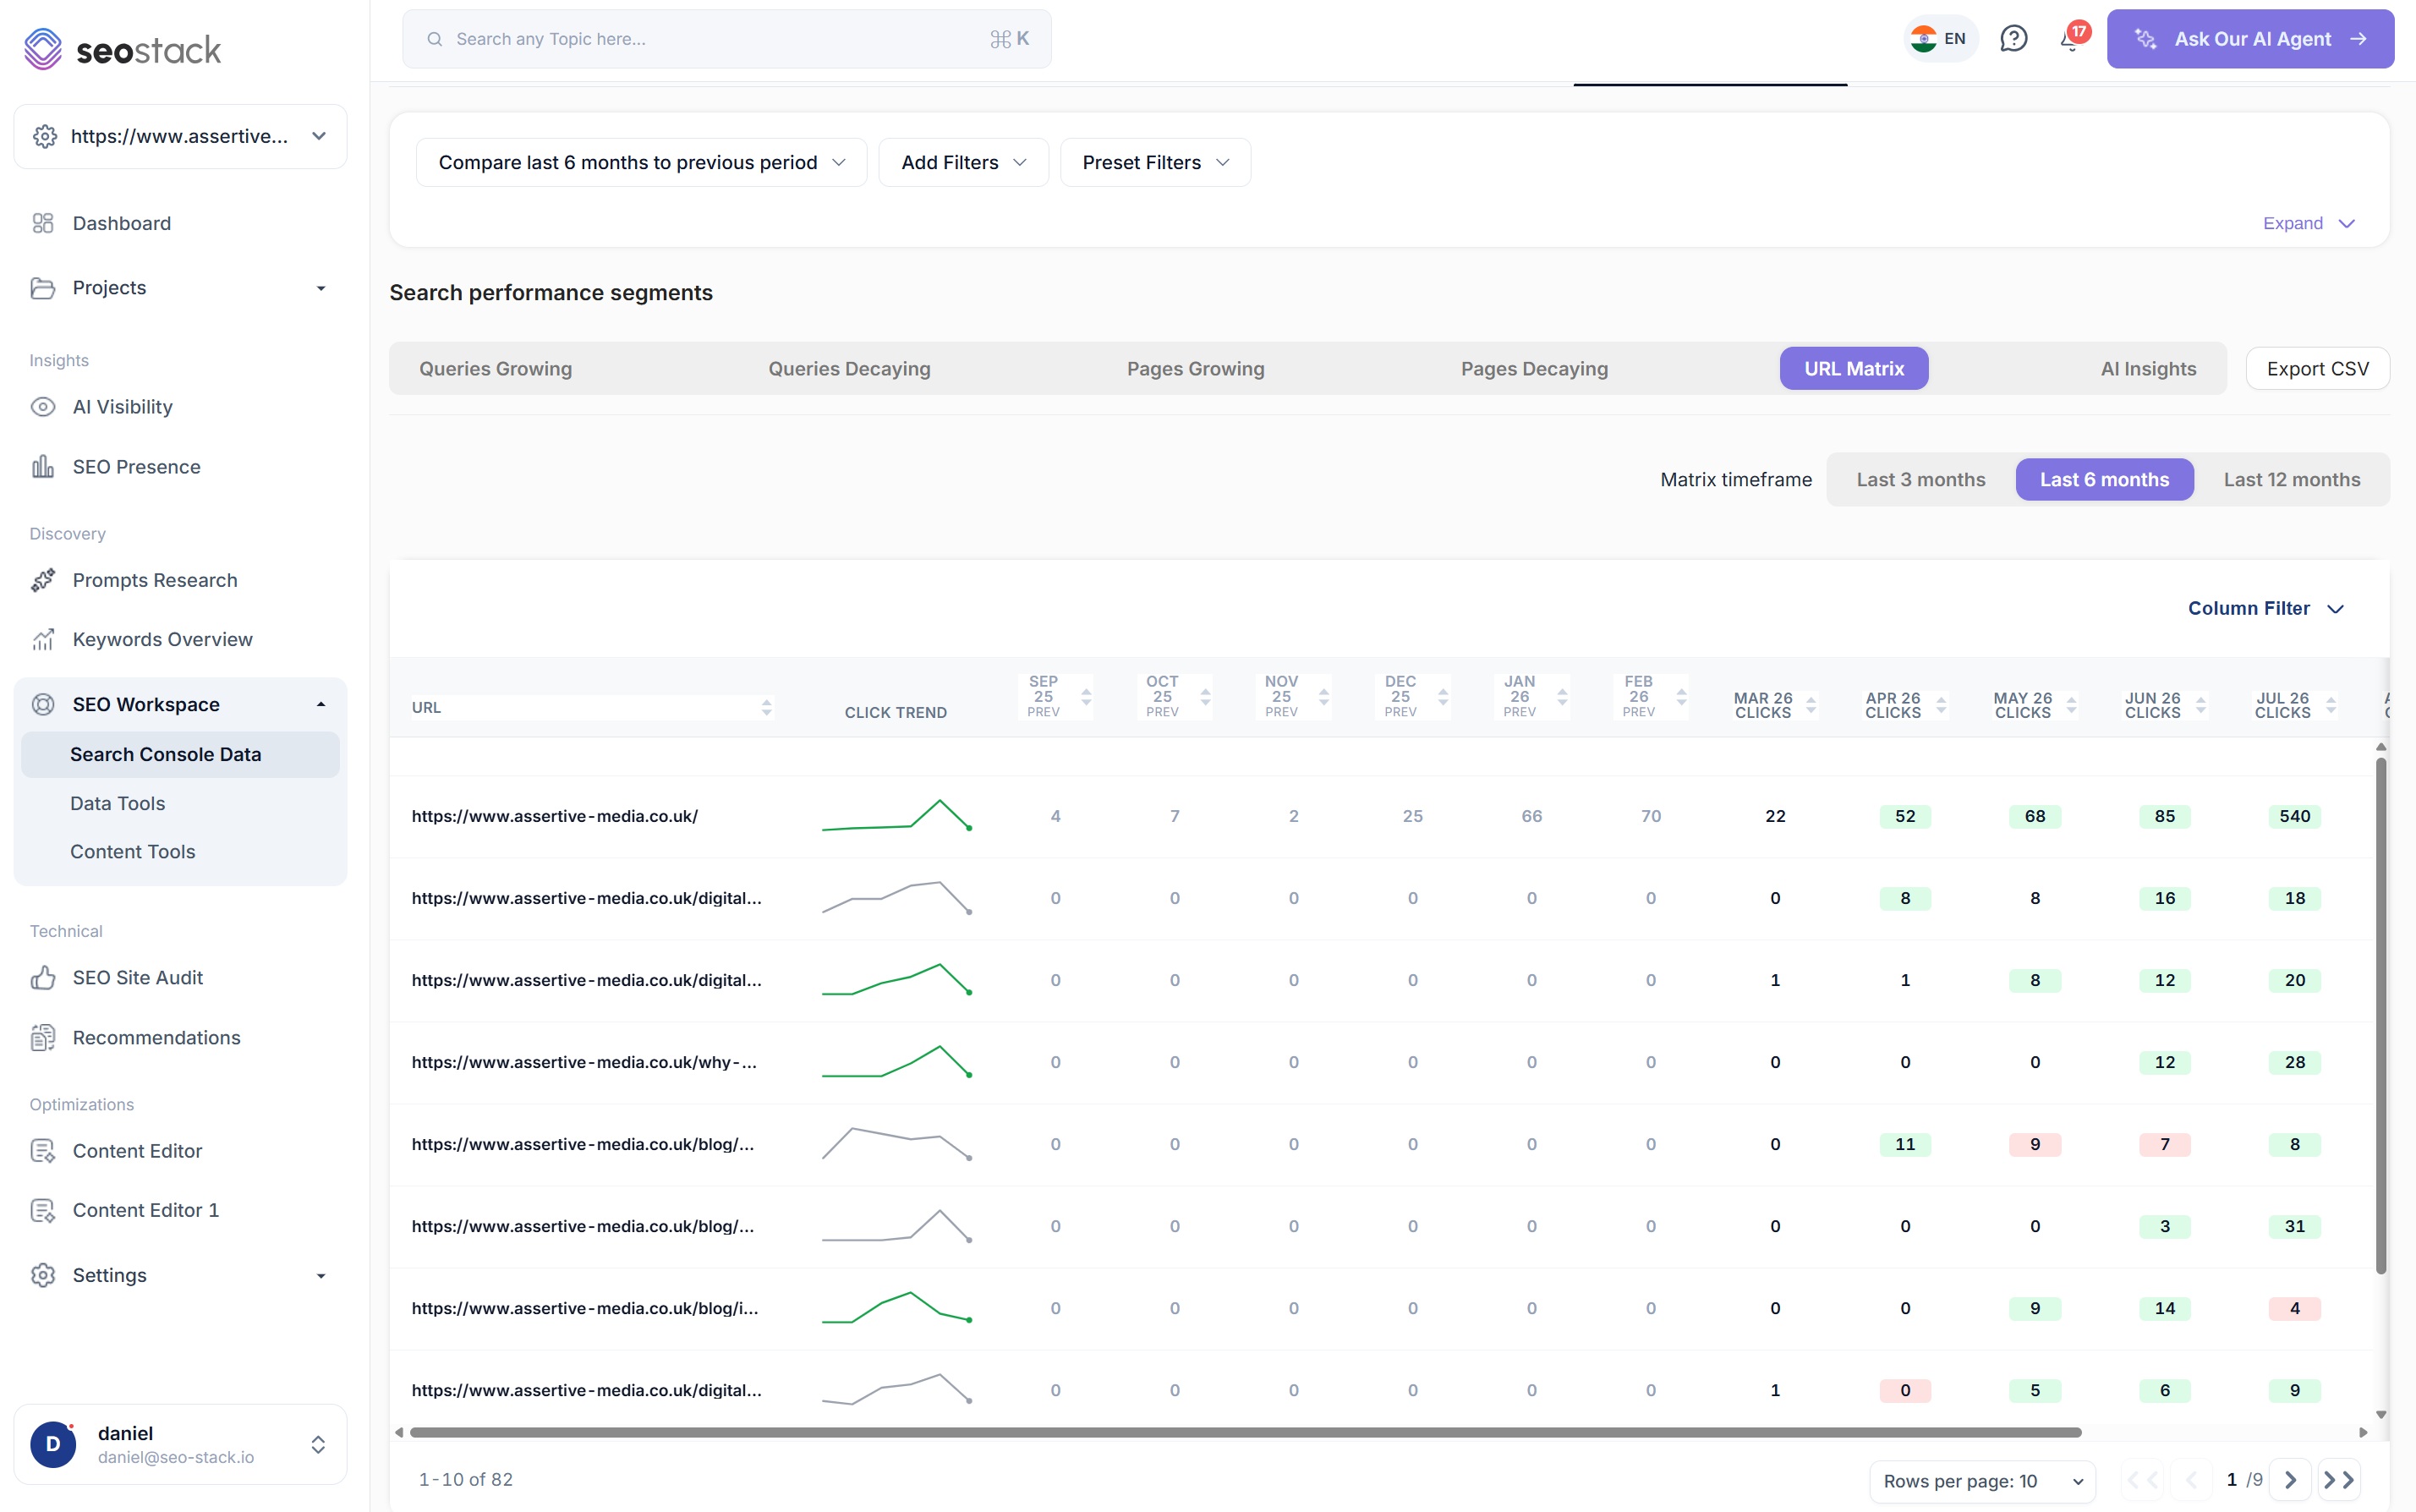
Not just what moved, but why
- AI reads the movement and explains where growth or decay is coming from
- Surfaces likely causes rather than leaving you to infer them
- Ask follow up questions in plain English and get charts and data back
- Hands you actionable next steps, not just another table
Ask the assistant anything
It is connected to your warehoused Search Console and GA4 data by default, so a follow up question is a sentence rather than another export.
Controls
Slice it, time it, take it with you
Filter and layer
Narrow to a sub folder, a brand term set, or everything except brand. Layer conditions with MUST and SHOULD logic, including combinations Search Console refuses, and pull any segment straight from your saved filter library in one click.
Set your own comparison period
The comparison window is yours to choose rather than a fixed preset. Put last quarter against the same quarter last year, or against three years ago, and the reports rebuild around it.
Export everything, in full
No row cap on any export. Take the whole winners or losers set to Sheets, CSV or PDF, including the month by month columns, so what lands in the client deck is the complete picture.
Built for the awkward question
When someone asks why traffic is down, this is the report that answers it: what fell, by how much, over which months, and on which URLs, with the AI layer offering the likely cause.
AI Insights
Ask it anything, not just what these reports show
A decline chart tells you a number. The assistant tells you what happened, which URLs it happened to, and what the pattern across them suggests, then hands you the next job rather than another export.
It is connected to your full warehoused Search Console and GA4 history by default, so a follow up question is a sentence rather than another export.
More on the AI AssistantDecline is concentrated in /blog/. 38 URLs are down 12,410 clicks, and the drop starts on 14 March.
That date lines up with the March core update. The affected URLs share a pattern: thin coverage against the queries they rank for, no named author or credentials, and no first hand evidence. This reads as a content quality and E-E-A-T problem rather than a technical one.
- Thin coverage: 31 of 38 URLs answer less than half the queries they rank for
- No author signals: No named author, bio or credentials on any affected page
- No first hand evidence: No original data, testing or lived experience in the copy
Want me to audit these 38 URLs and list the specific issues on each one?
Run the content auditWhat you get out of it
The outcome, not the feature list
Open a client call with the wins already on screen
Catch a page in decline while there's still time to fix it
Spot which content investments actually compounded
Works well with
More in Search Console Data
Connect a property. Watch the data start stacking.
Warehousing begins the moment you connect your Search Console property, there is no Google Cloud project to set up, no BigQuery and no schema to design. You simply connect your property and SEO Stack starts storing every row of your data from that day onwards.
- Credit card required
- Cancel within the trial and you won't be billed
- No contracts