Search Console Data
See how every page on your website is performing month by month
The URL Matrix gives you a visual view of how every page on your website has performed month after month, with a click trend on every row and colour coded month columns, so growth and decay are obvious at a glance rather than something you have to go looking for in a spreadsheet.
- 100% data privacy
- 99.99% uptime
- Nothing to configure
- Export anytime, no limits
Trusted by leading companies
The problem
Understanding how individual pages are trending usually means exporting several months of data and building it back together in a spreadsheet, which is slow enough that most people only do it when something has already gone wrong.
Why the matrix view matters
Seeing every page over time changes what you notice
Most reporting shows you totals for a period, which tells you what happened but not how it happened. Laying every URL out month by month means the trajectory of each page is visible on its own row, and trajectory is what you actually make decisions on.
You can read the whole site in one screen
Because every URL sits on its own row with a month by month click history running across it, you can take in the shape of an entire website in a few seconds. Patterns that would take an afternoon to find in a spreadsheet are visible immediately, whether that is a folder that has been climbing all year or a batch of pages that all fell off at the same time.
Trend indicators do the reading for you
Every row carries a click trend sparkline and each month cell is colour coded, so you are looking at direction rather than numbers. A page that has lost clicks for four months running looks completely different to one that had a single quiet month, and you do not have to work out which is which.
Change the window to suit the question
Switch the matrix between the last 3, 6 or 12 months, or set a custom range and compare it against the equivalent period before it. Short windows are useful for spotting something that has just broken, longer ones tell you whether a page is genuinely in decline or simply seasonal.
See performance by page type and section
Filter down to a folder, a template or a content type and the matrix rebuilds around it, so you can answer questions about your blog, your service pages or a particular campaign rather than the site as a whole.
Inside the tool
Read it yourself, or ask the AI Assistant about it
The matrix, the timeframes and filters that shape it, and the AI Insights layer that will summarise the whole thing and answer questions about it.
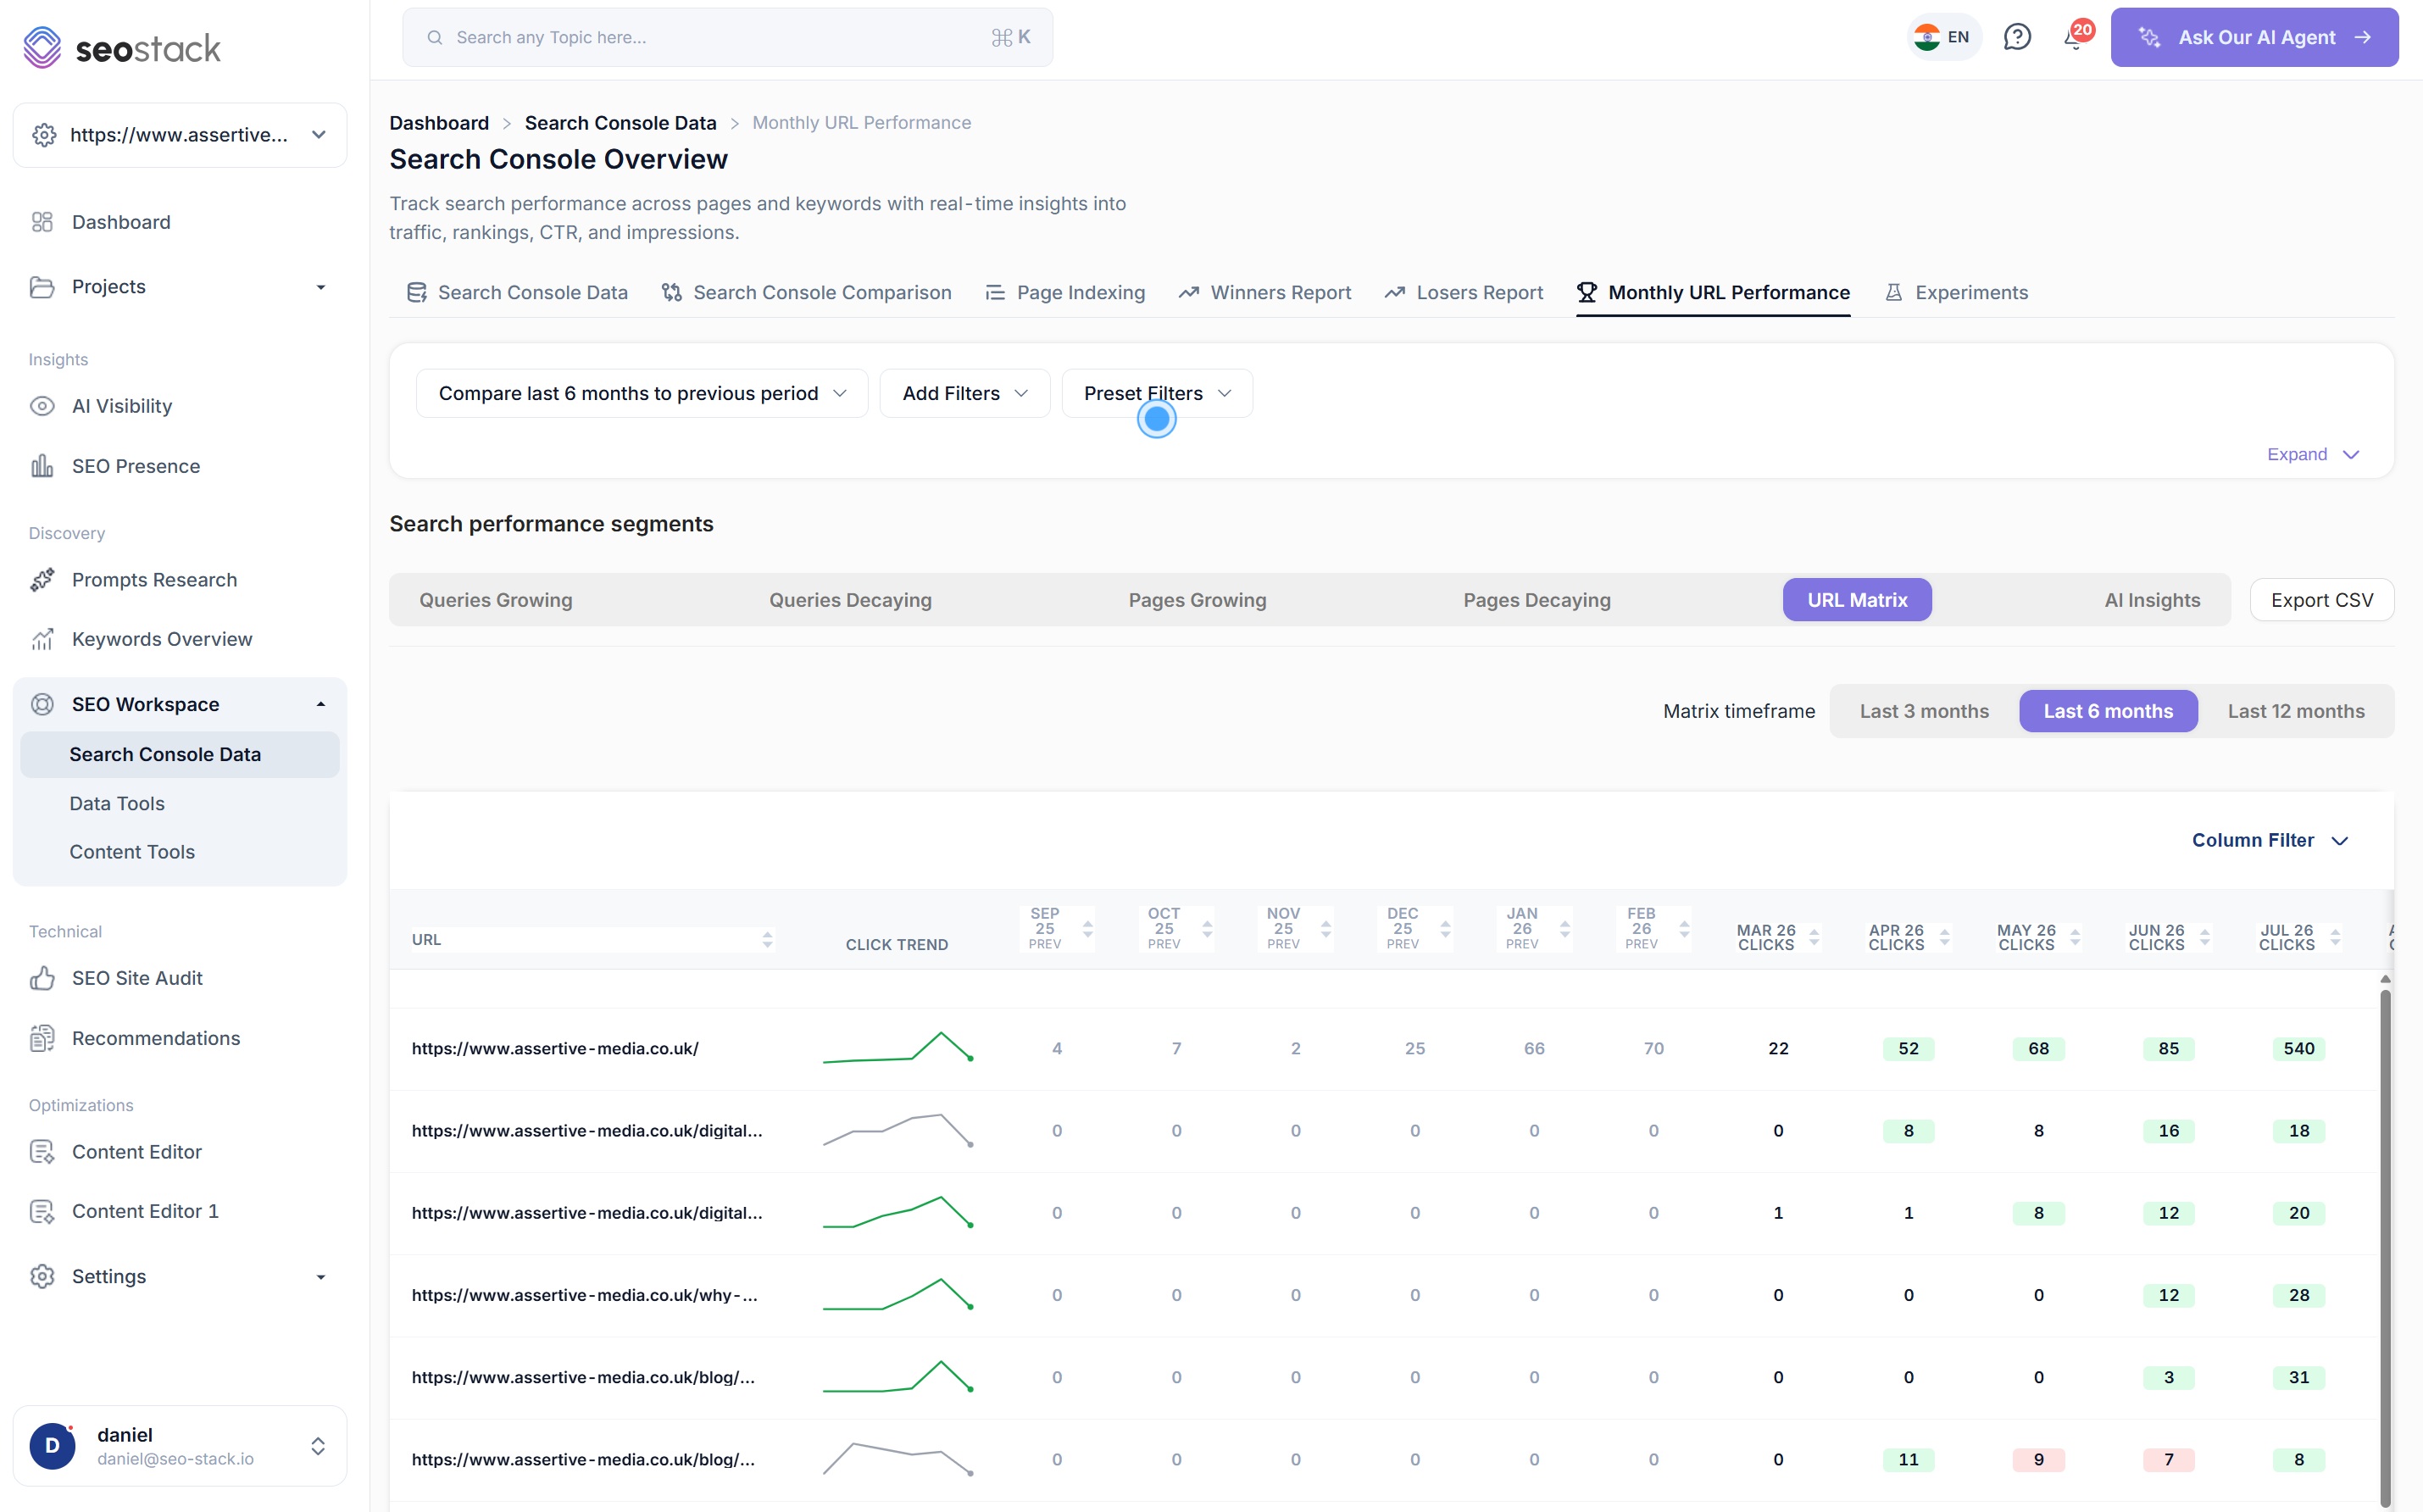
Every URL, every month, on one grid
- A click trend sparkline on every row, followed by month by month click columns
- The previous period sits alongside the current one, so you are always comparing like for like
- Month cells are colour coded where a page has gained or lost clicks against the month before
- Sort by any column and use the column filter to show only the months you care about
- Segments for queries growing, queries decaying, pages growing and pages decaying sit alongside the matrix
The sparkline is doing more work than it looks
Reading a row of twelve numbers takes concentration, reading a line does not, which is why you can scan hundreds of URLs and still spot the handful that are in trouble.
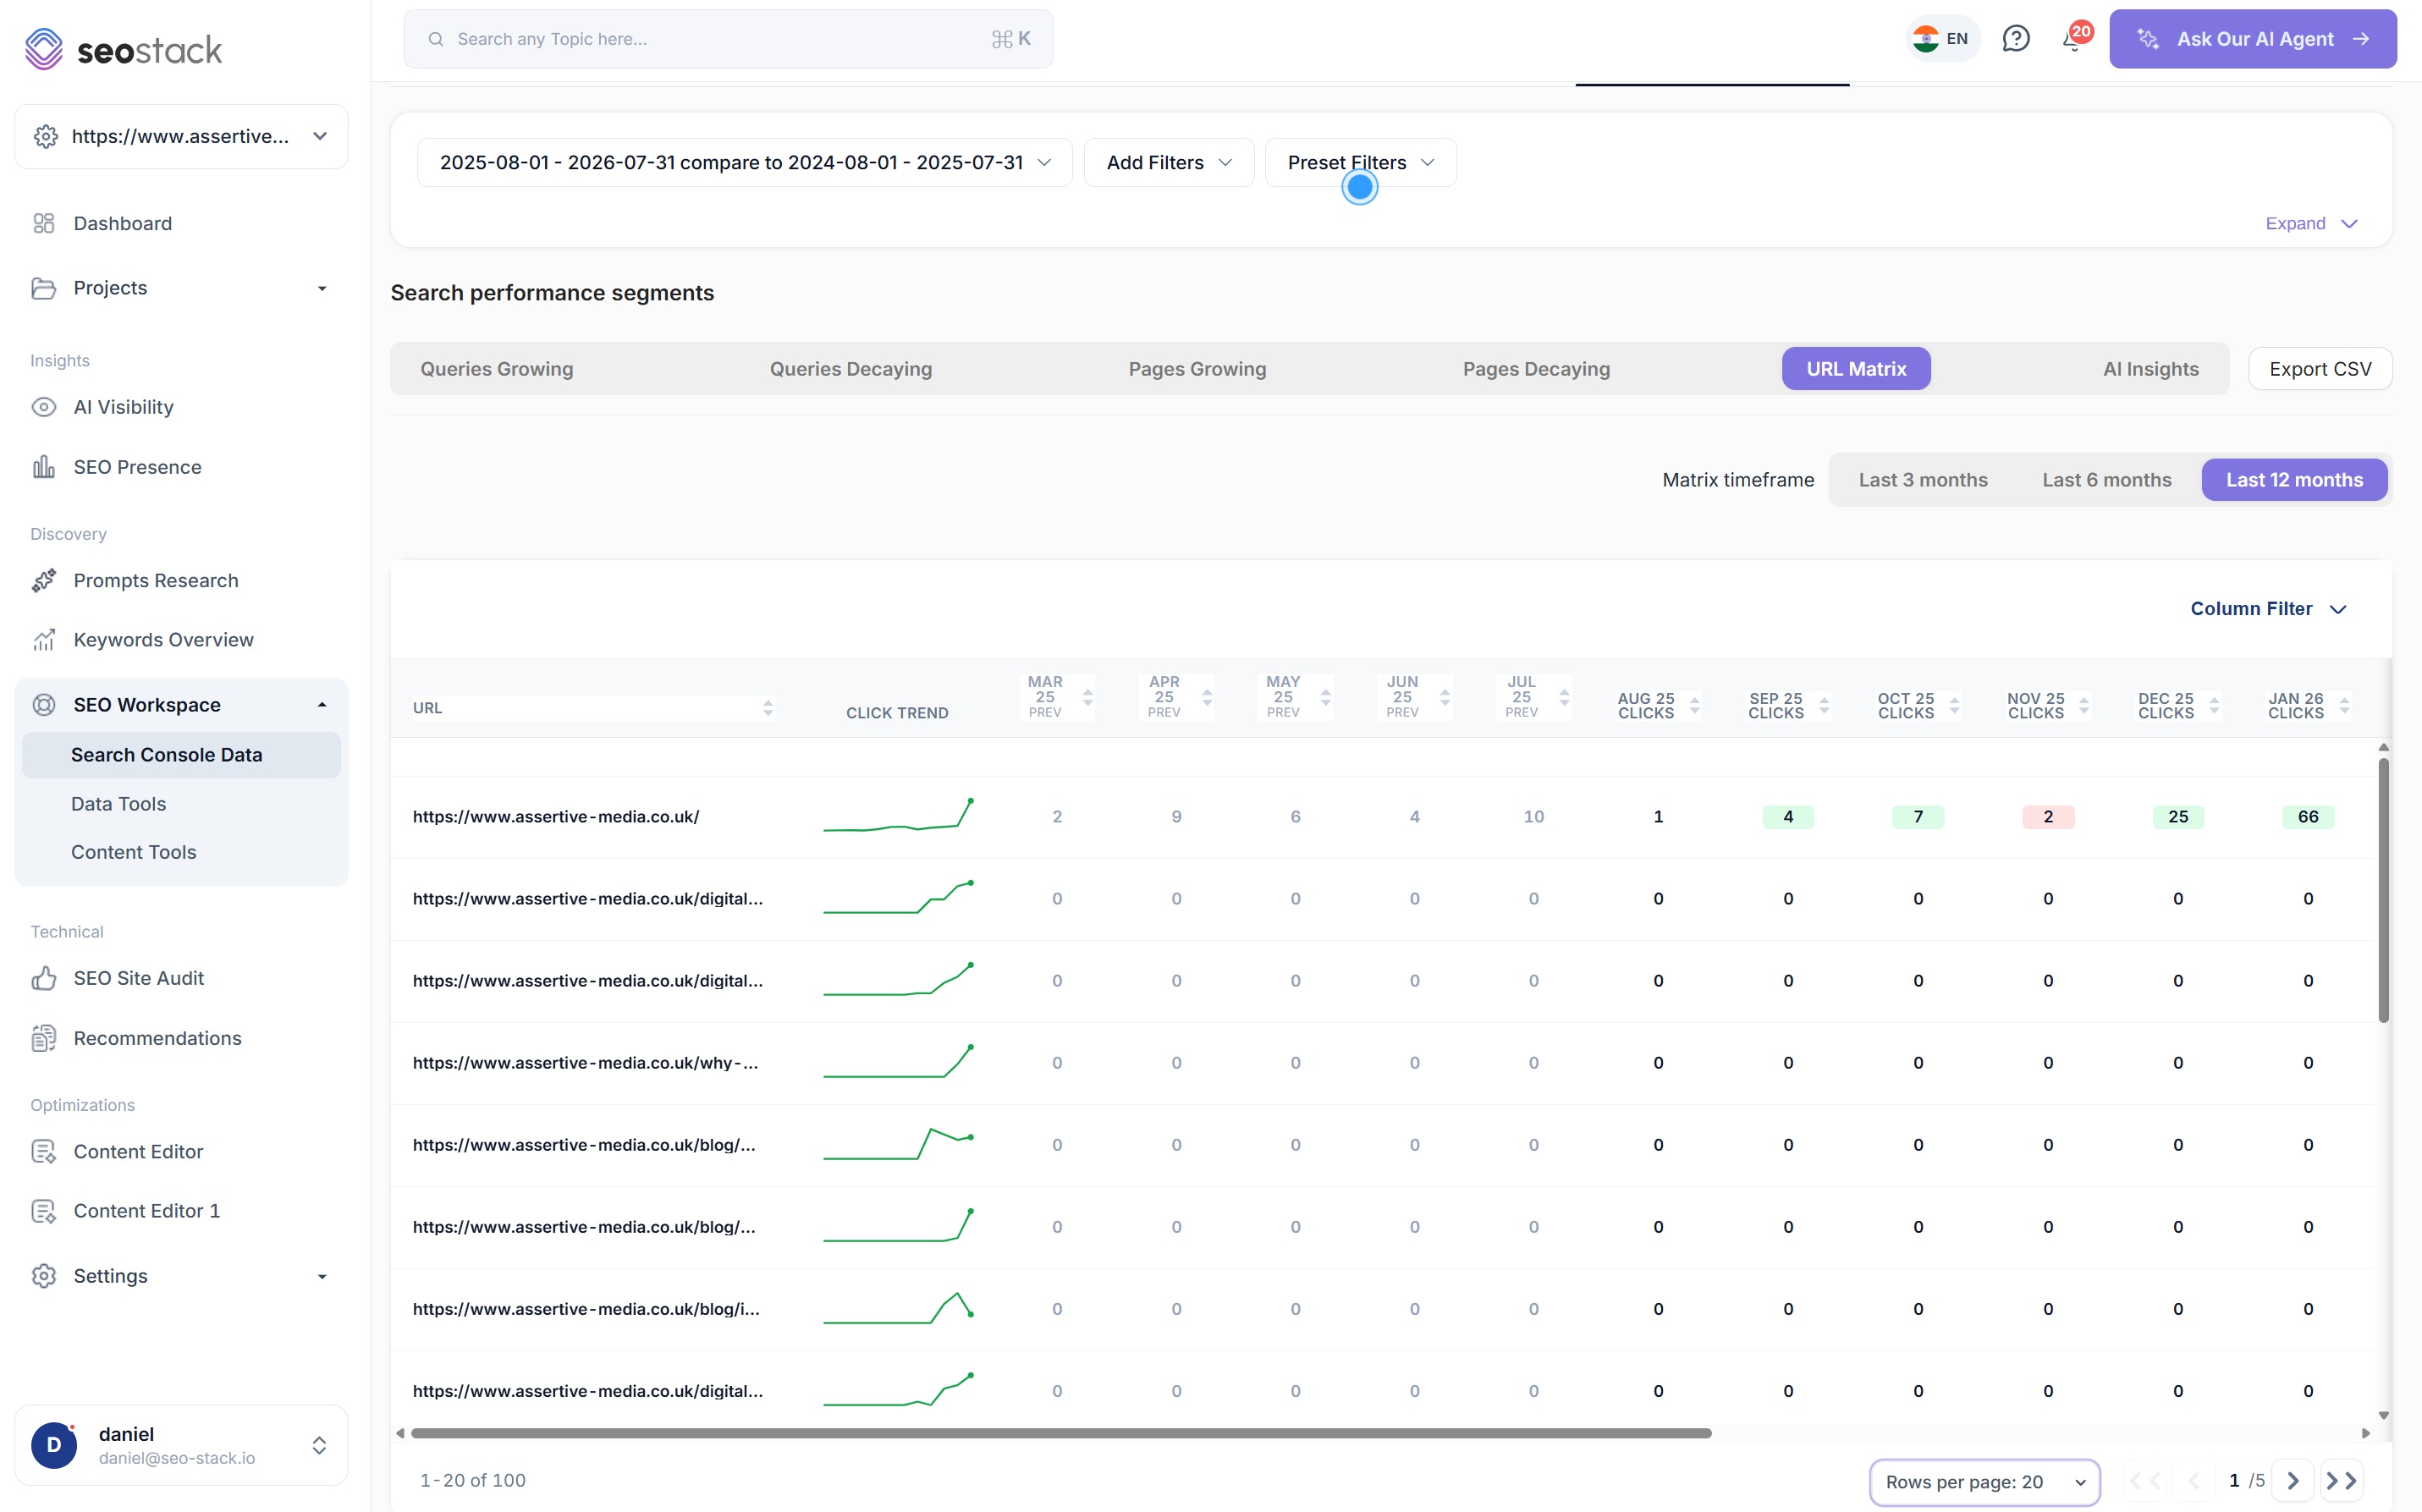
Set the period, then narrow it down
- Switch the matrix timeframe between the last 3, 6 or 12 months in one click
- Or set an explicit range and compare it against the same length of time before it
- Add filters and preset filters to isolate a folder, a page type or a campaign
- Because your data is warehoused, longer comparison windows keep working rather than running into Google's 16 month cut off
- Rows per page and pagination on a matrix that covers your whole site rather than a truncated sample
Ask questions about the matrix instead of reading it
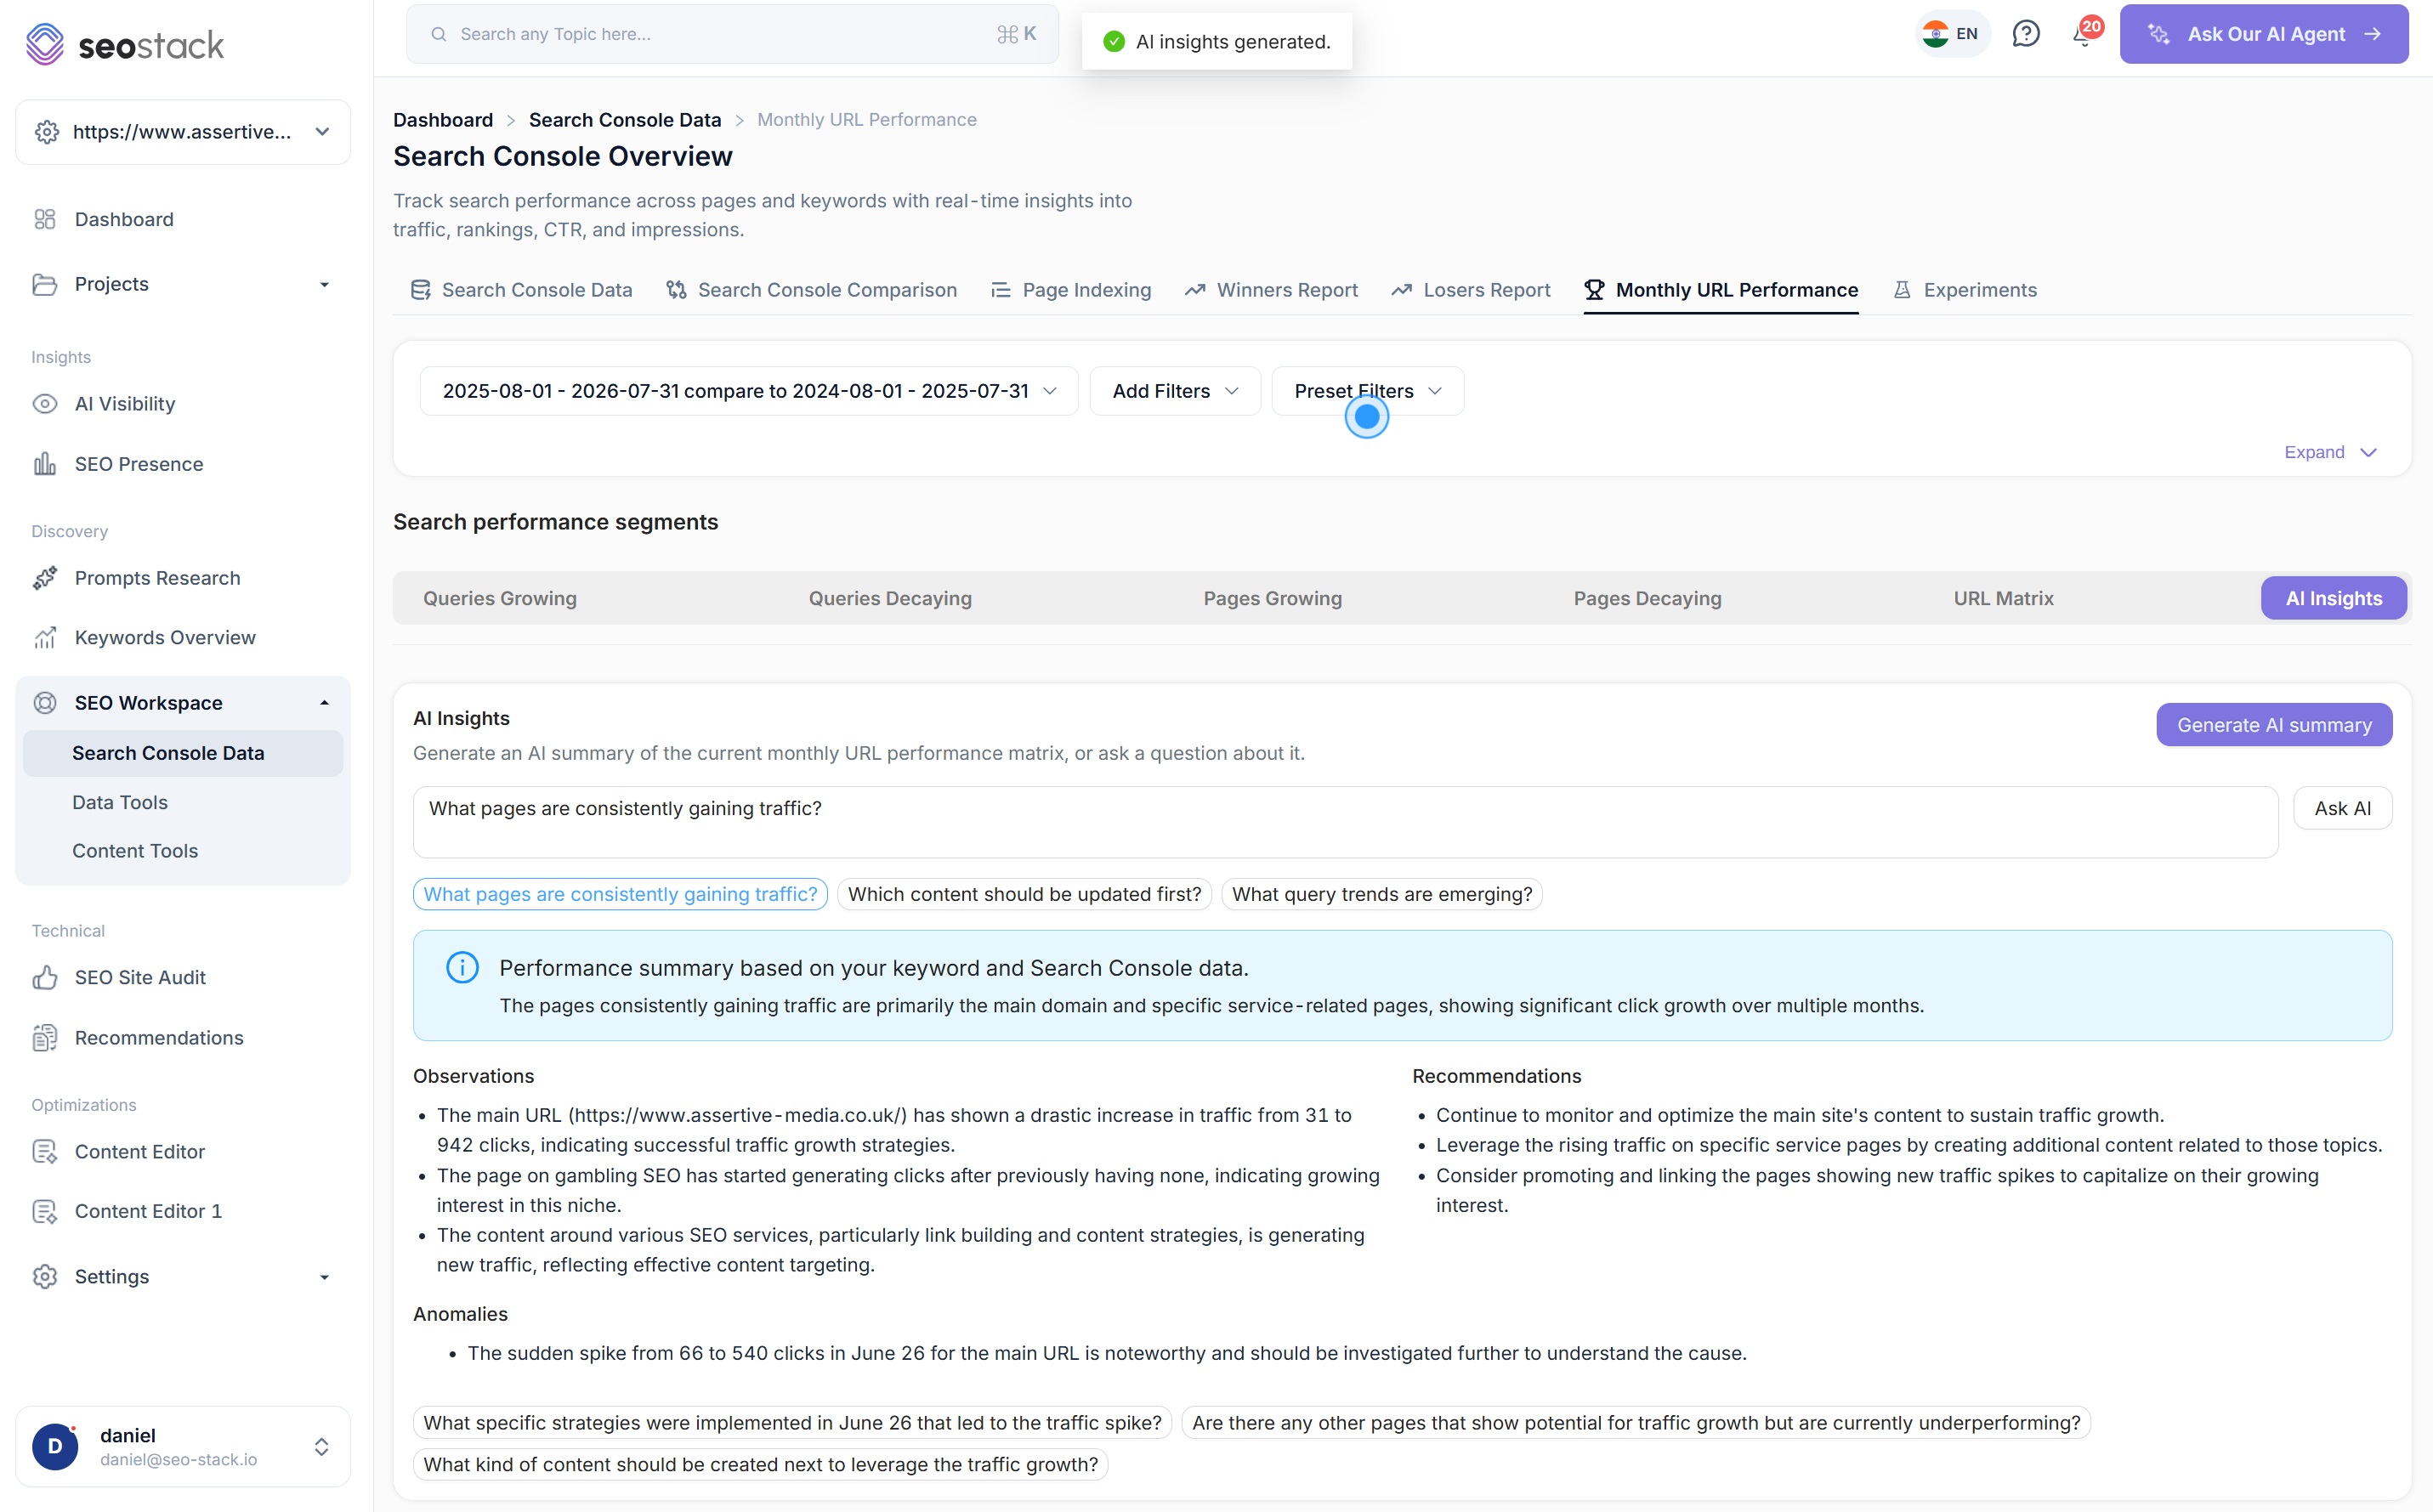
- Generate an AI summary of the current matrix, or type your own question and ask it directly
- Suggested questions get you started, such as what pages are consistently gaining traffic or which content should be updated first
- You get a performance summary, observations, recommendations and anomalies rather than just an answer
- Follow up questions are offered based on what it found, so you can keep digging without knowing what to ask next
- It reads the matrix you are currently looking at, so any filters or timeframes you set apply to the answer too
Anomalies are the part people miss
It will flag a sudden spike or drop that does not fit the pattern and tell you it is worth investigating, which is exactly the kind of thing that goes unnoticed until it becomes a quarter you have to explain.
Why catching decay matters
Decay is quiet, and that is exactly what makes it expensive
A page that stops ranking does not announce itself, it simply stops appearing, and because the loss is spread across a lot of URLs rather than concentrated in one, it rarely shows up as anything dramatic on a traffic chart until a lot of ground has already gone.
Clicks gained against clicks lost
GainedLost- Clicks gained
- +10,790
- Clicks lost
- -13,030
- Net
- -2,240
Illustrative. Publishing carried on all year, but because decay was compounding and growth was not, the site finished it down.
When decay outpaces growth, the whole site goes backwards
Most websites are doing both things at once, some pages are picking up clicks while others are losing them, and the number that actually matters is the difference between the two. You can publish consistently all year, hit every content deadline and still finish the year down, simply because the volume of decaying URLs grew faster than anything new could replace.
Left unchecked for long enough this becomes genuinely disruptive and genuinely expensive, because the revenue attached to those pages disappears at the same rate the clicks do, and by the time it is obvious in a monthly report you are looking at months of compounding loss rather than a page or two that needed refreshing.
Decay compounds, publishing does not always keep up
New content takes months to mature, whereas a page that has started slipping usually keeps slipping, so the gap between the two widens quietly over time.
A clean index is a stronger index
Keeping a large volume of declining, thin or duplicated URLs in the index gives Google more low quality signals to weigh against your site. Pruning, consolidating or refreshing those pages tends to help the pages you do care about.
Early is cheap, late is not
A page caught while it is still ranking somewhere usually needs a content refresh. The same page caught a year later often needs rewriting, relinking and re-earning its position from scratch.
Built in AI Assistant
Ask it what is working and what is not
The AI Assistant sits inside the report rather than alongside it, so you can ask a question about the matrix you are looking at and get an answer that accounts for the filters and timeframe you have already applied. It is quicker than exporting the data and far quicker than working through it row by row.
- What pages saw sustained decline, and why?
- What pages are consistently gaining traffic?
- Which content should be updated first?
- What query trends are emerging?
- Which page types are performing best?
- Are there pages with potential that are currently underperforming?
Audits and analysis
It reads the matrix as it is currently filtered and gives you a written performance summary along with observations about what has actually happened across your pages.
Trend identification
It picks out the pages and sections that are consistently moving in one direction, which is far more useful than a single month that happened to be up or down.
Anomaly detection
Sudden spikes and drops that do not fit the surrounding pattern get flagged for investigation rather than being averaged away.
Recommendations and feedback
You get suggestions on what to do next, whether that is content to update first, pages worth promoting internally or topics worth expanding into.
Exporting
Get the data out quickly when you need to work on it elsewhere
Export the whole matrix in one click
Export CSV sits directly above the report, so getting the full month by month picture out for analysis, a client deck or your own modelling takes a couple of seconds rather than a series of separate exports you then have to stitch together.
No row limits on anything you take out
Google Search Console caps what you can export, which is the reason most people end up analysing only their top pages. Because SEO Stack reads your warehoused data, the export contains every row rather than the first slice of them.
Export what you filtered, not everything
Whatever filters and timeframe you have applied carry through to the export, so you can pull just a folder, a page type or a decaying segment and hand it straight to whoever is doing the work.
What you get out of it
The outcome, not the feature list
See which templates and sub folders are compounding and which are quietly falling away
Catch decay early, while a content refresh will still fix it
Get answers about page and content performance without exporting anything
Connect a property. Watch the data start stacking.
Warehousing begins the moment you connect your Search Console property, there is no Google Cloud project to set up, no BigQuery and no schema to design. You simply connect your property and SEO Stack starts storing every row of your data from that day onwards.
- Credit card required
- Cancel within the trial and you won't be billed
- No contracts