Discovery & Opportunity
Forecast where your organic traffic is heading
Ask the AI Assistant to project clicks for your whole domain, a sub folder, a URL group or a set of keywords, and it will build the forecast from your own warehoused Search Console history and chart it alongside your actual performance.
- 100% data privacy
- 99.99% uptime
- Nothing to configure
- Export anytime, no limits
Trusted by leading companies
The problem
Traffic forecasts are usually invented in a spreadsheet, and clients can tell. Building one properly means exporting months of data, modelling it by hand and doing it all again the moment somebody asks for a different segment.
The basics
What click forecasting actually is
Click forecasting is the practice of taking what your website has already done in search and projecting it forward, so you have some idea of where organic traffic is likely to be in six months, a year or three years time. It is the closest thing SEO has to a revenue forecast, and it is the question every client, finance director and board eventually asks.
A click model works by reading the history of a segment, whether that is your whole domain, a sub folder, a group of URLs or a set of keywords, and looking at the shape of it. Growth rate, seasonality, how consistent the trend has been and how much the numbers move month to month all feed into the projection, and the longer the history you have, the more there is to work with.
This is exactly why warehoused data matters here. Google throws away your Search Console performance data after 16 months, which means a forecast built on Google alone is working from less than a year and a half of history and cannot see a full seasonal cycle twice. SEO Stack keeps everything from the day you connect, so a forecast has years of real performance behind it rather than a partial view.
What you can forecast
Ask for a projection and it gets built
Forecasting runs through the AI Assistant, so rather than configuring a model you describe what you want and it reads your warehoused data, works out the projection and draws it.
Any segment you can describe
Forecast the entire domain, a single sub folder, a URL group, or narrow it by keyword, device and country. If you can describe the segment in a sentence, the assistant can build a projection for it.
12, 24 or 36+ months forward
Choose how far out you want to look. Shorter windows tend to be steadier, longer ones are more useful for planning and budgeting, and you can run both and compare them.
More than just clicks
Impressions, CTR and average position can all be forecast over time as well, which is often more useful, because a clicks projection with no view of impressions tells you very little about why the line moves.
Actual and forecast on one chart
Your real historic performance is drawn as a solid line and the projection continues as a dotted one, so the join between what happened and what is predicted is always visible rather than blurred together.
Inside the tool
From a whole domain projection down to a single folder
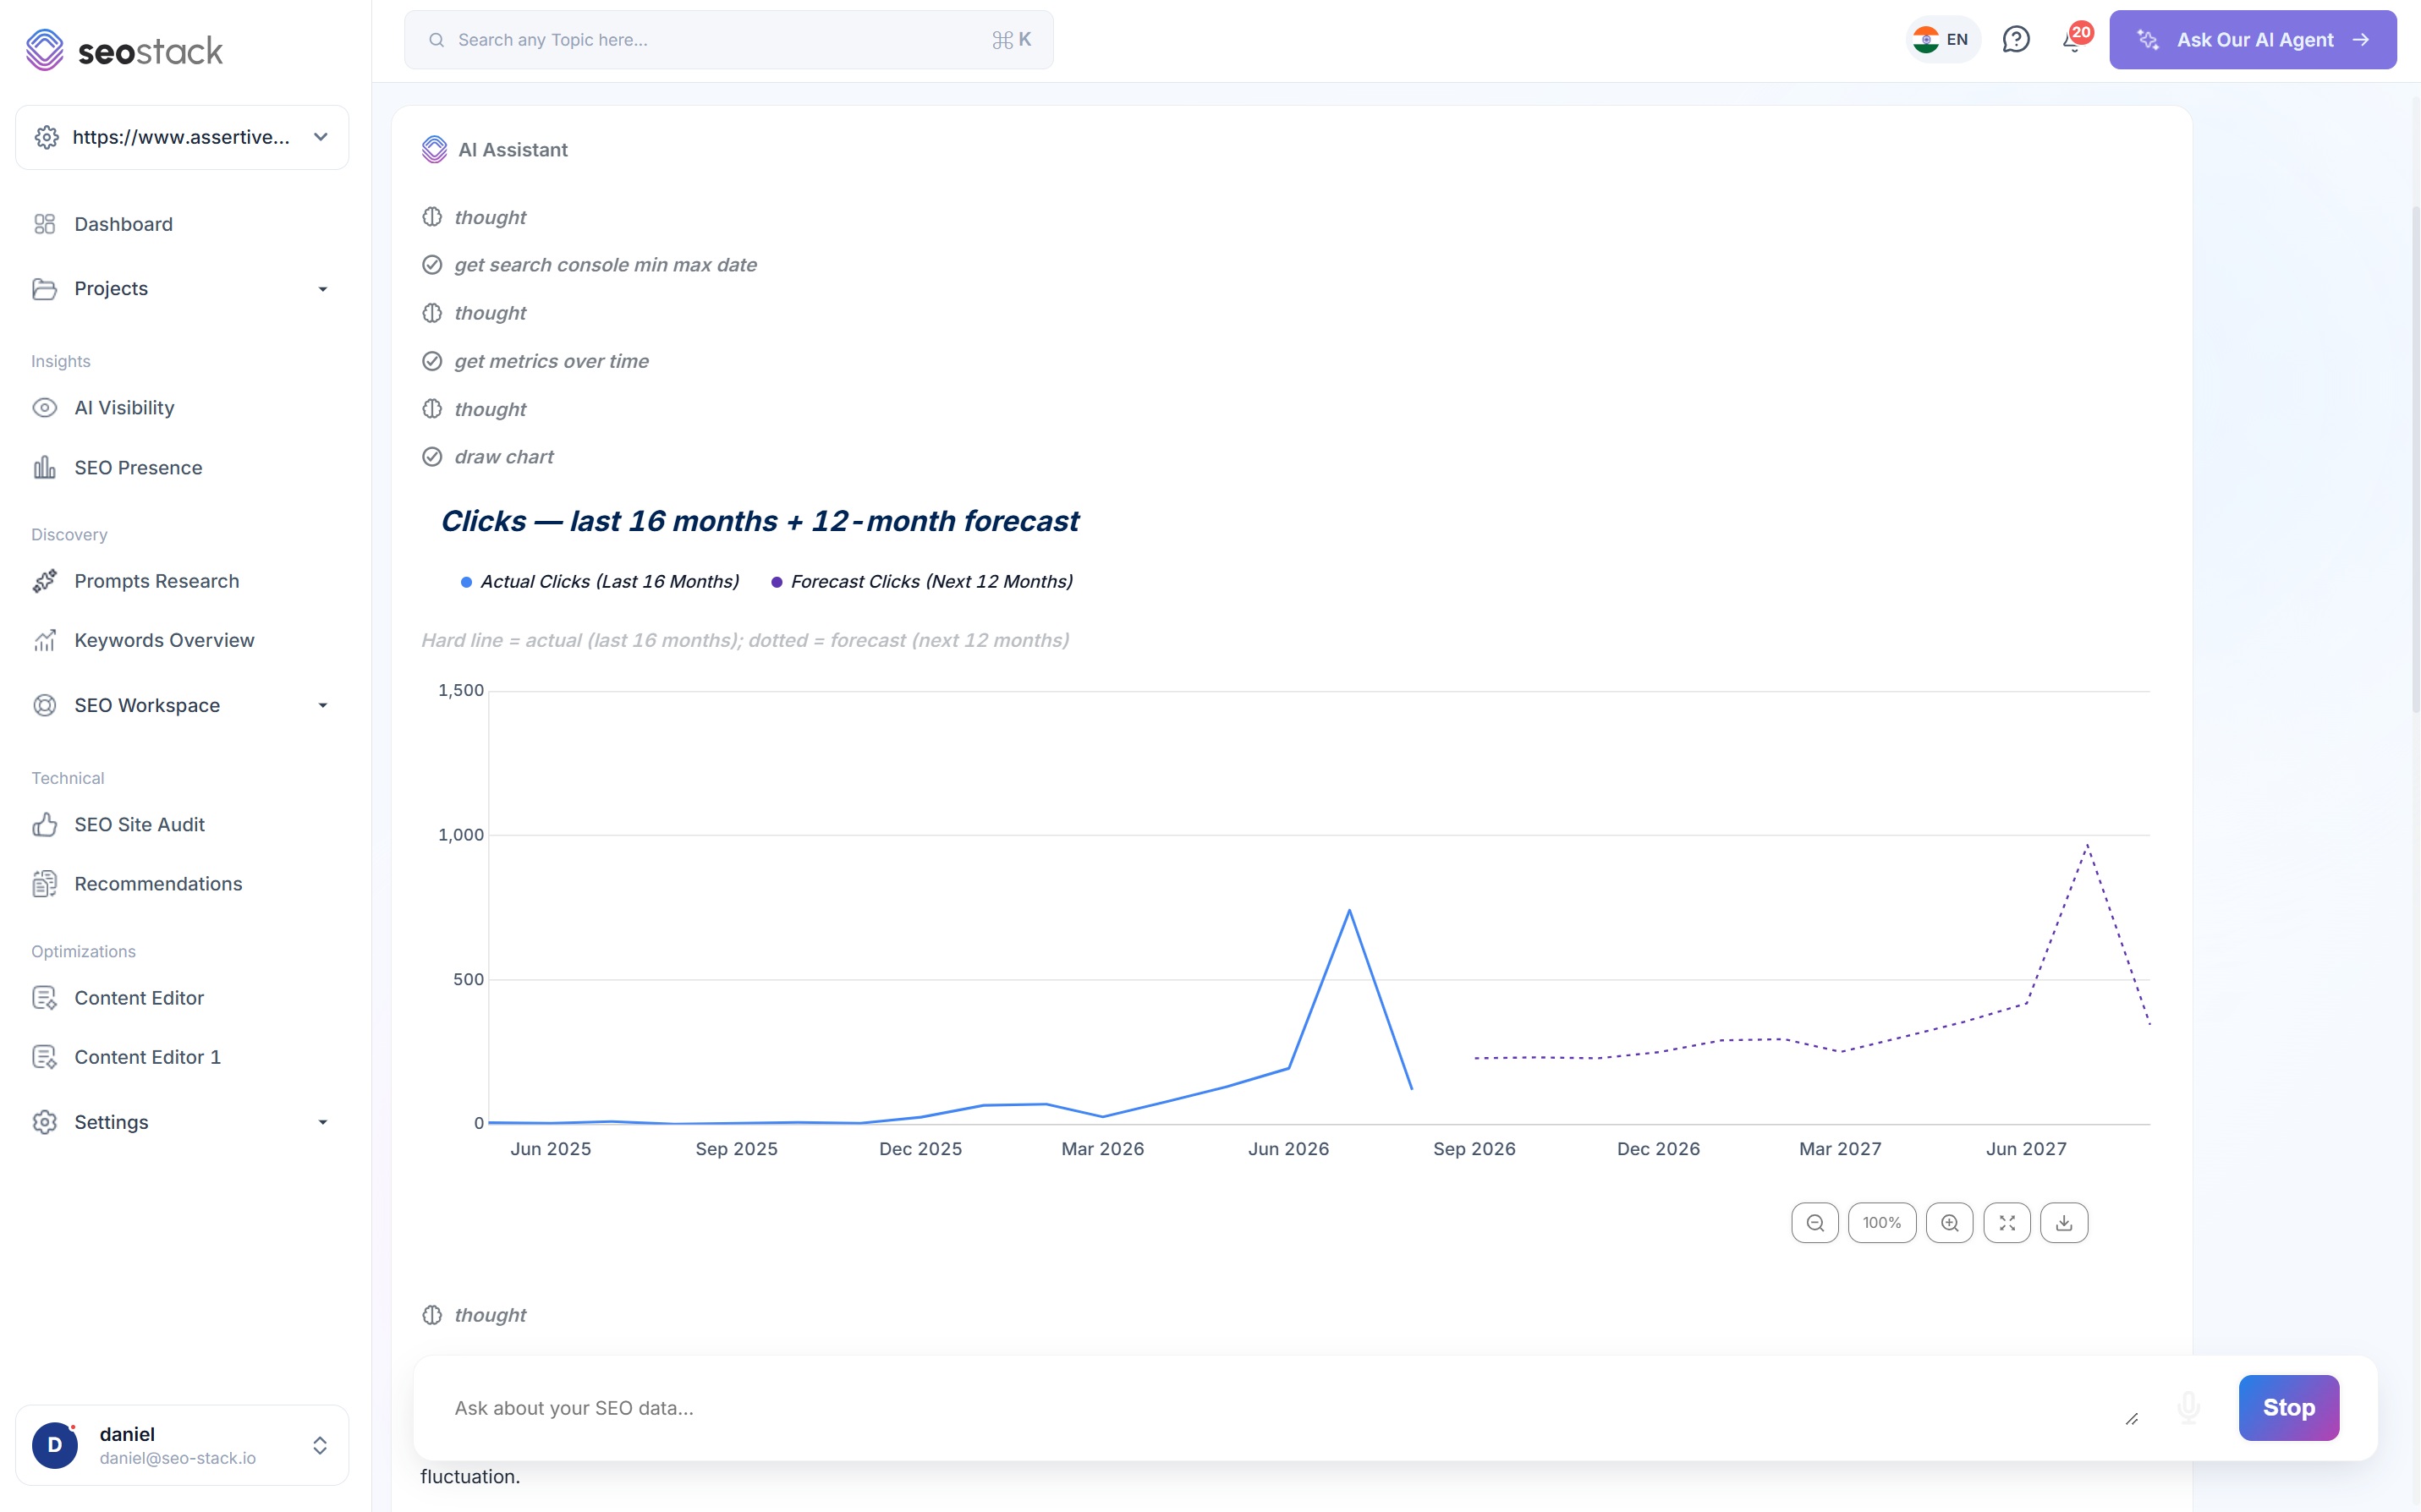
A projection for the site, built while you watch
- The assistant works through it in the open, finding your date range, pulling metrics over time and then drawing the chart
- Actual performance is a solid line, the forecast continues as a dotted one
- Chart controls sit underneath for zooming, resetting to 100%, expanding to full screen and downloading the chart as an image
- Ask a follow up question and it will rebuild the chart around the answer
Compare sub folders against each other
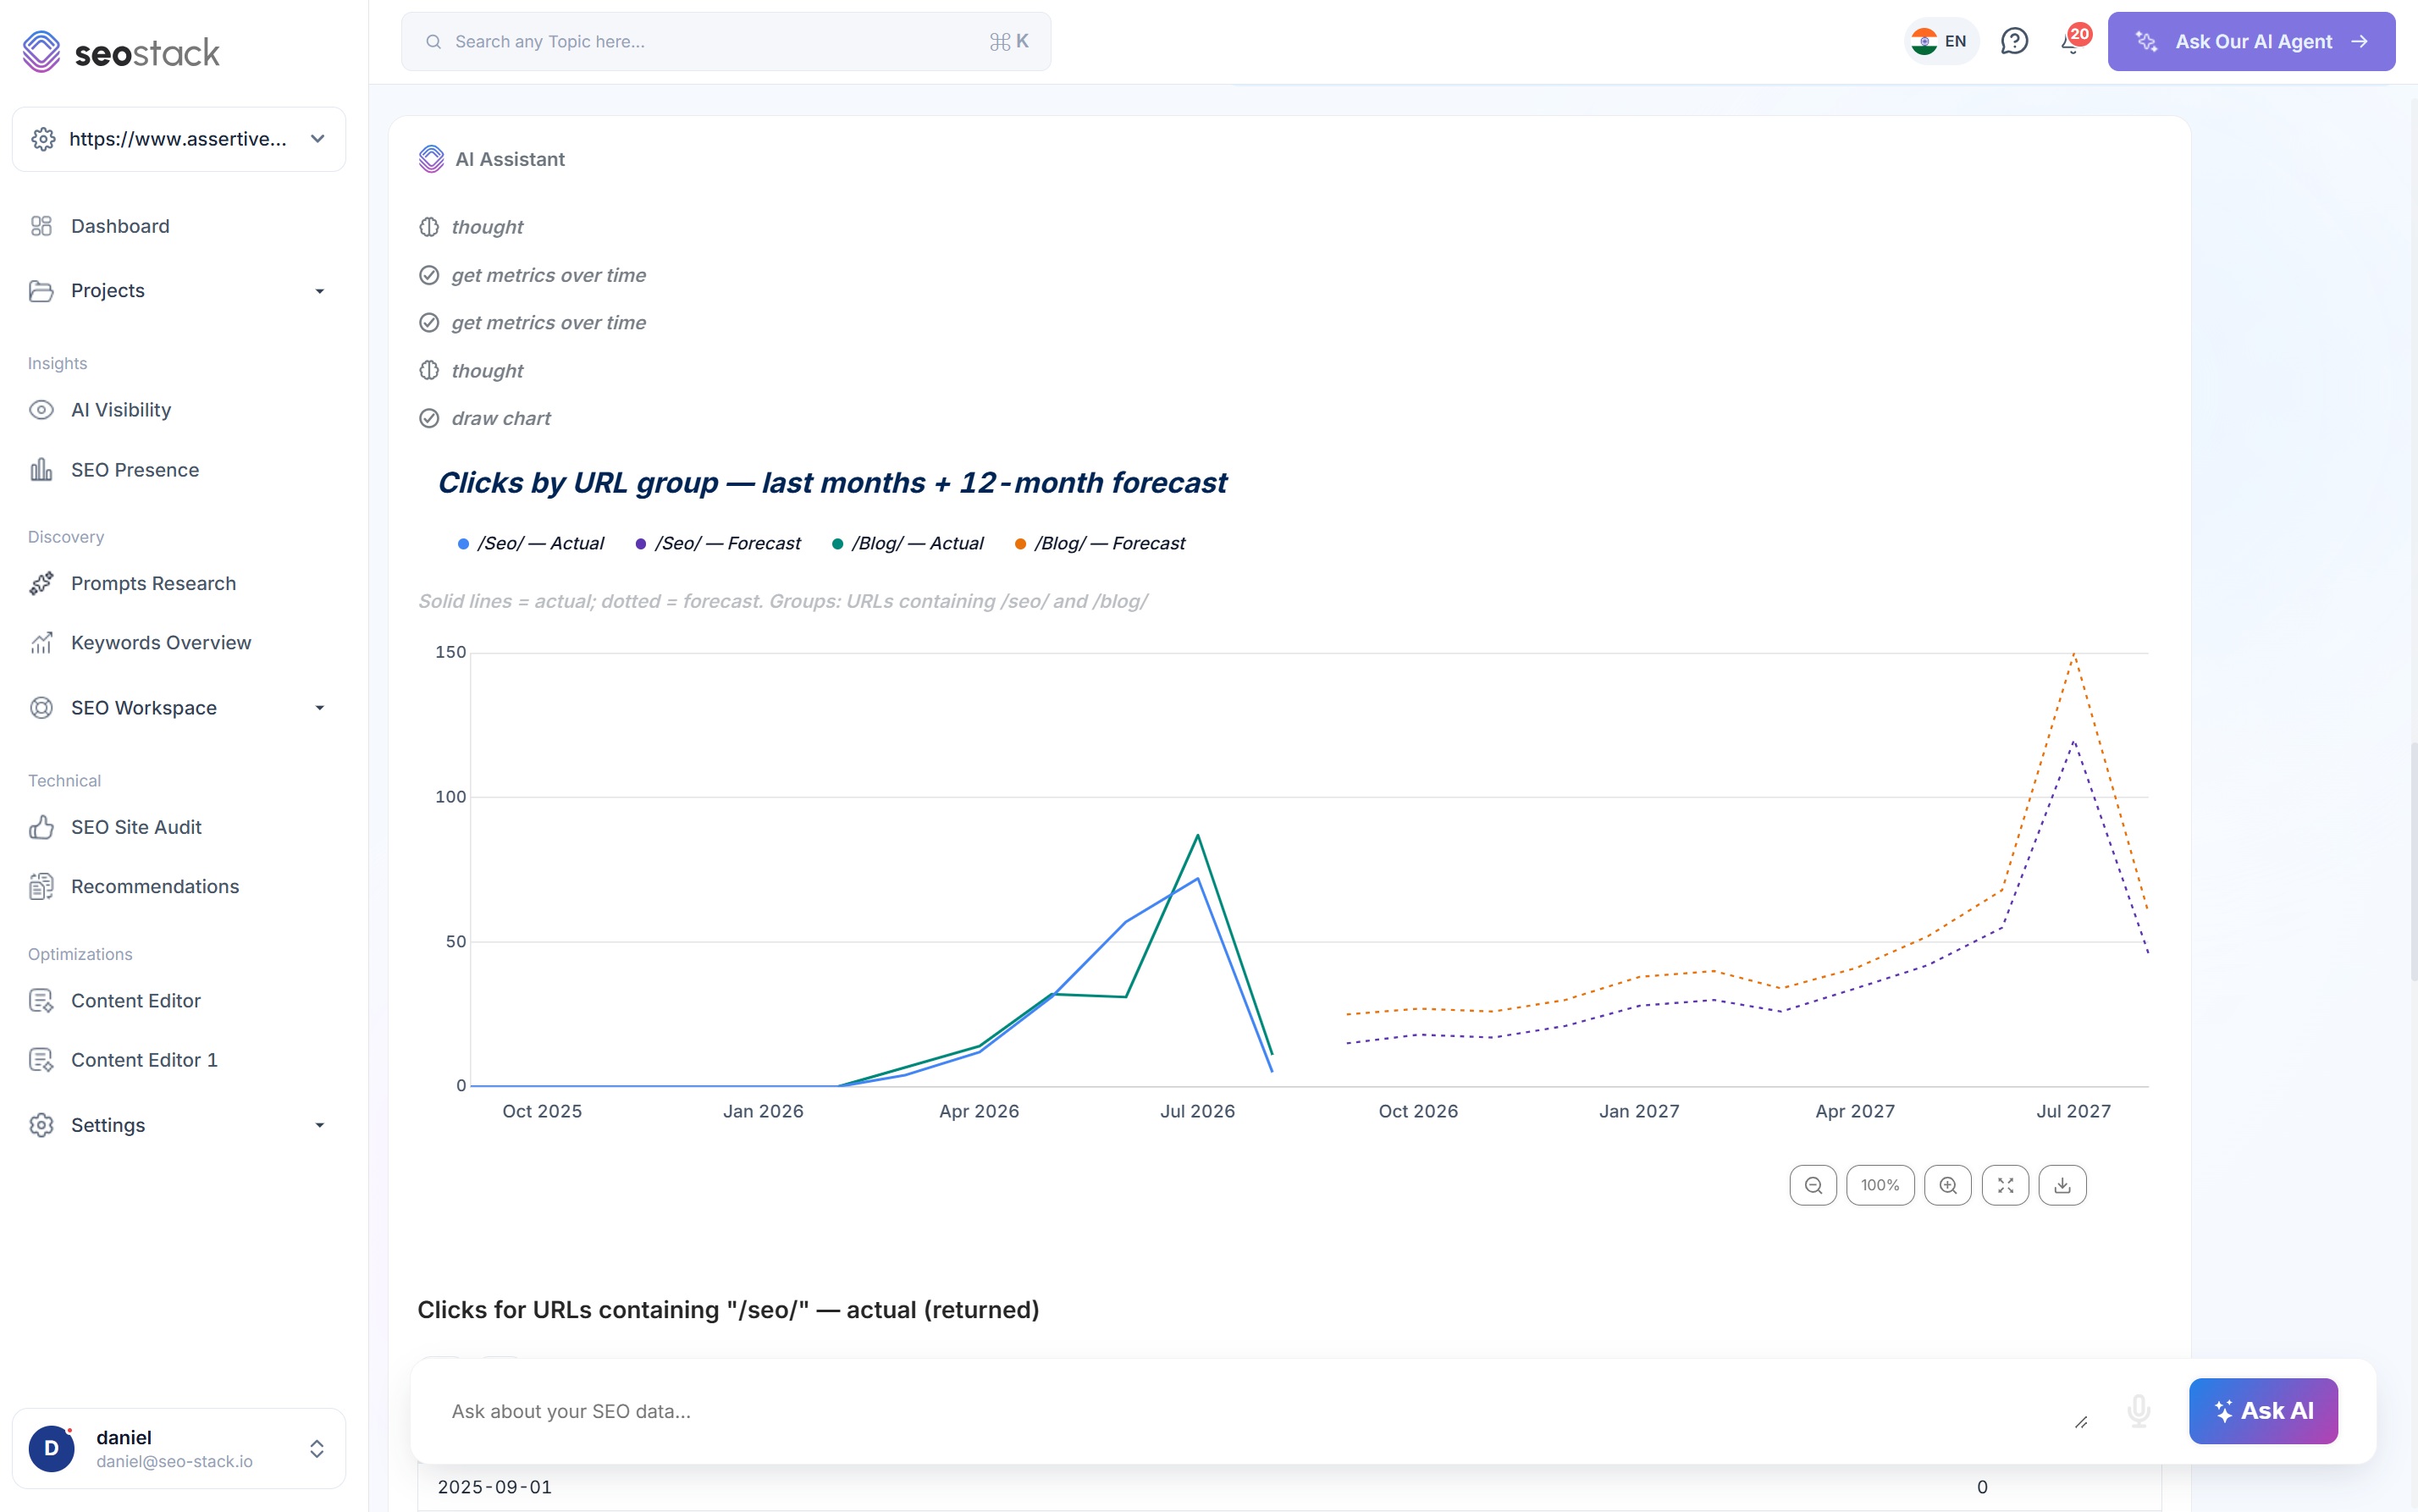
- Forecast several URL groups on the same chart, each with its own actual and forecast line
- Useful for planning where to put budget, because the folders growing fastest are not always the ones you assumed
- Groups can be anything the assistant can match, such as every URL containing /seo/ or /blog/
- Table data underneath breaks the numbers out by month so you have the figures as well as the picture
Charts you can actually work with
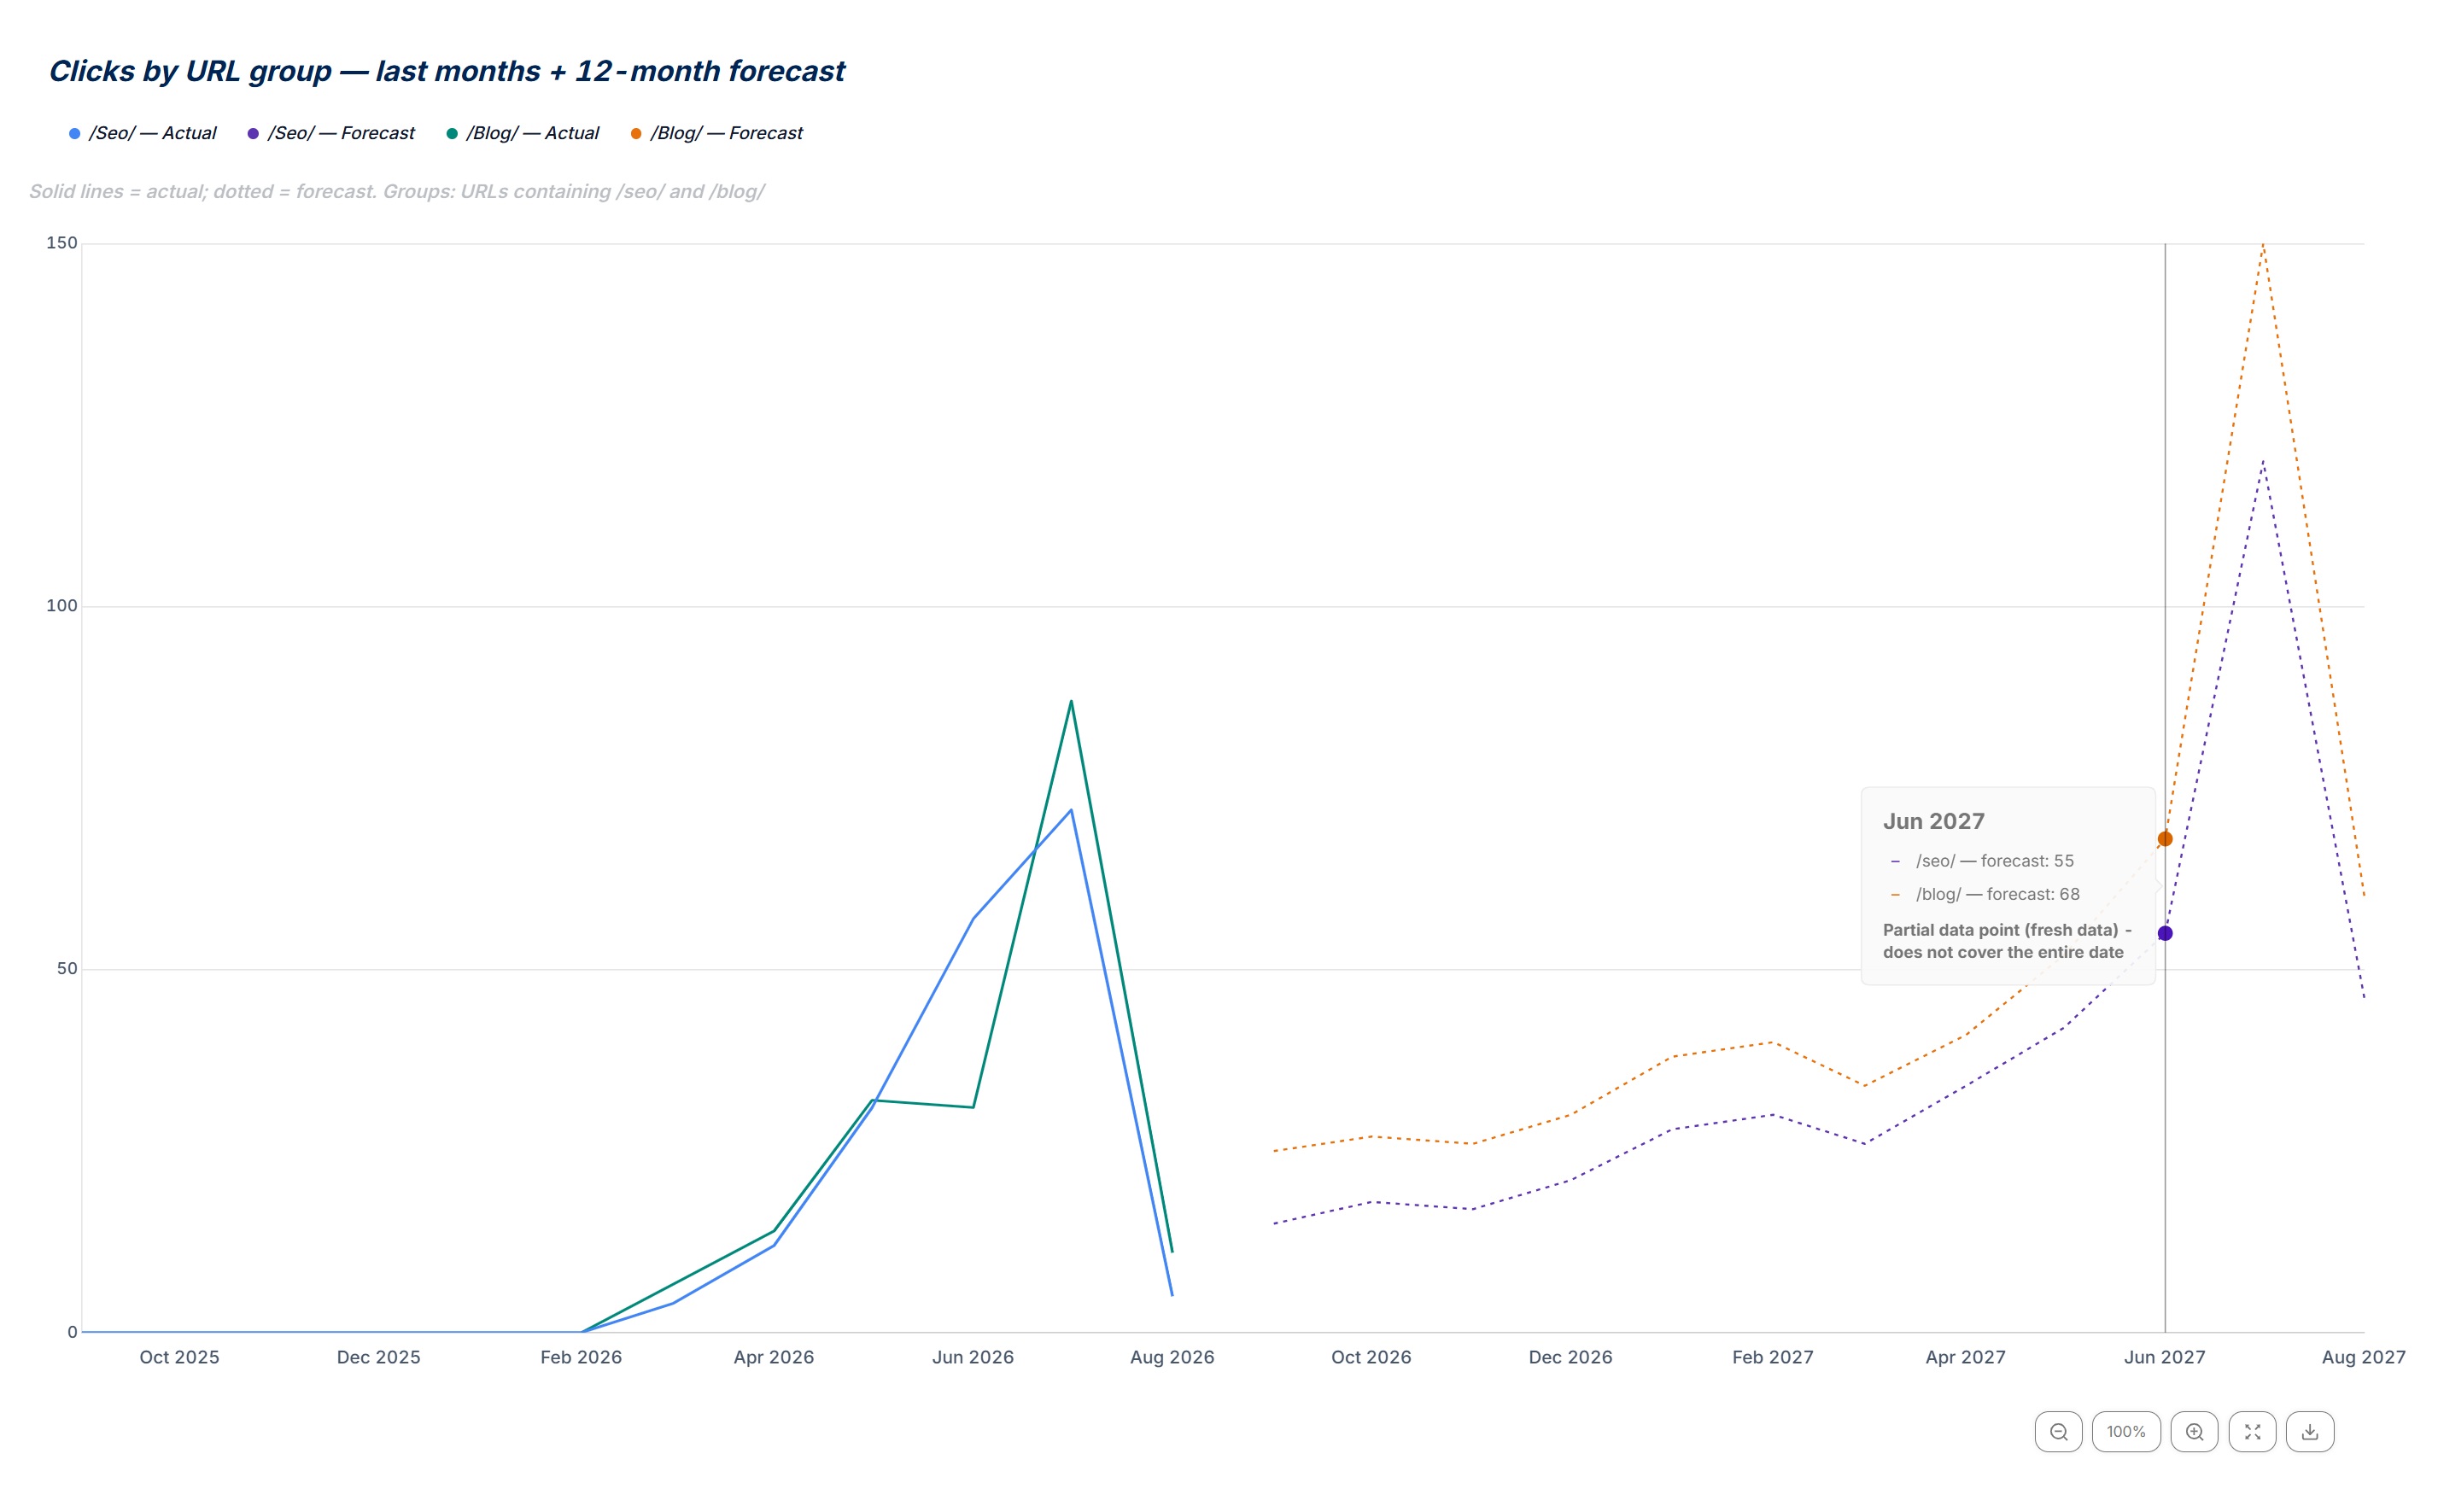
- Hover any point for a breakdown of every series at that date
- Zoom in and out, drag around the chart and expand it to full screen
- Export the chart as an image to drop straight into a deck or a report
- Partial data points are labelled as partial rather than being presented as complete months
Small honesty, big difference
Flagging a partial month rather than charting it as a real drop stops people drawing the wrong conclusion from the last point on the line, which is one of the most common ways forecasts get misread.
Charts, tables & exports
Ask for the chart you actually need
You are not limited to one chart type or one layout. Describe what you want to see and the assistant builds it, then you can take it away.
Line charts
The default for anything over time, with actual and forecast drawn separately so the join is always clear.
Bar charts
Better when you are comparing months, folders or segments against each other rather than watching a trend.
Pie charts
Useful for showing how forecast clicks are expected to be distributed across sections of the site.
Table data by month
Clicks by sub folder, by month, going forwards, so you have the underlying numbers rather than only a picture of them.
Custom reports
Ask for a report built around a specific question and it will assemble it, ready to export.
Export what you build
Charts download as images and report data exports out, so anything you produce can go straight into a deck or a client document.
Every chart is interactive
- Zoom in and out
- Drag around the chart
- Expand to full screen
- Download as an image
Show your working
Ask it how it arrived at the forecast
A forecast you cannot interrogate is a forecast you should not put in front of a client. You can ask the assistant what data it looked at, how far back it went, what it extrapolated from and why the line does what it does, and it will tell you in plain English.
You also see it working as it goes, the steps it takes to find your date range, pull the metrics and draw the chart are all shown rather than hidden behind a loading spinner. If something in the projection looks wrong, you can see where it came from.
More on the AI AssistantWho it is for
Why SEOs forecast in the first place
Agencies and freelancers
Forecasting is usually the difference between a pitch that lands and one that does not, because a projection built from the prospect's own Search Console history is far more persuasive than a generic growth curve. It also takes minutes rather than an afternoon in a spreadsheet.
In-house SEO teams
Budget conversations go better with a number attached. Being able to show what the current trajectory produces, and what a specific area of the site is projected to contribute, makes the case for resource far easier to argue.
Client reporting
Clients want to know where this is going, not just where it has been. Adding a forward view to a monthly report changes the conversation from reviewing the past to planning the next few quarters.
Worth being clear about
A click forecast is a projection built from historic performance, it is not a prediction and it is not a promise. It tells you what the current trajectory produces if things carry on roughly as they have been, which is genuinely useful for planning, but it should never be presented to a client as a number they can bank.
Things that will move a forecast away from reality
Core updates can change everything overnight
A single Google core update can move a site significantly in either direction, and no model built on your past performance has any way of anticipating that. It is the single biggest reason a forecast and reality end up apart.
A forecast assumes things carry on roughly as they are
It assumes you keep publishing at a similar rate, that your competitors do not do anything dramatic, that your site stays technically healthy and that nothing significant changes about the market. In practice at least one of those is usually wrong.
The search results themselves keep changing
AI Overviews, AI Mode and the growing share of research happening inside LLMs are all changing how many people click through to websites at all. Historic click behaviour is a less reliable guide to future click behaviour than it used to be.
Short history means wider margins
A newer site, or a segment with only a few months of data behind it, will produce a much less dependable projection than one with several years of consistent history. Treat the two very differently.
The way we would suggest using it is as a direction of travel rather than a target, presented as a range and revisited regularly as new data comes in. Used that way it is one of the most useful things you can put in front of a client, and re-running it every month costs you almost nothing.
What you get out of it
The outcome, not the feature list
Give clients a projection grounded in their own performance rather than a guess
Model any segment in seconds rather than rebuilding a spreadsheet each time
Show the range of likely outcomes instead of promising a single number
Connect a property. Watch the data start stacking.
Warehousing begins the moment you connect your Search Console property, there is no Google Cloud project to set up, no BigQuery and no schema to design. You simply connect your property and SEO Stack starts storing every row of your data from that day onwards.
- Credit card required
- Cancel within the trial and you won't be billed
- No contracts