Top Level Domain Queries: review queries with and without clicks
Use the domain-level chart to compare the trends in query groups with and without clicks.
Top Level Domain Queries provides a chart with With Clicks and Without Clicks series for the displayed website scope. Use it as an initial check of how those query groups develop over time.
How to use it
- Open SEO Workspace → Data Tools → Top Level Domain Queries.
- Check the URL displayed above the chart.
- Select Day, Week or Month.
- Read each series against its own labelled axis.
- Investigate individual pages in Query Row Count Tool or URL Query Count Tool.
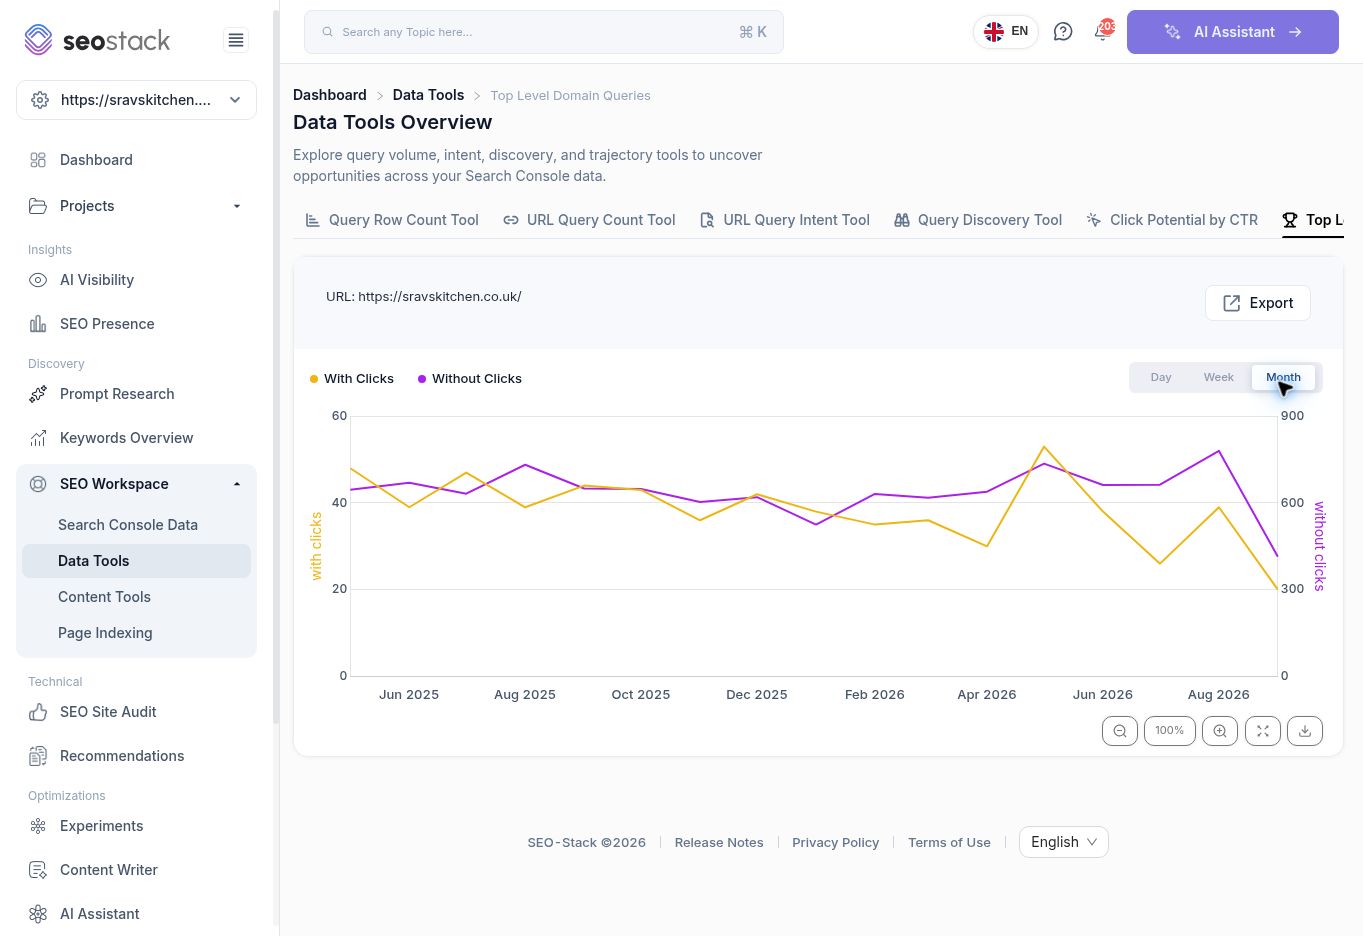 Domain query chart in monthly view, with separate axes.
Read the chart correctly
The reviewed monthly view used a left axis for With clicks and a right axis for Without clicks, with different scales. Similar line heights therefore do not mean the two counts are equal. A crossing of the lines should not be read as the point at which one count exceeded the other.
The series describe query groups. They are not a direct count of visitors or total market searches. The exact aggregation and period-uniqueness rules should be confirmed before summing or reconciling them with another tool.
Example use case
If the no-click query series rises while the with-click series is broadly flat, investigate whether the website is appearing for more relevant searches that have yet to attract clicks. Open Query Row Count Tool to identify pages, then review their actual queries, impressions and positions.
The same pattern could also include irrelevant or very low-volume queries. It is an investigation signal, not automatic evidence of strong growth or poor content.
Practical limits
Check whether the latest period is complete. A partially populated month can look lower than a full month. This screen's reviewed controls included Export, grouping, zoom, fullscreen and chart download; a separate date picker was not visible in the inspected state.
Use a detailed report when you need exact row-level evidence for an action. Do not build a content brief from the chart alone.
More in Data Tools
Query Row Count Tool: compare query coverage across pages
Find pages with broad query coverage and identify where exposure is not producing clicks.
ReadURL Query Count Tool: track a page’s query coverage over time
Inspect a page’s query counts, position bands and traffic trends.
ReadURL Query Intent Tool: understand the intent behind a page’s queries
Review how query intent categories change alongside clicks and impressions.
ReadQuery Discovery Tool: explore search phrases and intent opportunities
Use the query explorer to review intent segments and shortlist relevant searches.
Read