Search Console Data: analyse queries, pages and search traffic
Filter Google Search Console data, inspect individual pages and turn search performance into practical SEO actions.
Search Console Data is your workspace for investigating how people find your website in Google Search. It brings together a performance chart, headline metrics and tables grouped by query, page, country, device, date or search appearance.
Use it to understand which searches generate clicks, which pages receive exposure, and where further investigation could lead to useful improvements.
Open the report
- Check the selected website in the sidebar.
- Expand SEO Workspace.
- Select Search Console Data.
- Choose your date range using the button above the metric cards.
- Wait for the cards and table to finish loading before recording figures.
Understand the main metrics
| Metric | Meaning | Useful question |
|---|---|---|
| Clicks | Clicks from Google Search to the reporting scope. | Are more searchers reaching the website or page? |
| Impressions | Recorded appearances in Google search results. | Is relevant search exposure growing? |
| CTR | Clicks divided by impressions, expressed as a percentage. | How often does exposure result in a click? |
| Average Position | Average search-result position across the measured scope. | Which queries need closer examination? |
Read the metrics together. A higher impression count with little click growth may warrant a query-level investigation, but it does not establish the cause. Position is an average, not a fixed ranking for every user. Google's metric definitions explain the underlying measures.
Change the table dimension
| Tab | Use it to examine |
|---|---|
| Queries | The search phrases associated with your performance. |
| Pages | The URLs receiving clicks and impressions. |
| Countries | Performance by searcher country. |
| Devices | Performance by device category. |
| Dates | Performance by date. |
| Search Appearance | The search appearance categories available in the data. |
Use sortable column headings to change the order. The pagination controls and Rows per page determine how much of the table is visible.
Column Filter shows or hides columns. It does not apply a numerical threshold to the results. For the Queries table, the observed choices were Query, Clicks, Impressions, CTR, Position, Last Click Date and Click Share.
Last Click Date shows the date reported for the row's most recent click. It is not a crawl date. Click Share is the share displayed by SEO Stack; do not assume its denominator is the headline total or the current filtered total without checking the scope.
Filter a group of queries
- Select Add Filters → Query....
- Choose a Match type.
- For a simple required condition, leave Operator on Must.
- Check Case-sensitive. It was enabled in the reviewed dialog.
- Enter the phrase in Query text.
- Select Apply and wait for the results to update.
The available match types were Containing, Not Containing, Exact, Regex, Starts With, Doesn't Start With, Ends With and Doesn't End With. The dialog also exposes Should and Bulk controls. More complex combinations should be checked against the returned rows before using them in reporting.
For an initial topic review, Containing is usually easier to validate than a complex regular expression. Use a phrase that appears in the searches you want to examine. Check sample rows to make sure the segment matches your intent.
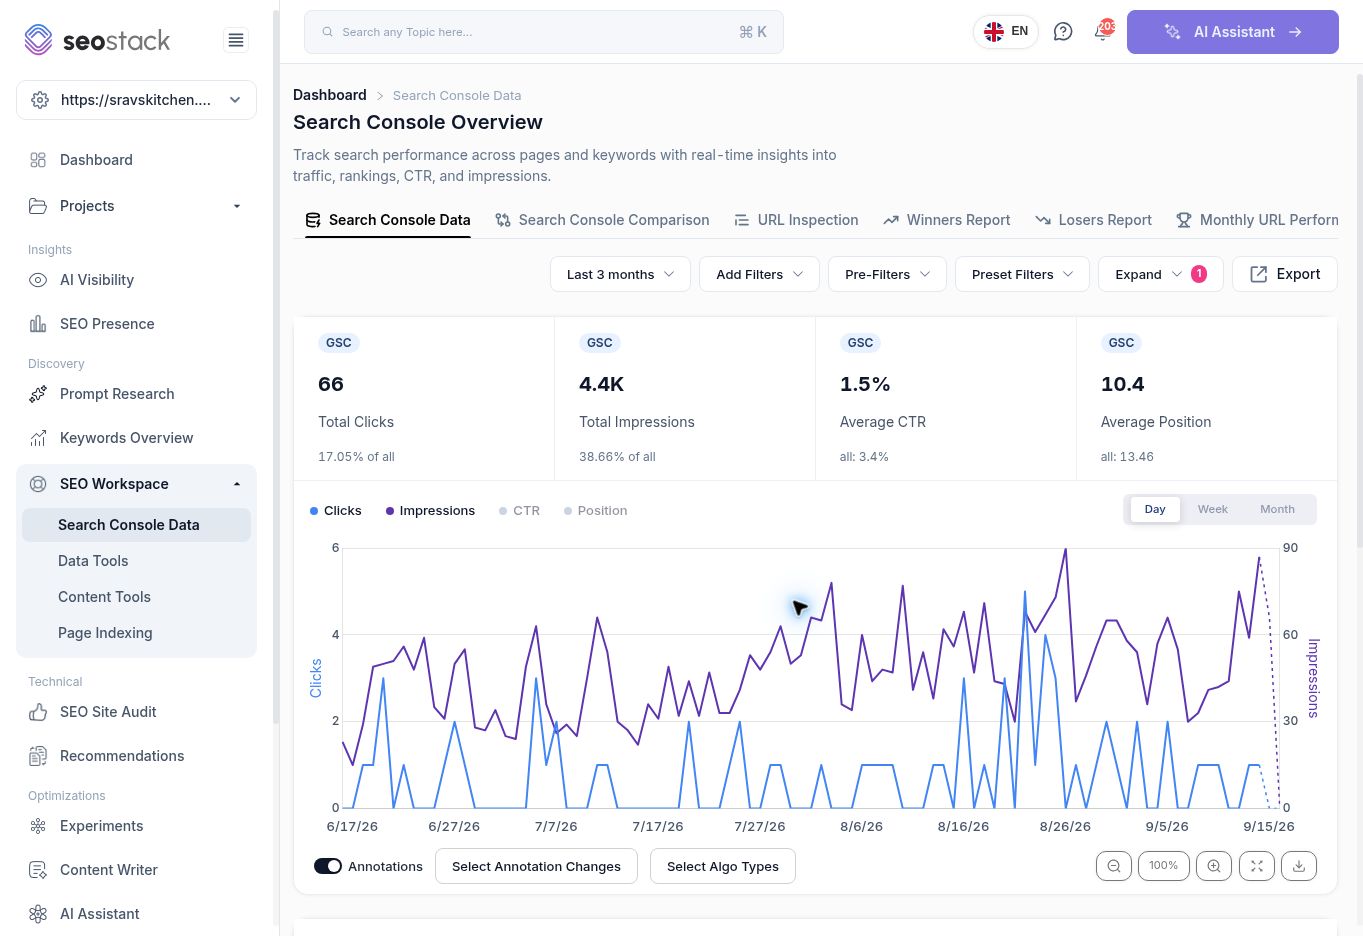 Search Console Data after applying a query segment.
Example: examine local-intent searches
For the restaurant website reviewed, a Query filter containing near me returned 66 clicks, approximately 4.4K impressions, 1.5% CTR and 10.4 average position for the selected three-month period.
That segment lets you investigate local discovery separately from people already searching for the restaurant's name. The row kerala restaurants near me showed 11 clicks from 424 impressions. Review its landing page, relevance and search context before choosing an optimisation.
The filtered cards also display contextual values such as % of all. Preserve the report's scope when quoting these figures; do not substitute the unfiltered headline total as the denominator.
Manage active filters
The Expand button displays a count when filters are active. Open it to see the active filter group and condition. The tested query filter appeared as Queries → Containing: near me. Use Clear in the group to remove it.
Always check active filters before starting a different investigation. Otherwise, a new report may describe only a narrow segment of the website.
Add Filters also offers Page..., Country... and Device.... These let you narrow the reporting scope beyond a query phrase. Verify the applied conditions before interpreting the result.
Analyse one page and its queries
- Remove filters you no longer need.
- Select Pages.
- Find the URL you want to investigate.
- Click its page label to apply the page filter.
- Select Queries.
- Allow the table to refresh, then review the searches associated with that page.
The Relative switch in the Pages table controls the displayed URL form. A relative label such as /menu/ refers to a path on the selected website.
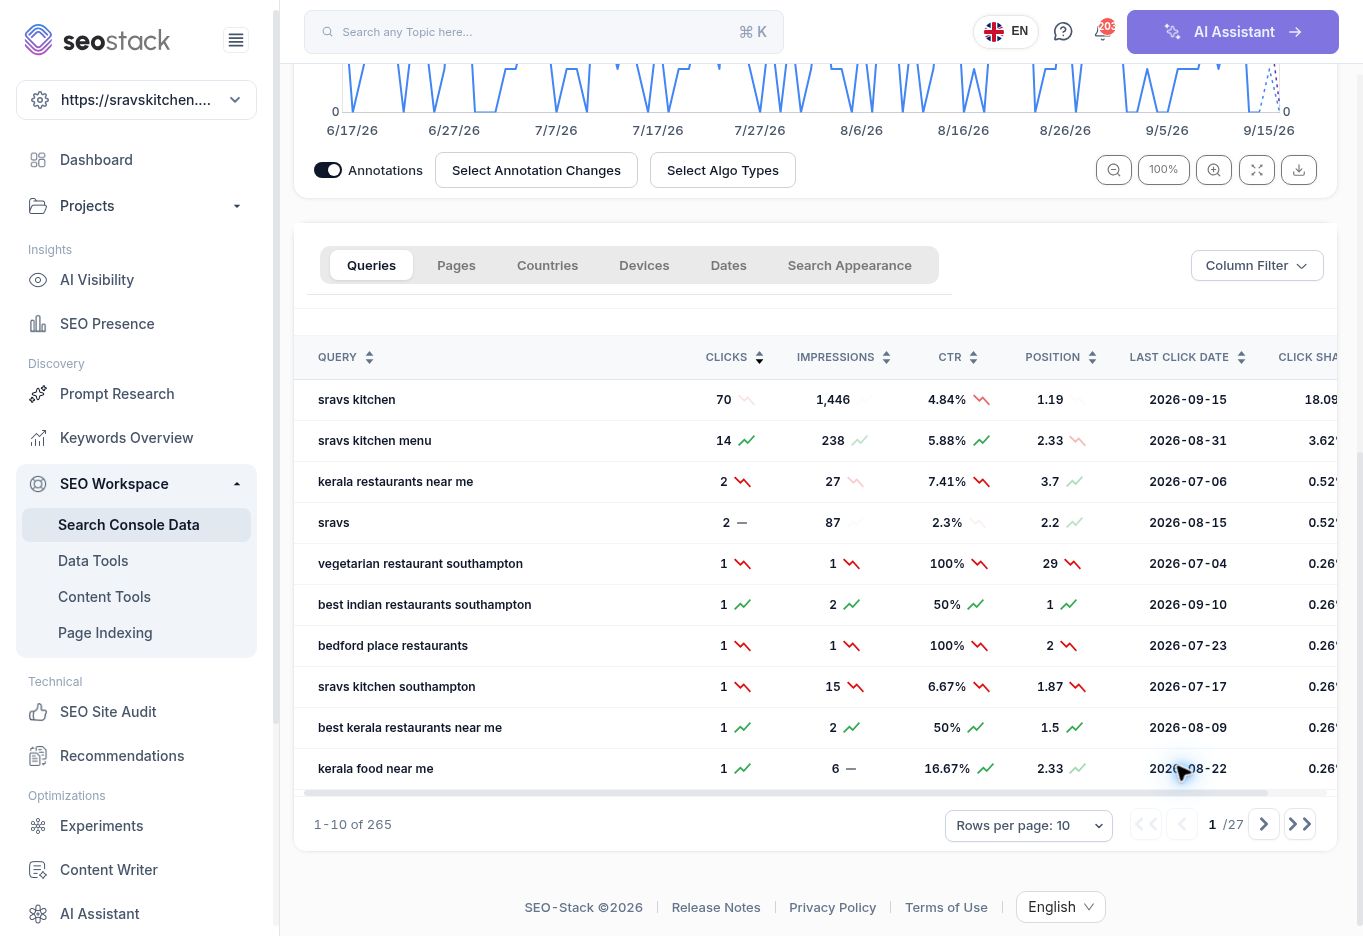 Queries returned after selecting the menu page.
Example: decide whether a menu page needs work
In the reviewed three-month report, /menu/ received 131 clicks, 3,644 impressions, 3.59% CTR and 4.67 average position. After opening that page and switching to Queries, sravs kitchen showed 70 clicks and sravs kitchen menu showed 14.
This gives you a starting point for separating branded demand from broader discovery. Read beyond the top rows before deciding whether to improve menu information, strengthen internal links or investigate another query group. A good aggregate position can hide weaker performance for particular searches.
Pre-Filters and Preset Filters
Pre-Filters offers ready-made segments: URLs with or without a trailing slash, WWW or non-WWW URLs, subdomains, and informational, navigational, transactional or commercial queries.
Use URL-format segments to investigate which variants appear in performance data. Use intent segments as a starting point, then read the matching queries. A classification does not replace your judgement about what a searcher wants.
Preset Filters opens the saved-filter interface, including a search field, New Group, + New Preset Filter and an AI Generated Filters (read-only) group. Saving and editing presets are not covered by this walkthrough.
Read the chart
Use Day, Week or Month to choose the chart's time grouping. A broader grouping can help you see patterns on a noisy daily chart. Check the same date range and filters when comparing views.
The chart exposes an Annotations switch, Select Annotation Changes, Select Algo Types, zoom controls, fullscreen and Download Chart as Image. An annotation or algorithm marker is context for investigation, not evidence that the event caused a change.
Common interpretation mistakes
- Do not treat GSC clicks as sessions, enquiries or sales.
- Do not interpret a good average position as proof that all important queries rank well.
- Do not assume the visible first page of rows represents the complete dataset.
- Do not treat an empty HTTP or index-status field as proof of an indexing problem. The Pages tab states that inspection data is updated gradually because of Google's URL Inspection limits.
- Do not expect every table total to match the chart. Google documents differences between property-level and page-level aggregation in its Performance report guidance.
If the results look wrong
Check the website, dates, active filters and selected dimension first. Wait for loading to complete. If a segment is empty, remove one condition at a time and inspect the matching rules, including case sensitivity. If a data-source connection or refresh appears incomplete, resolve that before drawing a performance conclusion.
For changes between periods, open Search Console Comparison. For an initial shortlist of gains or declines, use Winners Report or Losers Report.
More in Search Console
Search Console Comparison: find what changed between two periods
Compare clicks, impressions, CTR and position across queries and pages, and distinguish absolute changes from percentage changes.
ReadWinners Report: find queries and pages gaining clicks
Identify growing queries and pages, examine their monthly trends and decide which improvements to investigate or extend.
ReadLosers Report: investigate declining queries and pages
Find pages and queries losing clicks, distinguish large losses from small-baseline percentage changes, and build a focused investigation list.
ReadMonthly URL Performance: review page traffic over time
Read the monthly URL matrix to identify sustained gains, declines and pages needing further investigation.
Read