SEO Presence: find performance changes and prioritise opportunities
SEO Presence, headed SEO Insights, brings together organic-search performance, optional GA4 metrics, leading queries, winning/losing URLs and suggested SEO work. Use it as a starting point for a regular performance review before drilling into detailed reports.
Review the report
- Select SEO Presence in the sidebar.
- Check device, date range, country and intent filters. The walkthrough used All devices, Last 30 days, Global and All intents.
- Review Organic Clicks, Impressions and Average CTR and their comparisons with the previous period.
- Read the trend charts and top-performing keywords.
- Switch the high-impact URL table between Winning and Losing.
- Follow the relevant detail link to investigate a query, URL or opportunity.
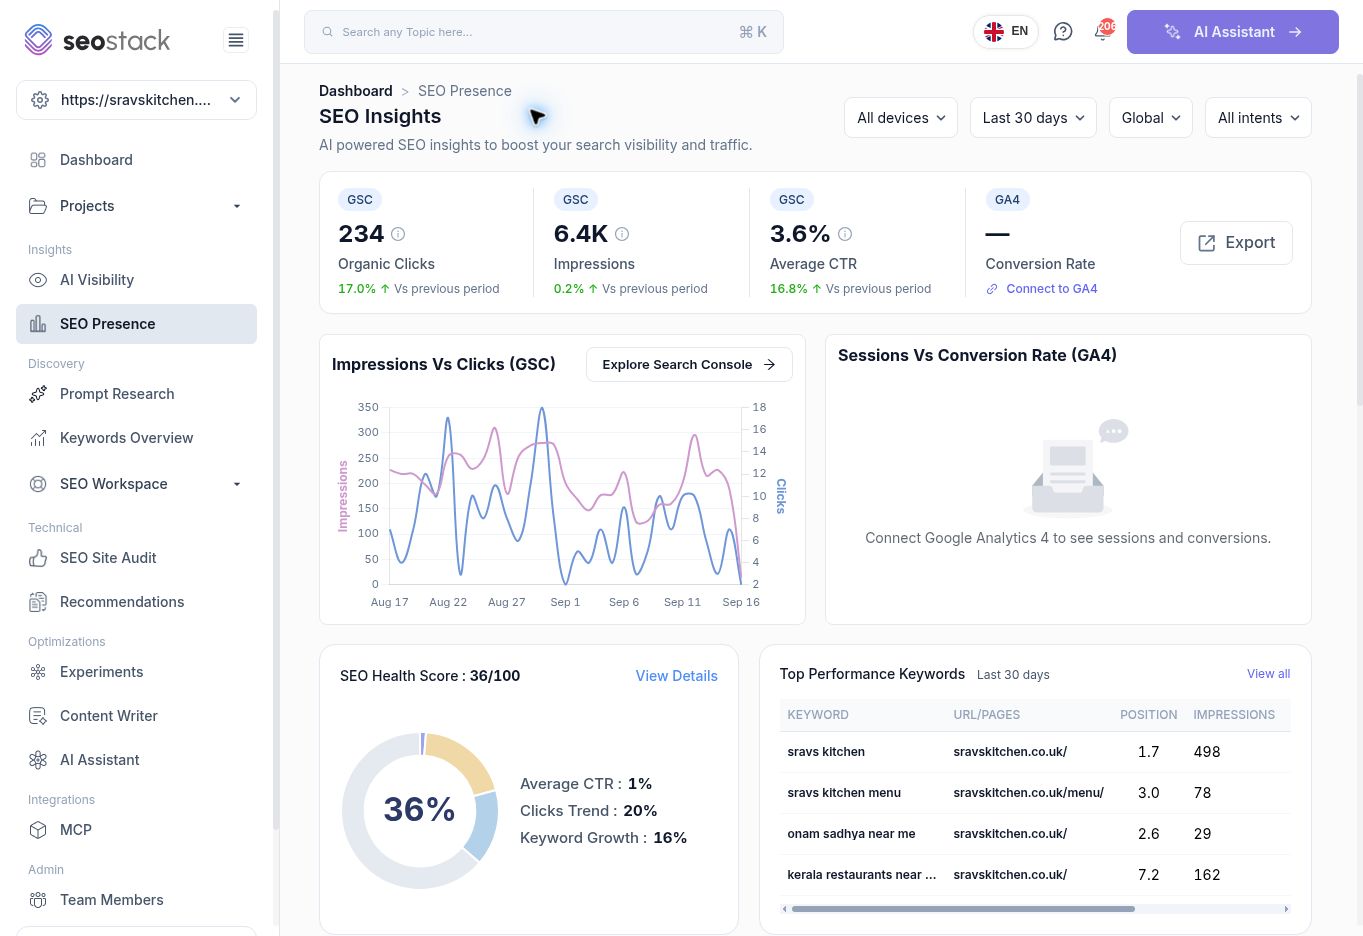 SEO Presence with search-performance metrics and source labels.
Separate data sources
The top cards label search metrics GSC and Conversion Rate GA4. The GA4 chart needs an analytics connection. A dash and Connect to GA4 prompt mean data is unavailable, not that there were no conversions.
The Impressions vs Clicks chart has separate axes, so compare trends using the labels rather than treating line height as an equal numerical scale. Explore Search Console opens the detailed report with date parameters. Confirm the scope after following any link.
Interpret the summary
The example showed 234 clicks, 6.4K impressions and 3.6% CTR, with clicks up 17.0% versus the previous period. A relative CTR increase is different from a percentage-point change: do not describe a 16.8% relative increase as 16.8 percentage points.
The SEO Health Score here showed 36/100 with components labelled Average CTR, Clicks Trend and Keyword Growth. The technical Site Audit showed a different score, 70/100. Do not merge these scores or describe them as the same calculation. The exact SEO Presence score formula needs product confirmation.
Find a page to investigate
Top Performance Keywords lists the keyword, URL, position, impressions, clicks and CTR. View Detail opens query-filtered Search Console Data; View all leads to Keywords Overview.
In the tested Losing view, the booking page had 7 current clicks with a change of -5, while the menu page had 44 with a change of -1. These are good starting points for a closer comparison of impressions, position and CTR. A decline alone does not explain its cause.
Use ranking opportunities
The distribution groups keywords into 0–3, 4–10, 11–20, 21–50 and 51–100 position bands. The example highlighted 162 keywords in positions 11–20 with about 1.1K monthly impressions as Reachable Demand.
That demand is observed impressions in the stated opportunity context, not promised future traffic. Use Analyze Queries to review relevance, the ranking page and the actual query metrics before choosing improvements. Moving every query onto page one is not guaranteed.
Example: plan a focused review
Start with the losing booking URL, then inspect its queries and comparison period in Search Console Data. If impressions are stable but CTR is weaker, review search intent, title and snippet relevance. If visibility also declined, investigate position, query mix and technical status. Record any approved change so a later comparison has a clear date.
The AI SEO Opportunities area also surfaces Lost Visibility, Keyword Cannibalization and Internal Linking. Treat multiple URLs ranking for a query as a possible overlap to investigate, not automatic proof of harmful cannibalisation. A brand query can naturally surface several relevant pages.
Choose relevant internal-link opportunities based on the source page and destination content. Do not add links solely because a keyword appears in the opportunity count.
Troubleshooting
If a metric or opportunity differs from a detail page, check dates, device, country, intent, source and aggregation. Allow loading to finish, and confirm whether a linked report kept the filters. Use the detailed data to validate generated recommendations before assigning work.