Websites and Dashboard: choose a project and review your portfolio
The Dashboard is the account landing page, combining AI Assistant shortcuts, recent conversations, a website table and a portfolio traffic chart. Projects → Websites provides a dedicated portfolio view with Cards and List layouts. Use these screens to choose a website, check its data status and decide which project needs attention.
Review websites
- Open Projects → Websites.
- Choose a reporting period; the walkthrough opened on Last 3 months.
- Use Enter your website to find a property.
- Choose Cards for performance summaries or List for data and connection status.
- Open the website's performance or settings controls to investigate further.
Cards provide View Website, Favorite, Website Settings, Expand Details and View Performance Breakdown controls. They show clicks, impressions, sessions, conversion rate and previous-period changes for queries, position, clicks and impressions. The GSC Data and GA4 Data controls allow you to choose the data categories shown.
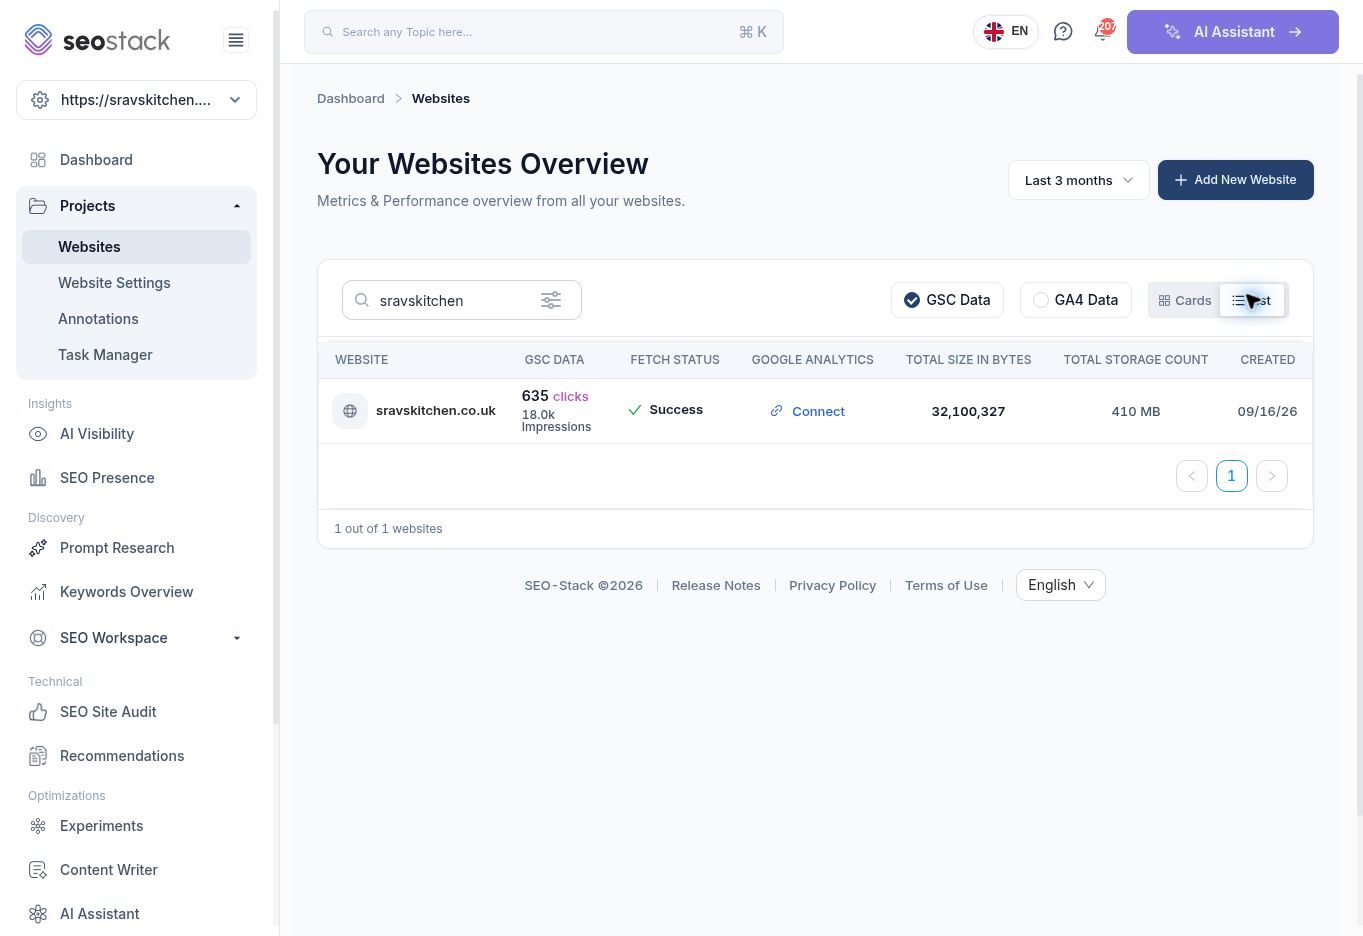 Websites filtered to one property in List view.
List view includes GSC Data, Fetch Status, Google Analytics, storage-related columns and Created. The example displayed Success for the Search Console fetch and Connect for Google Analytics. These describe separate connections: successful Search Console data does not establish that GA4 is connected.
Websites filtered to one property in List view.
List view includes GSC Data, Fetch Status, Google Analytics, storage-related columns and Created. The example displayed Success for the Search Console fetch and Connect for Google Analytics. These describe separate connections: successful Search Console data does not establish that GA4 is connected.
The two storage columns had inconsistent units in staging. Avoid converting them into usage, billing or data-volume claims until their meanings are confirmed.
Interpret the portfolio metrics
Compare websites using the same reporting window and data source. More clicks on one site do not automatically mean it performs better relative to its market, size or commercial goals. A lower average-position number normally represents a better search position, so interpret a negative position change differently from a negative click change.
The example card showed 635 clicks and about 18,000 impressions for Last 3 months, with clicks down 26.9% against the previous period. That warrants investigation in the comparison and Losers reports; it does not explain the cause.
A dash for sessions or conversion rate is not zero. Check the GA4 connection and data availability. Do not equate Search Console clicks with Analytics sessions.
Use the Dashboard
Open Dashboard to access Ask AI, analysis categories, recent chat history and the website overview table. The table includes clicks, impressions, CTR, position, queries, fetch status and Google Analytics controls. Its portfolio chart showed annual comparison series in the walkthrough.
The Dashboard website totals differed from the Websites page's Last 3 months totals, and the table's reporting window was not explicit. Do not quote those totals side by side as contradictory measurements without checking their scope. For a report requiring exact dates, open Search Console Data and set the window there.
Add a website or connect Analytics
Add New Website is available from Dashboard, Websites and Website Settings. In the staging walkthrough it redirected to Google account authentication. That separate sign-in flow was not completed. The subsequent property selection, permissions, import timing and success states therefore require verification before publishing a complete onboarding tutorial.
Connect is shown against websites without GA4. Connection and disconnection were not performed during documentation. Use the intended Google account and property when completing a connection, then verify that the expected website data appears.
Example: weekly portfolio triage
Review comparable dates in Websites, find a property with a meaningful click decline, open its performance breakdown and investigate affected pages and queries. Check fetch status before interpreting missing data. Record a specific follow-up in Task Manager once the issue is verified.
More in Getting started
Website Overview: review your SEO and AI visibility performance
Use Website Overview to review search performance, AI visibility and SEO health, then choose the right report for your next action.
ReadWhat is SEO Stack?
What the platform does, what it sits on top of, and what it is not.
ReadHow data warehousing works
Why Google's 16-month window exists, and what SEO Stack does about it.
Read