Top Level Query Trajectory: compare query coverage across URLs
Compare page-level query trends and identify where to investigate changes in search coverage.
Top Level Query Trajectory compares reported query coverage across URLs over time. It combines a chart with a page table and a compact trajectory indicator.
Use it to identify pages gaining or losing query coverage, compare the direction of change across key URLs and choose pages for deeper investigation.
How to use it
- Open SEO Workspace → Data Tools → Top Level Query Trajectory.
- Select the date range and check active filters.
- Choose Day, Week or Month for the chart.
- Read the page rows and the period columns beneath the chart.
- Use the Relative switch to control how page addresses are displayed.
- Investigate a selected URL in URL Query Count Tool and Search Console Data.
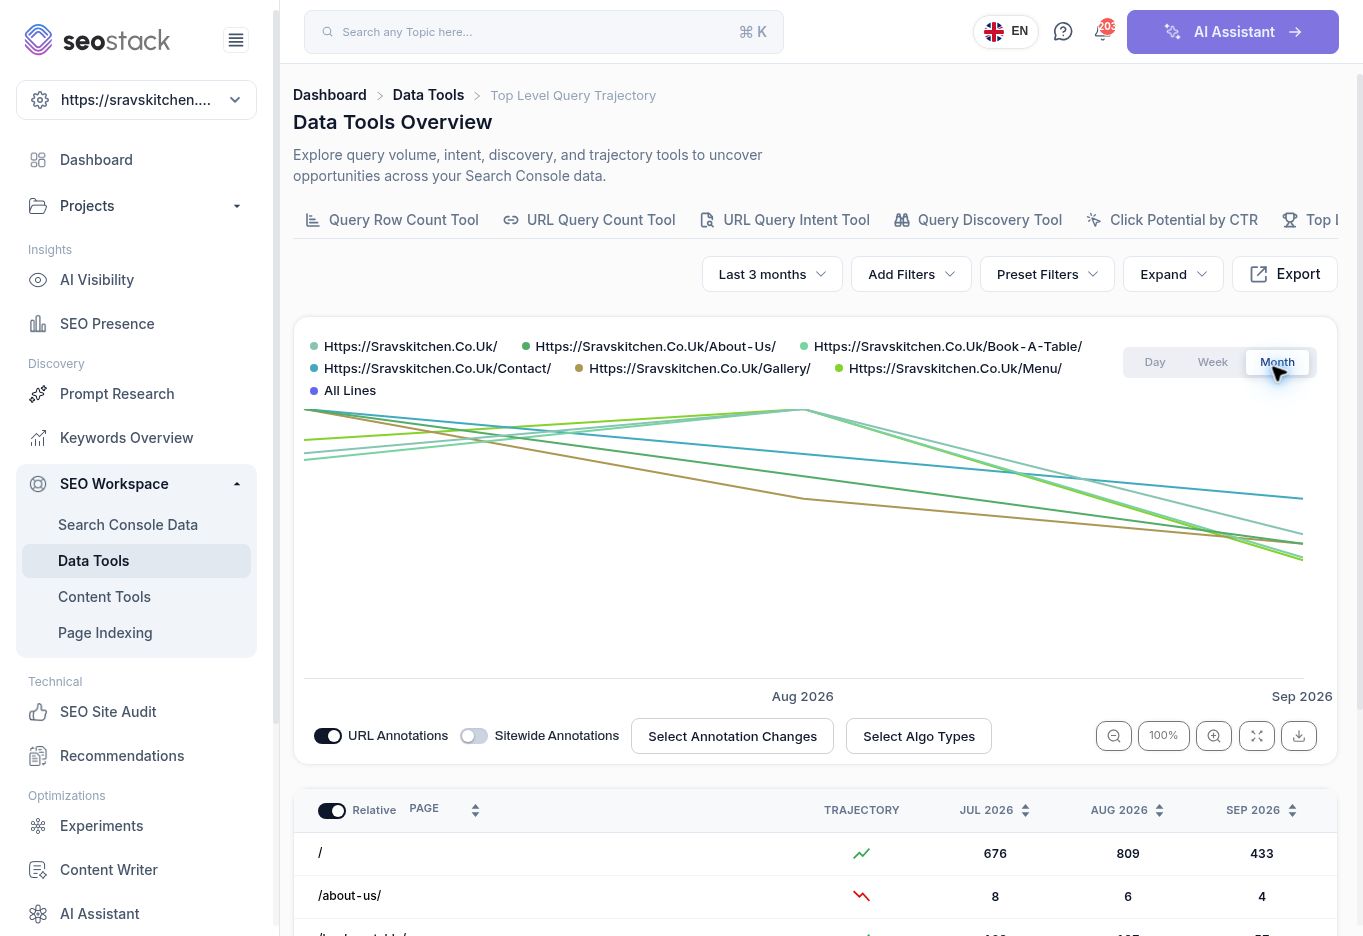 Top Level Query Trajectory with its monthly page table.
Read the numbers before the trend indicator
The reviewed table showed these July-to-August changes:
| Page | July | August | Difference |
|---|---|---|---|
| Homepage | 676 | 809 | +133 |
| Menu | 123 | 139 | +16 |
| Book a table | 103 | 127 | +24 |
| Contact | 6 | 5 | -1 |
These are query-coverage figures, not clicks. An increase suggests a broader observed query footprint, but it does not establish that traffic, enquiries or revenue increased.
The trajectory indicator is a quick visual cue. Its precise calculation was not exposed during the walkthrough, so use the period values for a statement about the magnitude of change. Do not assume line heights share a directly comparable scale without checking the chart values.
Example: prioritise investigation after an update
If a booking page gains query coverage, inspect whether the additional queries are relevant to bookings. Review their impressions, clicks and positions. Keep the reporting scope consistent and compare complete periods before attributing the result to a page update.
The September figures were lower during a 16 September review. September was incomplete, so that alone did not establish a month-on-month decline.
Reporting and troubleshooting
The toolbar provides Add Filters, Preset Filters, Expand and Export. Annotation, algorithm-marker and chart controls add context but do not establish causation.
If a page seems to disappear or change sharply, first check dates, filters and loading state. Query coverage can vary by period. Avoid summing the monthly counts as if they represented entirely different queries.
More in Data Tools
Query Row Count Tool: compare query coverage across pages
Find pages with broad query coverage and identify where exposure is not producing clicks.
ReadURL Query Count Tool: track a page’s query coverage over time
Inspect a page’s query counts, position bands and traffic trends.
ReadURL Query Intent Tool: understand the intent behind a page’s queries
Review how query intent categories change alongside clicks and impressions.
ReadQuery Discovery Tool: explore search phrases and intent opportunities
Use the query explorer to review intent segments and shortlist relevant searches.
Read