URL Query Count Tool: track a page’s query coverage over time
Inspect a page’s query counts, position bands and traffic trends.
URL Query Count Tool helps you examine how a page's reported query coverage changes over time, alongside its clicks and impressions. Use it to investigate whether a page is gaining search exposure and whether that exposure is translating into useful traffic.
Open a page-specific report
- Open SEO Workspace → Data Tools → Query Row Count Tool.
- Find the page and select View in Query Count Over Time.
- Check the active page filter under Expand and the date range.
- Select Day, Week or Month.
- Review the chart, query table and the period-by-period data table.
The horizontal navigation also has a direct URL Query Count Tool entry. Confirm the page scope rather than assuming it carries over from another screen.
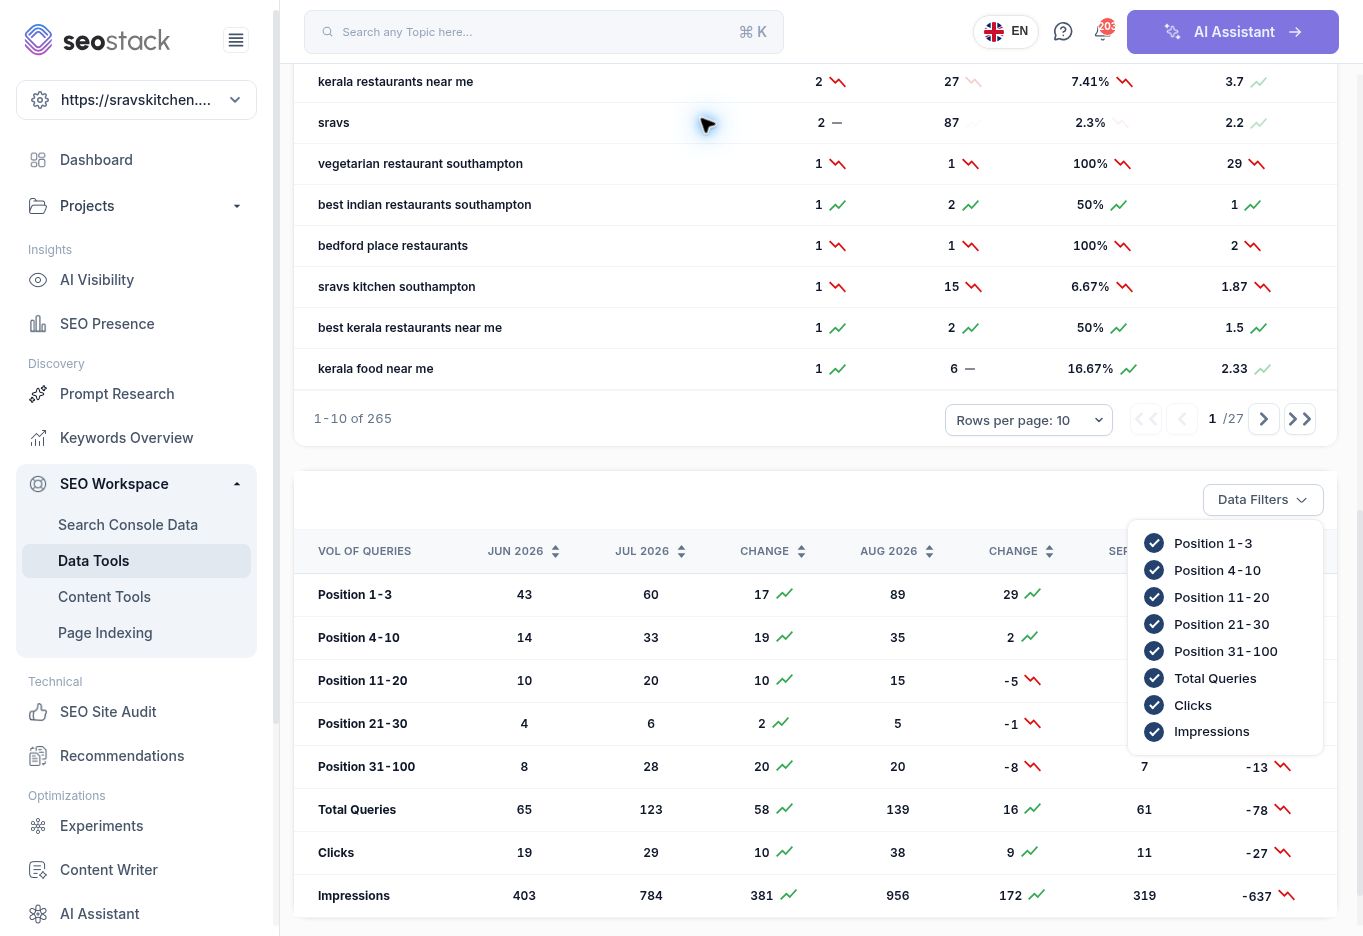 URL Query Count monthly data table with Data Filters open.
Read the position bands and trends
The chart and data controls expose Position 1–3, 4–10, 11–20, 21–30, 31–100, Total Queries, Clicks and Impressions. The lower table includes counts and Change columns between periods.
Use Data Filters to control which series appear in that table. Review total coverage together with the position bands: more queries in weaker positions can increase exposure without immediately generating many clicks.
The query table shows the search phrase, clicks, impressions, CTR and average position. It provides context for the aggregate trend. The same query can recur over multiple periods, so do not sum period query counts and call the result a distinct all-time query total.
Example: review a page after a content update
For the reviewed menu page, monthly Total Queries increased from 123 in July to 139 in August. That is a reason to examine whether the additional queries are relevant and whether clicks also improved.
Check the query rows and compare a consistent date range. A rising count alone does not prove an update succeeded: the new queries could have little business relevance or very low impressions. A partial September count should not be compared with a full August without accounting for the different coverage.
Annotations and reporting controls
The screen provides separate URL Annotations and Sitewide Annotations switches, annotation-type and algorithm-type selectors, Create Annotation, View in Google Search Console, exports and chart display controls.
Use annotations to record context for analysis. A coinciding increase is not proof of causation. Check actual period values rather than comparing differently scaled chart lines by height.
Troubleshooting
If you reach the page from another report, recheck its dates: the tested drill-down used a different default period. If the chart is noisy, switch to Week or Month. If a count differs from another tool, check period boundaries, active page filters and whether the tools use the same definition of query count before calling it an error.
More in Data Tools
Query Row Count Tool: compare query coverage across pages
Find pages with broad query coverage and identify where exposure is not producing clicks.
ReadURL Query Intent Tool: understand the intent behind a page’s queries
Review how query intent categories change alongside clicks and impressions.
ReadQuery Discovery Tool: explore search phrases and intent opportunities
Use the query explorer to review intent segments and shortlist relevant searches.
ReadClick Potential by CTR: model clicks at different click-through rates
Estimate click scenarios using observed impressions and fixed CTR assumptions.
Read