Losers Report: investigate declining queries and pages
Find pages and queries losing clicks, distinguish large losses from small-baseline percentage changes, and build a focused investigation list.
Losers Report highlights queries and pages with fewer clicks in the selected comparison. It helps you identify where to investigate traffic losses and prioritise work according to the actual loss and the page's business value.
The interface uses Queries Decaying and Pages Decaying. These are reporting labels for declining segments. A decline does not, on its own, prove the content is outdated or needs rewriting.
Open and use the report
- Open SEO Workspace → Search Console Data → Losers Report.
- Check the comparison dates.
- Choose Queries Decaying or Pages Decaying.
- Examine current clicks, previous clicks and Click Change.
- Review Click Change %, the monthly history and Click Trend for context.
- Narrow the report with Add Filters if you need a particular part of the website.
- Investigate the most important rows in Search Console Data or Search Console Comparison.
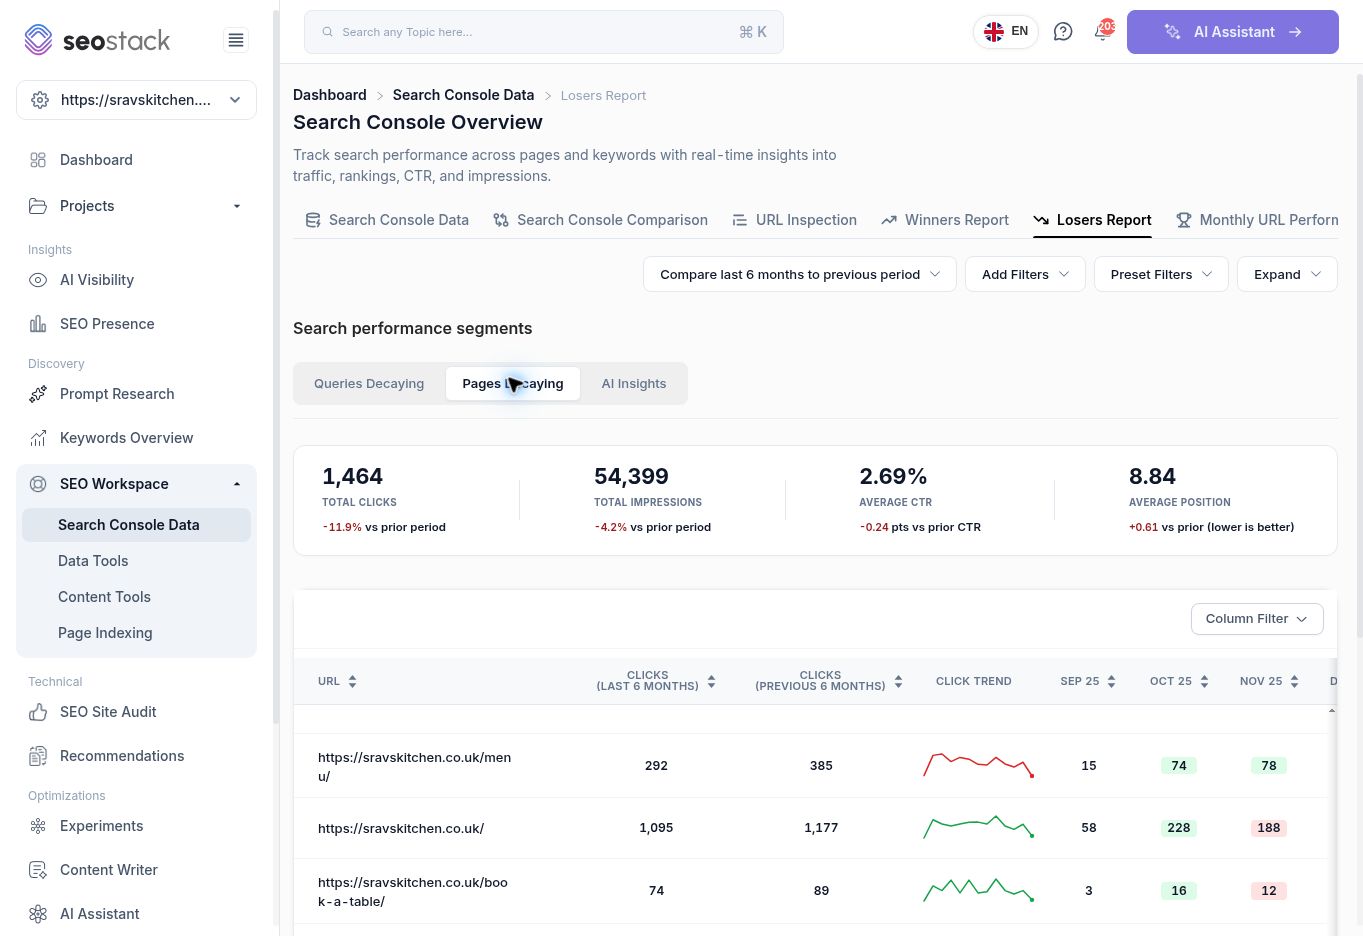 Losers Report with Pages Decaying selected.
What the metrics tell you
The cards summarise the selected declining segment, not necessarily the website as a whole. They display Total Clicks, Total Impressions, Average CTR and Average Position with comparisons.
The table shows both periods' click counts, monthly clicks, a trend line, absolute and percentage click changes, impressions, CTR, position and position change. Use Column Filter or horizontal scrolling to inspect the full table.
For detailed position interpretation, check the two raw period values in Search Console Comparison. Do not assume the sign of every “Position Change” field is calculated in the same direction across tools.
Example: prioritise by traffic loss and purpose
The reviewed six-month page comparison showed:
| Page | Current clicks | Previous clicks | Lost clicks | Reported change |
|---|---|---|---|---|
| Menu | 292 | 385 | 93 | -24.2% |
| Homepage | 1,095 | 1,177 | 82 | -7.0% |
| Book a table | 74 | 89 | 15 | -16.9% |
| About us | 3 | 11 | 8 | -72.7% |
The About us page has the largest percentage decline, but the menu page lost far more clicks. The booking page may also deserve attention because it supports a commercial action. Combine traffic impact with business relevance when assigning investigation work.
Investigate a declining page
- Record the URL, dates, current clicks and previous clicks.
- Open Search Console Comparison for the same periods and page.
- Check whether impressions, CTR or average position changed.
- Open the page's queries in Search Console Data.
- Determine whether the loss is concentrated in branded, non-branded, seasonal or specific topic queries.
- Review relevant site changes and the current page before choosing a fix.
- Record the action and monitor a comparable period after implementation.
Fewer impressions can be consistent with reduced demand or reduced exposure. Falling CTR with similar impressions warrants investigation of query mix and search-result context. Worse positions may warrant reviewing relevance, competitors or technical changes. These are hypotheses to test, not diagnoses produced by the report.
Read the monthly trend carefully
A rolling six-month loss may coexist with a recovery in the most recent complete month. The month columns help you distinguish a sustained decline from an isolated event. An unfinished month contains fewer days, so avoid treating its lower count as a confirmed collapse.
AI Insights and limitations
The report includes AI Insights and a Generate AI insights for this report control. Verify any proposed causes or actions against the actual rows. Labels such as Content Decay are prioritisation aids, not proof of a particular cause.
An empty segment does not prove every page is healthy. Check dates, filters and available data. Likewise, losing a few clicks from a small baseline can create a large percentage decrease. Preserve absolute counts in reporting.
Use Monthly URL Performance for a wider view of page trends, including growing and unchanged URLs.
More in Search Console
Search Console Data: analyse queries, pages and search traffic
Filter Google Search Console data, inspect individual pages and turn search performance into practical SEO actions.
ReadSearch Console Comparison: find what changed between two periods
Compare clicks, impressions, CTR and position across queries and pages, and distinguish absolute changes from percentage changes.
ReadWinners Report: find queries and pages gaining clicks
Identify growing queries and pages, examine their monthly trends and decide which improvements to investigate or extend.
ReadMonthly URL Performance: review page traffic over time
Read the monthly URL matrix to identify sustained gains, declines and pages needing further investigation.
Read