Website Overview: review your SEO and AI visibility performance
Use Website Overview to review search performance, AI visibility and SEO health, then choose the right report for your next action.
Website Overview brings your selected website's search performance, organic sessions, AI visibility and SEO health into one place. Use it to check performance and decide where to investigate next.
The overview combines several data sources. Read each card in its own context: a Google Search Console click, a Google Analytics session and a brand mention in an AI response measure different things.
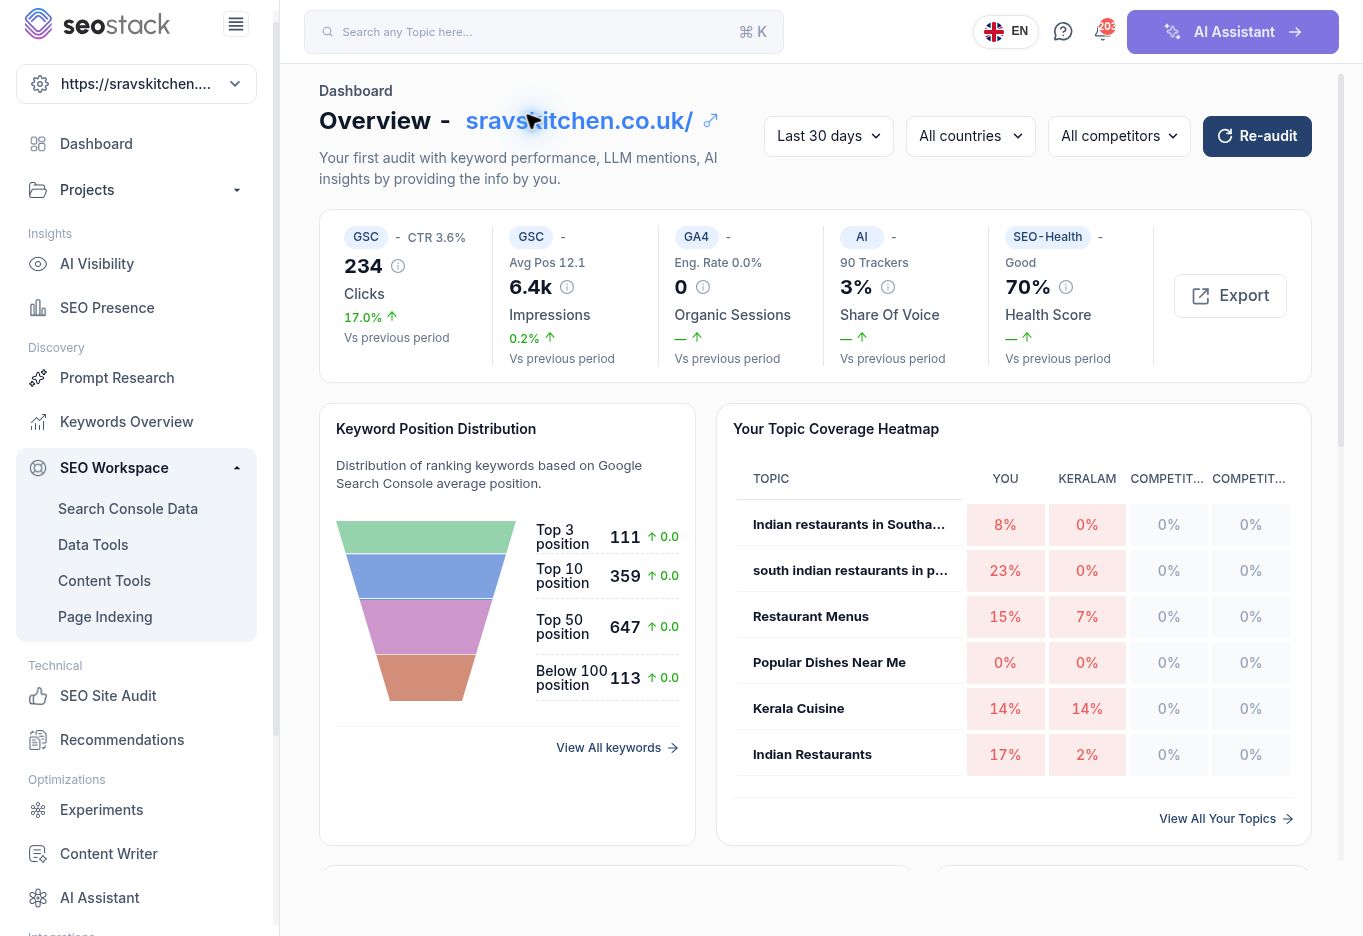 Website Overview showing filters, performance cards, keyword distribution and topic coverage.
What can you use it for?
- Run a regular performance check before opening detailed reports.
- Spot pages that have lost search clicks.
- Review the relationship between search exposure and clicks.
- Identify topics to investigate in AI Visibility.
- Check the headline SEO health score and open the underlying audit.
- Decide which issues deserve further analysis before assigning work.
Open Website Overview
- Select Dashboard in the sidebar.
- Find the website in Your websites Overview. Use the table search or pagination if needed.
- Click the website address. This opens its Website Overview.
- Check the website name in the page heading before interpreting the figures.
The account Dashboard lists multiple websites. Website Overview focuses on one website. Figures on these two screens should only be compared once their reporting scope and dates match.
Choose your reporting scope
Use Date range at the top of the overview. The observed options were Yesterday, Last 7 days, Last week, Last 30 days, This month, Last 3 months, Last 6 months and Last 1 Year.
Select a period and allow the metrics to finish loading. A short period is useful for recent changes; a longer period gives more context when a site receives few clicks.
The page also provides Country and Competitor selectors. Start with All countries and All competitors for a broad review. Check the displayed selection whenever you capture figures for a report. Do not assume a filter applies identically to every data source on the page.
Read the performance cards
| Card or metric | What it tells you | How to use it |
|---|---|---|
| Clicks, labelled GSC | Clicks to your pages from Google search results in the selected period. | Check whether search traffic is growing, then inspect the pages and queries behind changes. |
| Impressions, labelled GSC | How often your pages appeared in Google search results. | Assess changes in search exposure alongside clicks. |
| CTR | The proportion of impressions that resulted in clicks. | Review it alongside query intent and position. A low CTR alone does not establish a title problem. |
| Avg Pos | Google Search Console average position for the reporting scope. | Use detailed query and page reports to understand movements hidden by the average. |
| Organic Sessions, labelled GA4 | Visits attributed to organic search in the connected analytics data. | Review on-site acquisition. Do not expect this to equal GSC clicks. |
| Eng. Rate | Engagement rate shown alongside the GA4 card. | Use it as supporting context and inspect the connected analytics data before drawing conclusions. |
| Share Of Voice, labelled AI | The overview's measure of brand presence relative to competitors in AI answers. | Open AI Visibility to examine the prompts and responses behind the summary. |
| Trackers | The tracker count displayed with the AI card. | Treat it as context for the tracked dataset, not as a count of users or visits. |
| Health Score | SEO Stack's summary of basic SEO setup, including the checks named in the interface. | Open the full audit to identify the underlying checks. It is not a prediction of rankings. |
Vs previous period shows the comparison presented by the interface. Read the percentage together with the absolute total: a large percentage movement can result from only a few clicks. A dash is not a confirmed zero change.
Rounded values such as 6.4k are useful for a quick overview. Use detailed data when you need an exact calculation.
Understand keyword position distribution
Keyword Position Distribution summarises keywords using Google Search Console average position. The overview labels the groups Top 3 position, Top 10 position, Top 50 position and Below 100 position.
Use the distribution to decide whether to investigate stronger or weaker rankings, then select View All keywords to open Keywords Overview.
These are average-position summaries, not a promise that a keyword appears at the same position for every search. Do not add the displayed groups together unless their inclusion rules have been confirmed.
Review topic coverage and AI competitors
Your Topic Coverage Heatmap compares your website with competitors across named topics. Use it to find topics worth examining, then select View All Your Topics to open AI Visibility.
For example, the captured overview showed Restaurant Menus at 15% for the selected website and 7% for a competitor. This is a reason to inspect the underlying topic results. It does not mean the website owns 15% of all searches about restaurant menus.
The AI comparison table displays Visibility, SOV, Sentiment and Avg. Position by brand. These describe AI reporting, so do not compare the table's average position directly with the GSC average-position card. Open View All Your Competitors to investigate further.
If a section is still loading or says topic coverage is syncing, wait for it to finish before recording its figures.
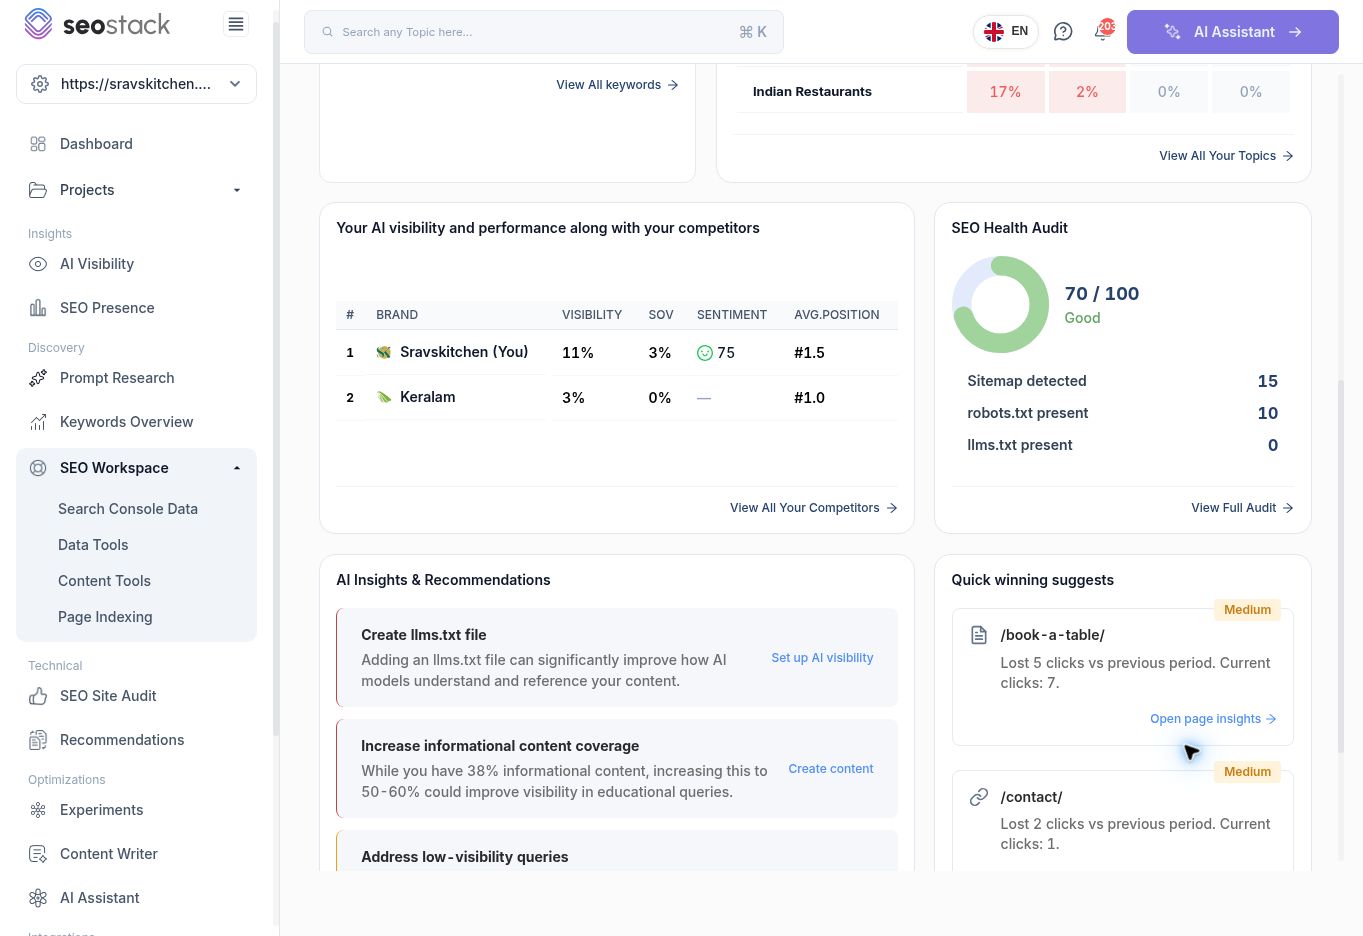 AI competitor summary, SEO health checks and recommendations, with a page-level lost-click suggestion.
Turn the overview into useful actions
Investigate a page losing clicks
- Find Quick winning suggests towards the bottom of the page.
- Read the page address, lost-click figure and current clicks.
- Select Open page insights for the relevant page.
- Check the resulting report's page and dates before analysing it.
- Investigate which queries changed and whether impressions, CTR or position help explain the difference.
- Choose an action only after identifying the likely cause.
In the captured example, /book-a-table/ had lost 5 clicks and received 7 clicks in the selected period. Those figures imply 12 clicks in the comparison period. The absolute loss is small, but a booking page may still deserve attention because of its commercial role.
A lost-click suggestion is an investigation starting point. It does not prove that the page needs rewriting or that a particular change will recover the clicks.
Review increased traffic
The captured overview showed 234 clicks, up 17.0%, while impressions rose 0.2%. This suggests clicks improved more than overall exposure during that comparison. Investigate the query and page mix before attributing the improvement to a specific SEO change.
Decide whether to create more content
Start with a topic that matters to your customers and shows weak coverage. Open the AI Visibility results and examine which prompts lack mentions. Check whether an existing page already answers the need before commissioning another page. Choose a useful content update or new page based on that evidence.
Review SEO health
Select View Full Audit under SEO Health Audit. Use the detailed checks to establish what needs fixing. The overview's score is a triage aid; a score of 70/100 does not mean 30% of pages are broken.
Use recommendations as investigation prompts
AI Insights & Recommendations provides suggested next steps and links to relevant tools. Read the supporting data before acting. A recommendation to change content coverage or add a file should be evaluated against your website's needs; it is not a guaranteed ranking or AI-visibility improvement.
Troubleshooting
| What you see | What to check |
|---|---|
| Organic Sessions is zero but GSC clicks are present | Check whether GA4 is connected to the correct website and whether data is available for the period. The reviewed website had a Connect option in the Dashboard's Google Analytics column. |
| The numbers change shortly after opening the page | Wait for loading and syncing to complete before recording results. |
| AI figures stay the same when the date changes | Open AI Visibility and check its reporting scope and available history. Do not assume every overview section uses the same refresh or filtering behaviour. |
| A percentage looks dramatic on a small website | Check the absolute clicks and compare a longer period. |
| A competitor column has a generic name or no useful data | Review the configured competitor set and its available reporting data. |
Next reports to open
| Question | Where to go |
|---|---|
| Which keywords need attention? | View All keywords → Keywords Overview |
| Which topics and prompts need investigation? | View All Your Topics → AI Visibility |
| How do competitors compare in AI answers? | View All Your Competitors → AI Visibility |
| What is behind the health score? | View Full Audit → SEO Site Audit |
| Why did this page lose clicks? | Open page insights → Search Console Data |
The overview also exposes Export and Re-audit. Their output and processing behaviour are not covered in this article because they were not verified during this walkthrough.