How to use SEO Presence in SEO Stack
Learn about the SEO Presence tool and how to use it.
Search impressions fell 22.6%, yet organic clicks more than doubled. Where did the extra traffic come from, which pages still lost clicks, and which queries deserve attention next? This guide uses a live 28-day report to follow those questions from the summary cards to individual URLs and queries.
Choose the market and period
Select the website in the sidebar, then open Insights → SEO Presence. The page heading reads SEO Insights. Start with All devices, Global and All intents for a sitewide review. Narrow the device, country or search intent when the question calls for it. For example, if you want to investigate mobile search in the UK, select that device and market before reading the keyword rows.
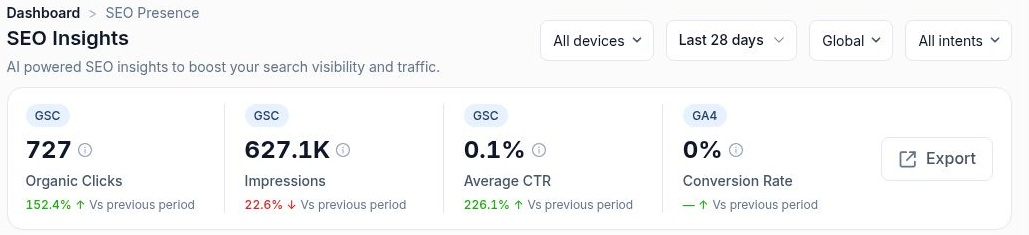
Open the date selector for the last 7 or 28 days, 3, 6, 12 or 16 months, the first available data point, or a custom range. This example uses 21 October–17 November 2026. The headline changes compare that period with the previous one. Use Export to take a snapshot of the report you’re reviewing.
 image
The selectors set the scope of the SEO Insights report. Each card identifies its data source.
Read clicks, impressions and CTR together
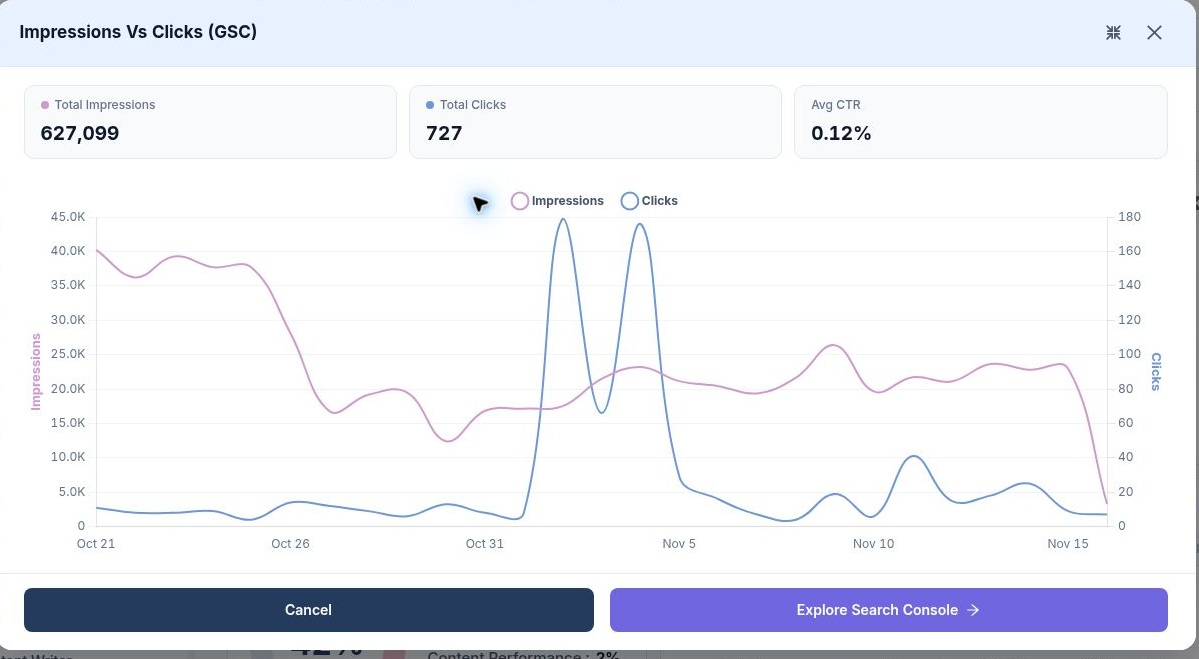
The site received 727 organic clicks, up 152.4%, while impressions fell 22.6% to 627,099. Fewer appearances produced more clicks. Open the expand icon on Impressions Vs Clicks (GSC) to see the daily lines alongside the unrounded impression count. CTR was 0.12% (727 ÷ 627,099), displayed as 0.1% on the summary card. The 226.1% increase beside CTR is a relative change against the previous period.
Use the chart to find when the lines diverged, then select Explore Search Console. The link carried the same dates into Search Console Data. Compare the pages and queries contributing clicks during the spike before attributing it to a ranking gain.
 image
Expanded GSC chart showing the exact totals and the timing of the click spikes.
Check conversions and the health score
Sessions Vs Conversion Rate (GA4) puts visits and conversion rate on the same timeline. Expand the chart to inspect it. In this example the GA4 card showed 0% conversion rate and a dash for the comparison. Check recorded sessions and the project’s conversion measurement in GA4 before drawing a commercial conclusion from the increase in search clicks.
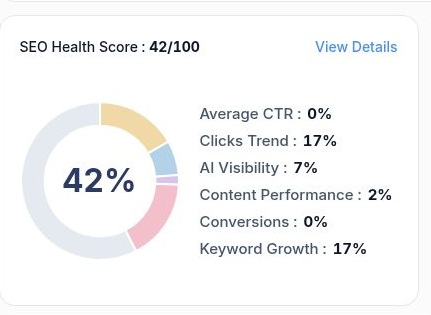
SEO Health Score combines six displayed components. In this snapshot the 42/100 score comprised Clicks Trend 17, Keyword Growth 17, AI Visibility 7, Content Performance 2, Average CTR 0 and Conversions 0, with the displayed components rounded individually. Read these as contributions to this score. For example, the CTR contribution displays 0% while the expanded GSC chart reports an actual CTR of 0.12%. View Details opens Search Console Data.
 image
The health panel shows the overall score and the six component readings.
Find the queries and pages driving performance
Top Performance Keywords pairs each query with its ranking URL, average position, impressions, clicks and CTR. The homepage received 52 clicks from roughly 13,900 impressions for “seo agency” at average position 5.7. The branded query “assertive media” generated 29 clicks from 114 impressions and a 25.4% CTR. Comparing those CTRs without accounting for brand intent would give a misleading impression of the generic query. Use View Detail on the row, or View all for the broader keyword report. Scroll the table horizontally if the action is off-screen.
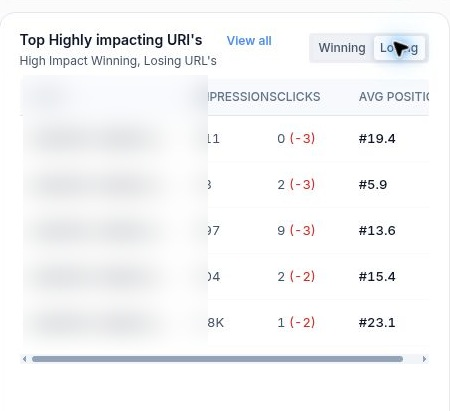
Under Top Highly impacting URI’s, switch between Winning and Losing. Read the current clicks and the change in brackets separately. On Winning, /our-clients/ recorded 119 clicks (+114), up from five. On Losing, the largest drop shown was three clicks. The whole site gained clicks while individual pages lost them. Click a page or open the wider report to investigate the queries behind its change.
 image
The Losing view shows current clicks, the change in brackets and average position.
Investigate queries close to page one
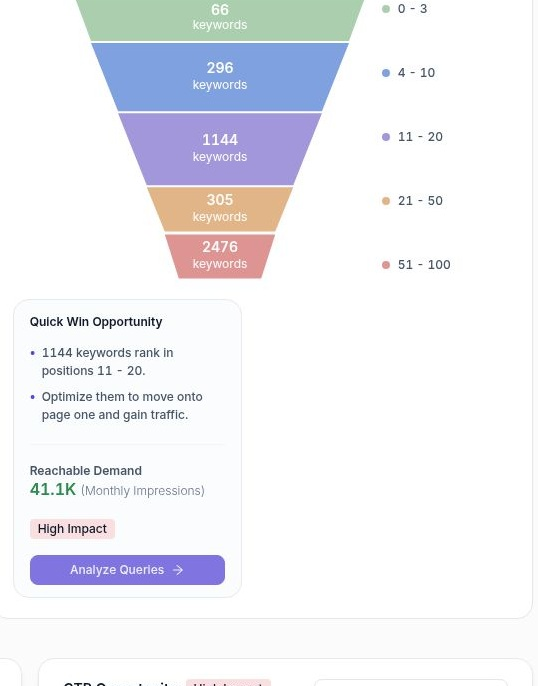
Ranking Opportunities groups queries by average position: 0–3, 4–10, 11–20, 21–50 and 51–100. The Quick Win Opportunity highlighted 1,144 queries and 41.1K monthly impressions. That impression count measures exposure. A click forecast would also need an assumption about achievable rank and CTR.
Select Analyze Queries. Search Console Data opened with 1,144 matching rows. The first results included average positions of 10.11 and 10.14, so use the decimal position in the table when choosing candidates from the band labelled 11–20. Sort by impressions, choose a query that matches the business and inspect its ranking page. A relevant query with 300 impressions merits a different priority from one with seven.
 image
The distribution chart leads to a filtered query list through Analyze Queries.
Choose an SEO opportunity to investigate
| Opportunity | What to do with it |
|---|---|
| Lost Visibility | Choose Review losing pages. Here five pages accounted for 13 lost clicks. Start with the absolute loss, then check position and impressions for the affected queries. |
| CTR Opportunity | Choose Review CTR opportunities to compare actual CTR with the position-based benchmark for each query and its top ranking page. |
| Keyword Cannibalization | Choose Review Keywords. The report flagged 2,377 queries appearing across multiple URLs. Inspect which pages rank, their intent and whether the preferred page is losing clicks before changing internal links or consolidating content. |
| Internal Linking | Choose Review link opportunities. This report paired five pages gaining clicks with 1,144 candidate queries and offered the top 20 by impressions in the detail view. Check that the source page has a relevant passage and that the destination answers the query. |
Work through a CTR opportunity
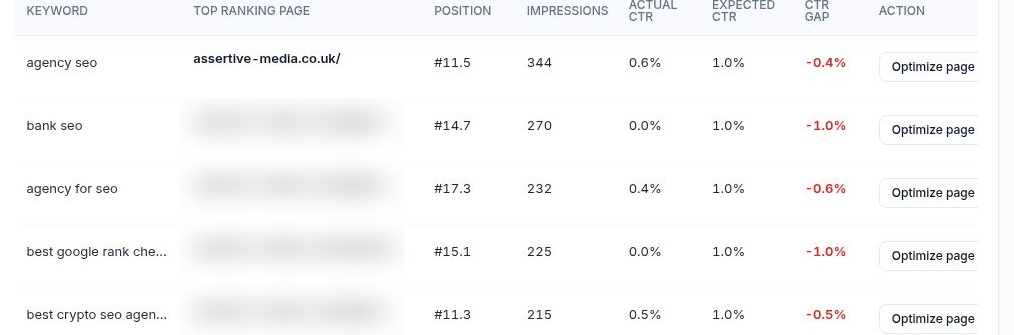
Open Review CTR opportunities and read across one row. “Bank seo services” had 107 impressions, average position 9.6, 0% actual CTR and 2.5% expected CTR. The gap was 2.5 percentage points. At the same impression volume, reaching the benchmark would amount to about three clicks. That gives you a sense of scale before rewriting the page.
Use the Top ranking page and Optimize page controls to investigate the destination. Check whether its title and description clearly communicate banking SEO services, then review the search results for the query. If you make a change, record the date in Annotations. Compare the same query, page, device and market afterwards, and check average position alongside CTR.
 image
More in Getting started
Website Overview: review your SEO and AI visibility performance
Use Website Overview to review search performance, AI visibility and SEO health, then choose the right report for your next action.
ReadWebsites and Dashboard: choose a project and review your portfolio
ReadWhat is SEO Stack?
What the platform does, what it sits on top of, and what it is not.
ReadHow data warehousing works
Why Google's 16-month window exists, and what SEO Stack does about it.
Read