How to use the Dashboard
An overview of the initial website dashboard along with how to use it.
Open Dashboard in the left menu to ask a question about your data, return to an earlier analysis or check performance across your websites.
Ask a question about your data
Check the selected website in the sidebar before asking a site-specific question. Type in Ask about your SEO data and choose Ask AI, or use the microphone to dictate. Give the assistant a metric, a period and the result you want. For example, “Which five pages lost the most Google clicks in October compared with September? Show both click totals and the difference.”
Use GA4 Analysis for on-site behaviour, SEO Analysis for search performance, Reporting for a summary, or Hybrid GSC & GA4 SEO Analysis when you need both sources. View More opens the full assistant, where you can also give it a task.
 image
The Dashboard assistant and its analysis shortcuts.
Reopen a recent chat
Select a conversation under Your Recent Chat history to continue with its earlier context. This is useful when you’ve already found a group of declining pages and want to ask which queries account for the loss. Use the three-dot control for that conversation’s options, or See More Chats to find an older investigation.
 image
Recent conversations appear beneath the assistant.
Read the websites table
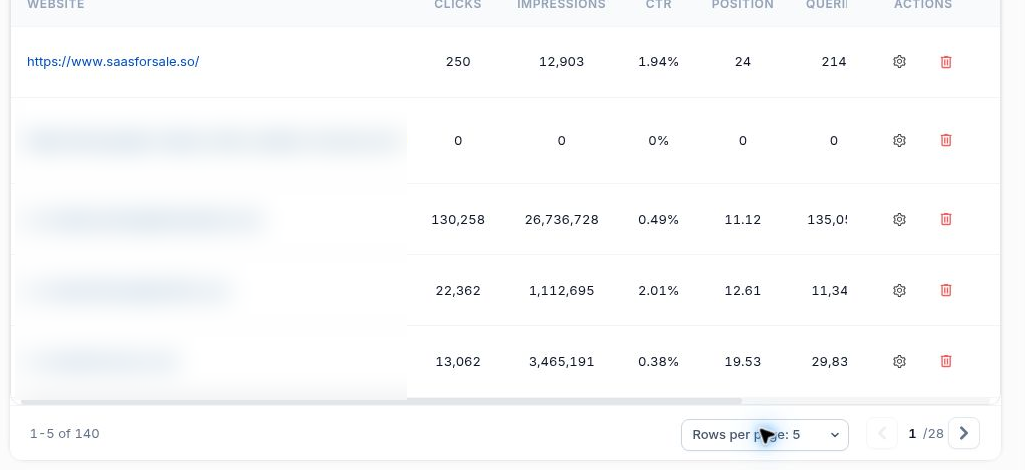
Scroll to Your websites Overview. Search for a property to narrow the table, or select Add New Website to begin connecting another project. Each row summarises a separate Search Console property.
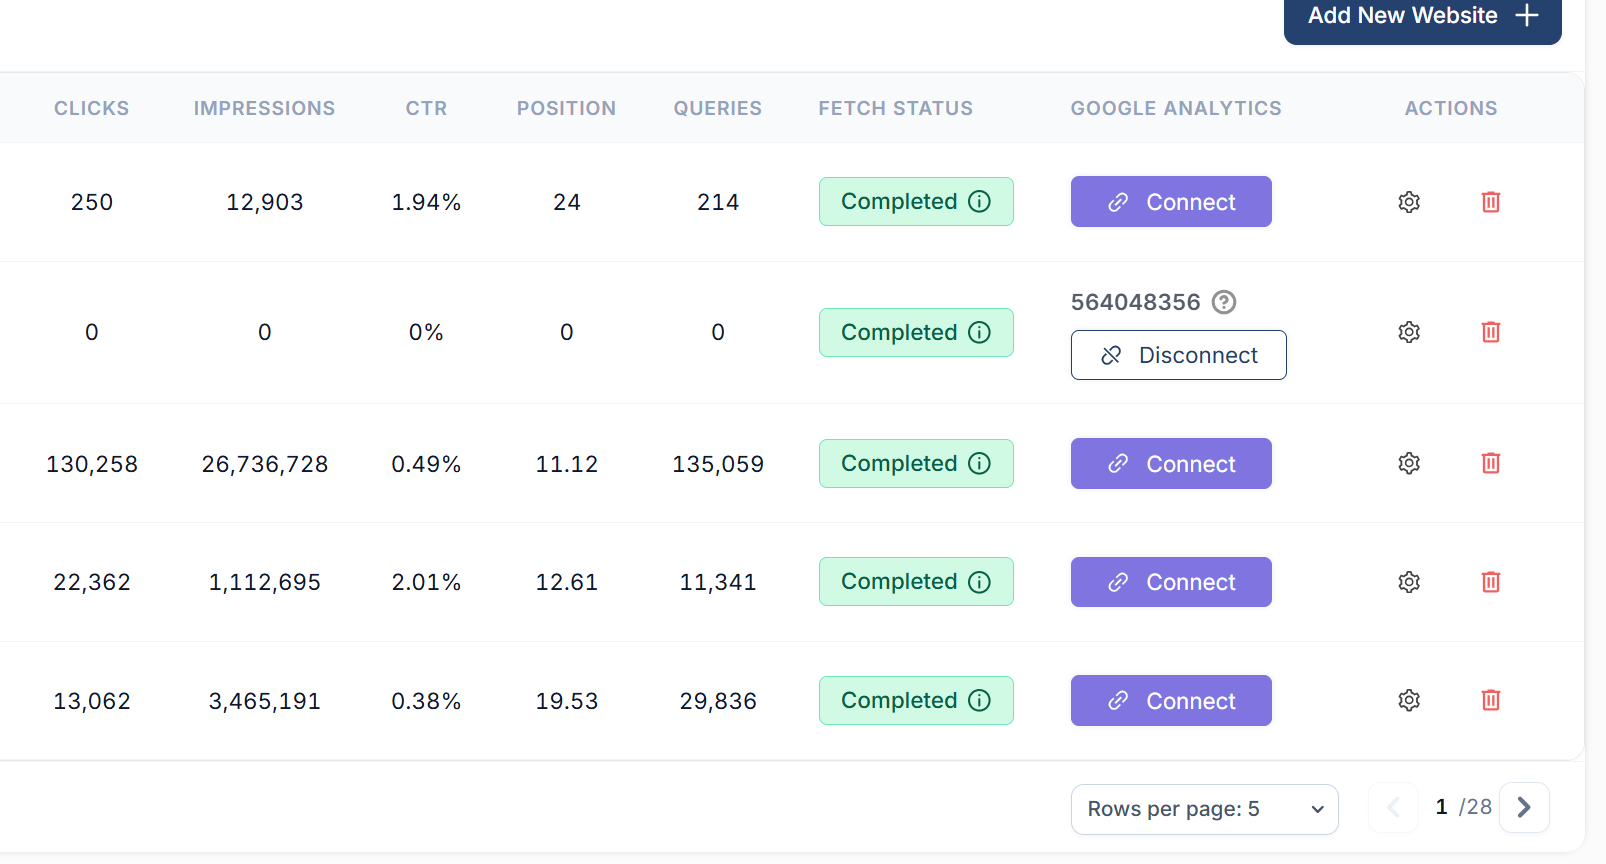
Clicks counts visits from clicks in Google Search. Impressions counts appearances in search results. CTR divides clicks by impressions. In the example, 250 clicks from 12,903 impressions gives 1.94%. Position is the average position across the search appearances in scope. Queries counts reported search terms.
Fetch Status tells you whether the data collection has completed.
 image
Under Google Analytics, Connect starts the GA4 connection and Disconnect removes an existing link. The gear opens website settings and the delete control removes a website. On narrower screens, scroll the table horizontally to reach the remaining columns.
Use Rows per page to change how many projects are visible and the arrows to move through the portfolio.
 image
Compare total traffic across the portfolio
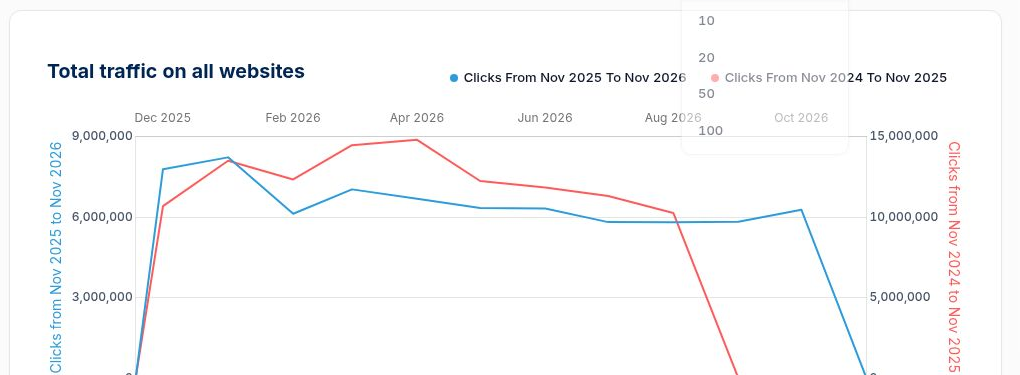
Total traffic on all websites plots clicks across your projects. Read the date ranges in the legend before comparing the lines. If the portfolio falls in one month, open an individual website and compare its pages and queries to find which project contributed to the change. A fall at the end of the current month can reflect an incomplete month.
 image
The legend identifies the two click series and their reporting periods.
Find tools and support
Use the left menu to move between the Dashboard, Website Overview, Projects and specialist reports. The top search field helps you find a topic, the top bar also includes language, help, feedback, notifications and the AI Assistant. Help includes links to the Knowledge Base and technical support. The footer links to release notes, privacy information and terms.
More in Getting started
Website Overview: review your SEO and AI visibility performance
Use Website Overview to review search performance, AI visibility and SEO health, then choose the right report for your next action.
ReadWebsites and Dashboard: choose a project and review your portfolio
ReadWhat is SEO Stack?
What the platform does, what it sits on top of, and what it is not.
ReadHow data warehousing works
Why Google's 16-month window exists, and what SEO Stack does about it.
Read