How to use Website Overview (View All Project Performance)
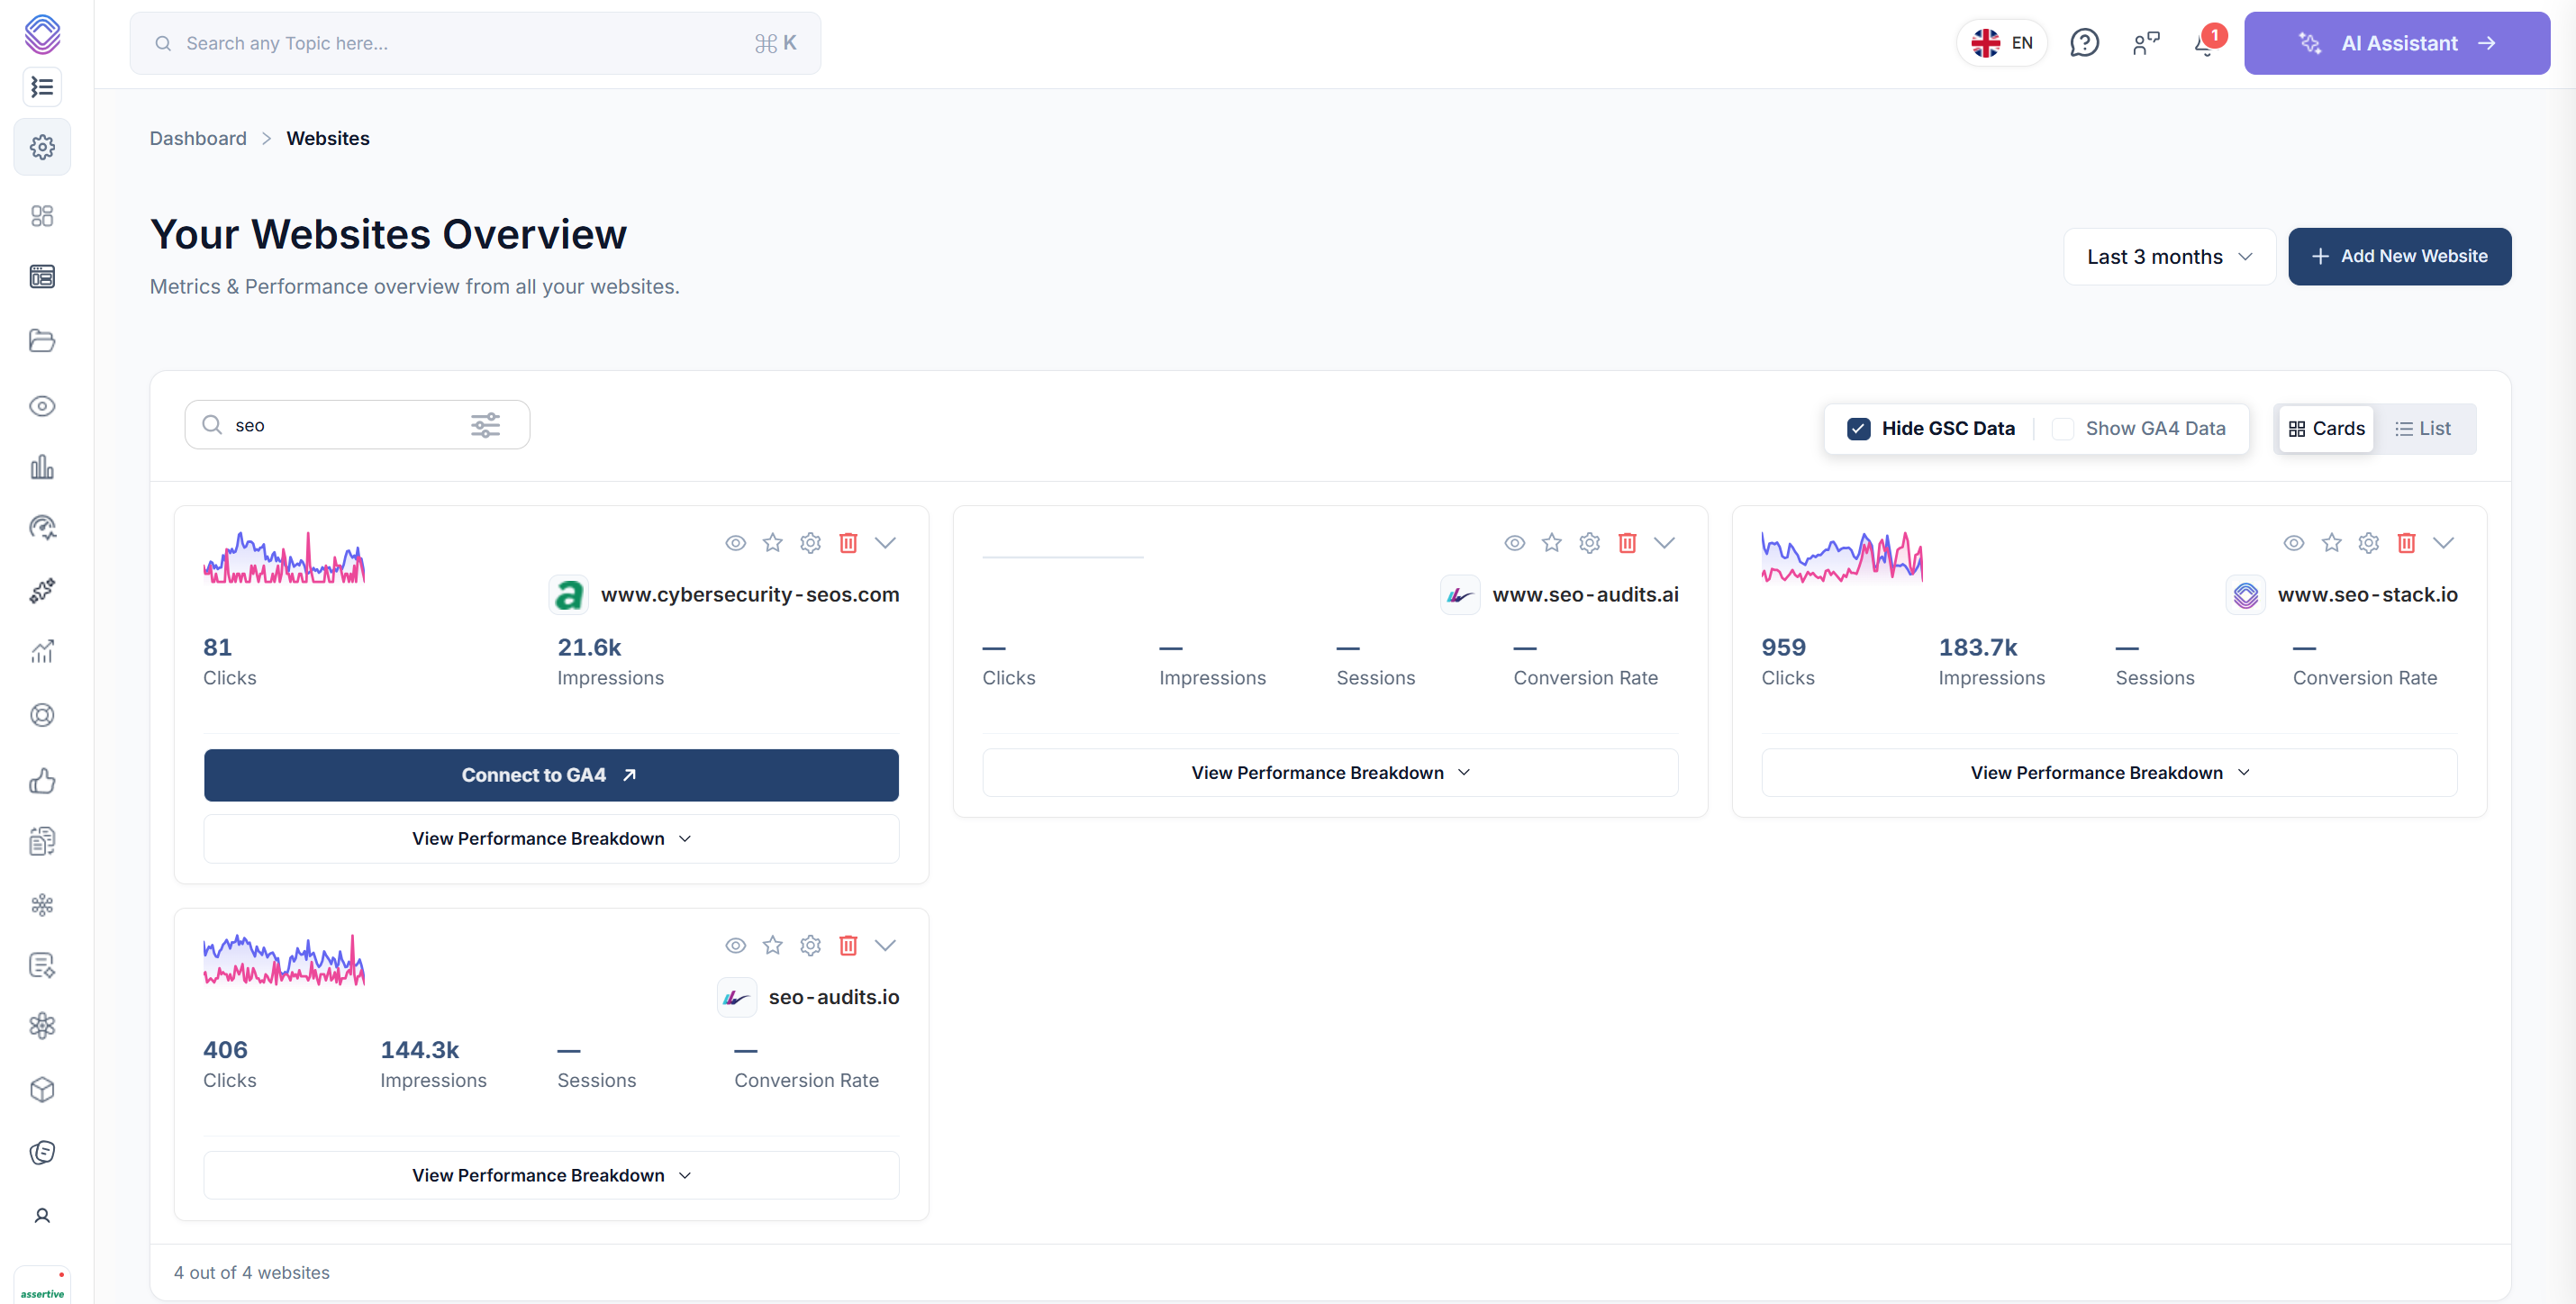
Open Projects → Websites to review your connected properties. Cards gives each website space for its performance comparison. List puts the same projects into rows so you can check search data, analytics connections and fetch status across the account.
 image
Set the scope of your review
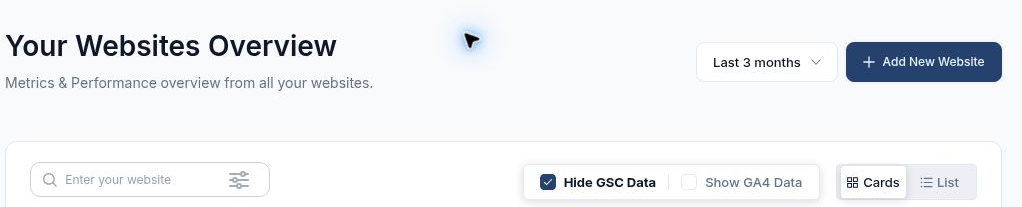
Choose a date range at the top. The examples use Last 3 months. Type a domain into the website search field to narrow the projects shown. Add New Website starts the setup for another property.
The data buttons describe the action available. Hide GSC Data means Search Console data is currently shown. Show GA4 Data brings analytics metrics into view where the property has a usable connection. Use Cards and List beside these controls to switch layouts.
 image
The date range, property search, data controls and layout switch.
Use Cards to review one website at a time
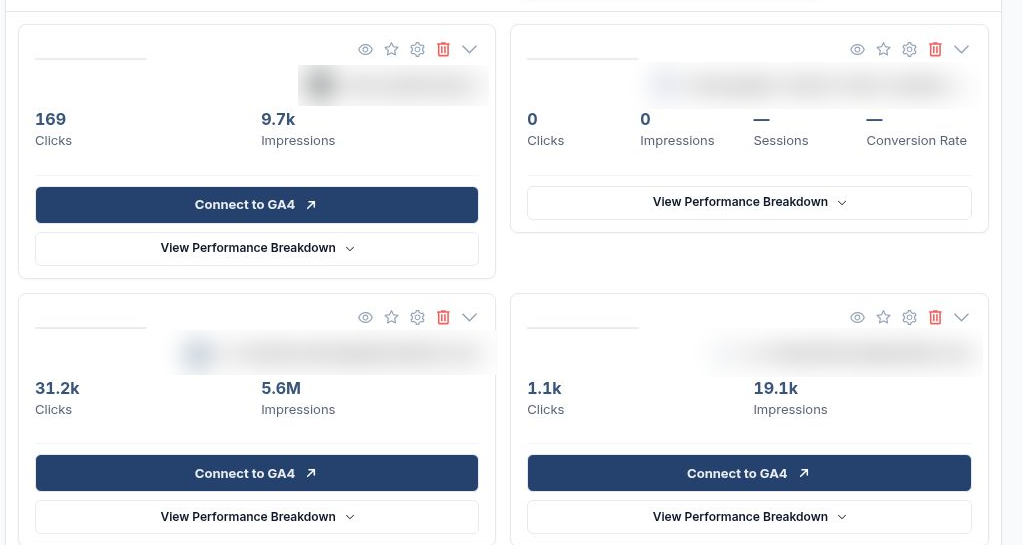
Each card shows the website’s clicks and impressions. Connected properties can also show GA4 sessions and conversion rate. A dash means the view has no value to display. If a card says Connect to GA4, use it to start linking analytics for that website.
Use the eye to view a website, the star to mark it as a favourite, and the gear for project settings. The delete control removes the website. The chevron expands or collapses its details.
 image
Cards view shows each project’s available metrics and actions.
Open the performance breakdown
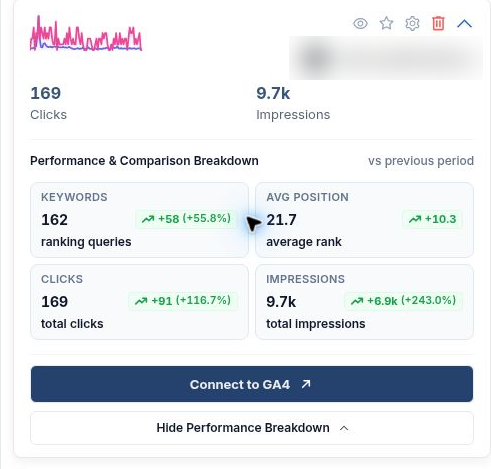
Select View Performance Breakdown on a card. Read the current value alongside the change versus the previous period. Keywords is the number of ranking queries. Avg Position is the average rank. Clicks and impressions show the change in search traffic and exposure.
In this example, clicks rose by 91 to 169, from 78 previously. Ranking queries rose by 58 to 162. Impressions increased by 243% while clicks increased by 116.7%, so exposure grew faster than traffic. Open the website’s query data to see which searches drove the extra impressions. Select Hide Performance Breakdown to collapse the card.
 image
An expanded card keeps the previous-period comparison beside the current values.
Use List to check the portfolio in rows
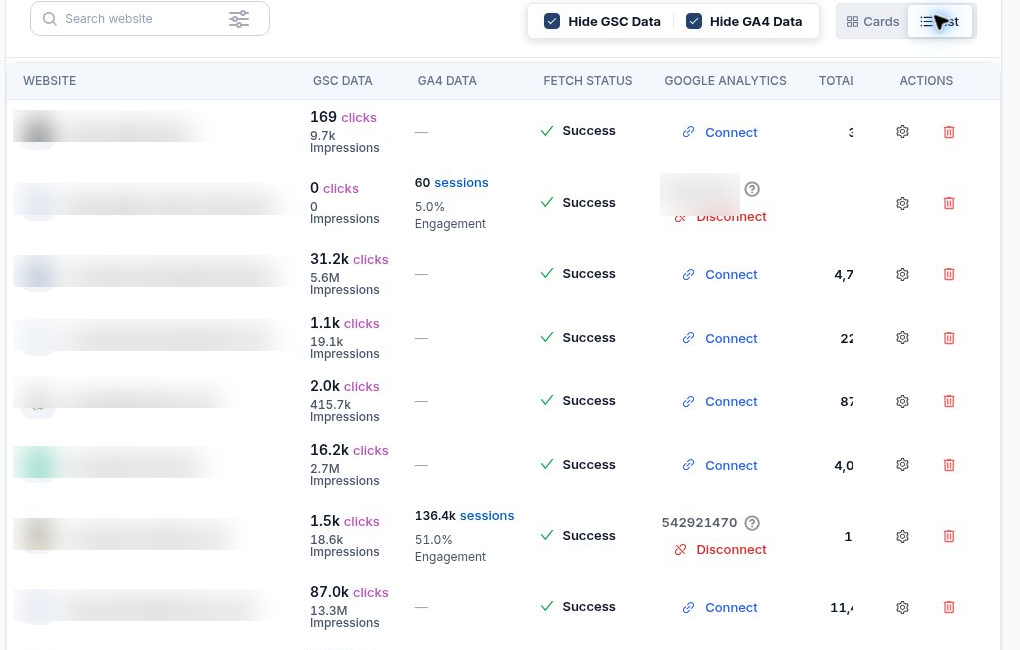
Select List. Website identifies the project and opens it. GSC Data groups clicks and impressions. GA4 Data shows available analytics figures when enabled. Fetch Status reports the collection state. A successful fetch can coexist with zero clicks.
Google Analytics shows the connection control separately from the performance figures. Connect starts linking a property. Disconnect removes its existing link. Total Size In Bytes and Total Storage Count are separate storage fields. Read their displayed units independently. Created shows the project creation date, and Actions provides settings and deletion. Scroll horizontally if the final columns extend beyond your screen.
For a weekly check, use List to spot a missing connection or an unexpected fall in clicks. Switch to Cards, expand that project and compare its keywords and impressions over the same period. This distinguishes a data-collection question from a change worth investigating in Search Console.
 image
More in Getting started
Website Overview: review your SEO and AI visibility performance
Use Website Overview to review search performance, AI visibility and SEO health, then choose the right report for your next action.
ReadWebsites and Dashboard: choose a project and review your portfolio
ReadWhat is SEO Stack?
What the platform does, what it sits on top of, and what it is not.
ReadHow data warehousing works
Why Google's 16-month window exists, and what SEO Stack does about it.
Read