How to use the Website Overview
An article explaining how to use the website overview functionality.
Open Website Overview after selecting a website in the sidebar. This is the report for one property. It brings together Google Search Console, GA4, AI visibility tracking and technical checks. The source label on each card tells you where its number comes from.
Choose the period, country and competitors
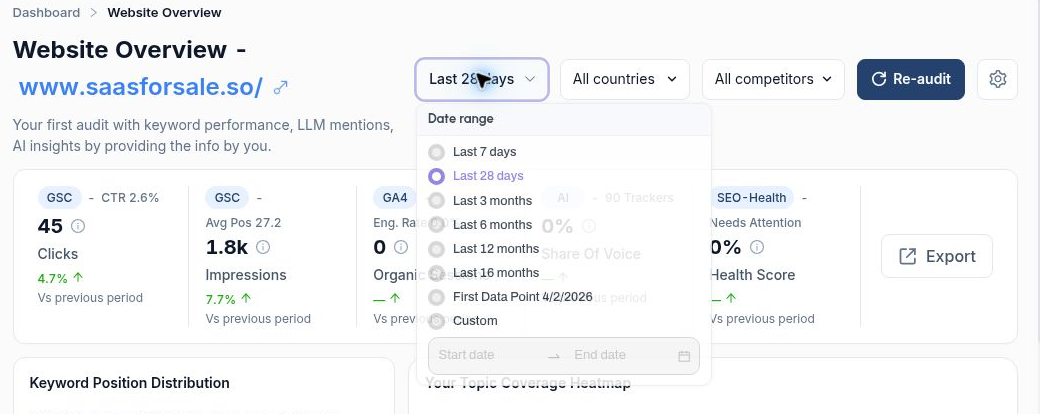
Check the domain in the heading. The external-link icon opens the website. Open the date selector and choose the last 7 or 28 days, the last 3, 6, 12 or 16 months, or Custom for exact dates. Use the same period when following a finding into another report.
Country lets you narrow the review to a market. Start with All countries to assess the property overall, then select the market you want to investigate. Competitor selects the comparison brand for competitor analysis. A technical file check has no country or competitor dimension.
Use the gear for Website Settings, Re-audit to request a fresh audit and Export to access the report export.
 image
Date presets and report selectors for the selected property.
Read the five summary cards
Clicks and CTR. The example received 45 Google Search clicks, up 4.7% against the previous period. The smaller 2.6% figure is CTR, the share of impressions that generated clicks.
Impressions and Avg Pos. The site appeared roughly 1,800 times and averaged position 27.2. Impressions rose 7.7%. Open the query report to see which searches gained exposure.
Organic Sessions. GA4 measures visits from organic search and shows their engagement rate. This property offers Connect to GA4 in Projects → Websites, so its zero sessions cannot establish that organic visitors never arrived.
Share Of Voice. Read this alongside the tracker count and the competitors included in the comparison. The example shows 90 trackers. Health Score summarises basic technical checks. Scroll to SEO Health Audit to see the checks behind the score. A dash beside “Vs previous period” means the card supplies no comparison.
 image
The source, headline value, secondary metric and previous-period comparison appear together.
Read the keyword distribution and topic heatmap
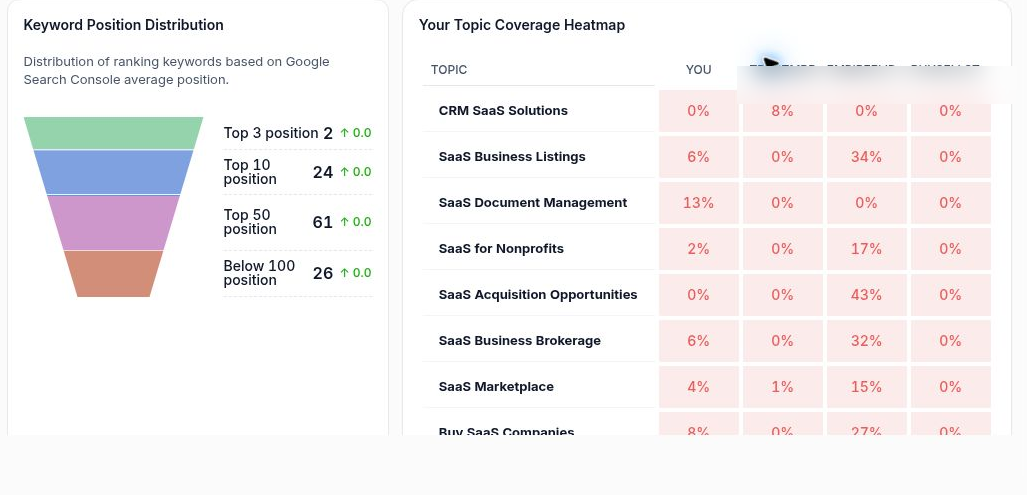
Keyword Position Distribution groups queries by GSC average position. Here the displayed counts are 2 for Top 3, 24 for Top 10, 61 for Top 50 and 26 for Below 100. Use View All keywords to inspect the queries behind the distribution. The band labels alone do not establish whether counts overlap, so avoid summing them into a unique keyword total.
In Your Topic Coverage Heatmap, read across one topic at a time. YOU is the selected brand. Other columns are competitors. For SaaS Business Listings the project shows 6% against 34% for one competitor, a 28 percentage-point gap. Use View All Your Topics to inspect the tracked prompts and answers for that topic. The percentages describe tracked AI coverage, not how much of your website has content on the subject.
 image
The distribution uses Google search positions. The adjacent heatmap compares AI topic coverage.
Compare brands and inspect the health checks
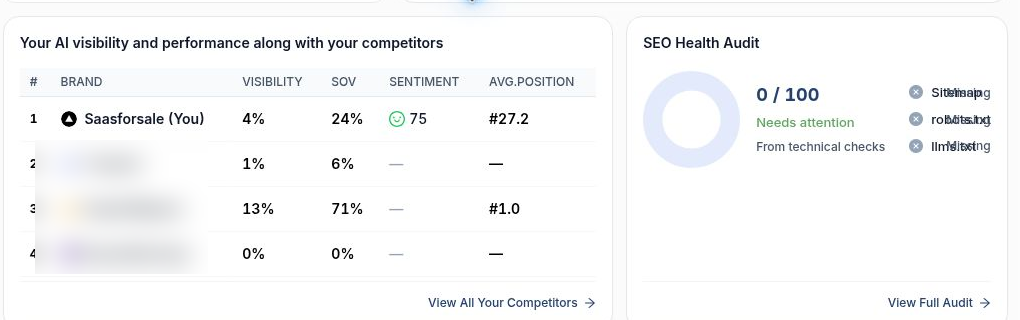
In the AI competitor table, Visibility describes how often the brand appears in the tracked answers. SOV shows its relative share in the comparison. Sentiment summarises the tone of the mentions, and Avg. Position is the position displayed for the brand. A dash means a value is unavailable. Use View All Your Competitors to inspect the underlying AI report. In this snapshot the brand row shows 4% visibility and 24% SOV, while the headline SOV card shows 0%. Check the underlying report and its scope before quoting either figure.
SEO Health Audit lists the individual sitemap, robots.txt and llms.txt checks. If a file reads Missing, open View Full Audit and verify the relevant file before assigning work. The score reflects these technical checks and cannot explain a ranking change on its own.
 image
Brand comparison and the technical checks behind the health score.
Follow a recommendation through to the page
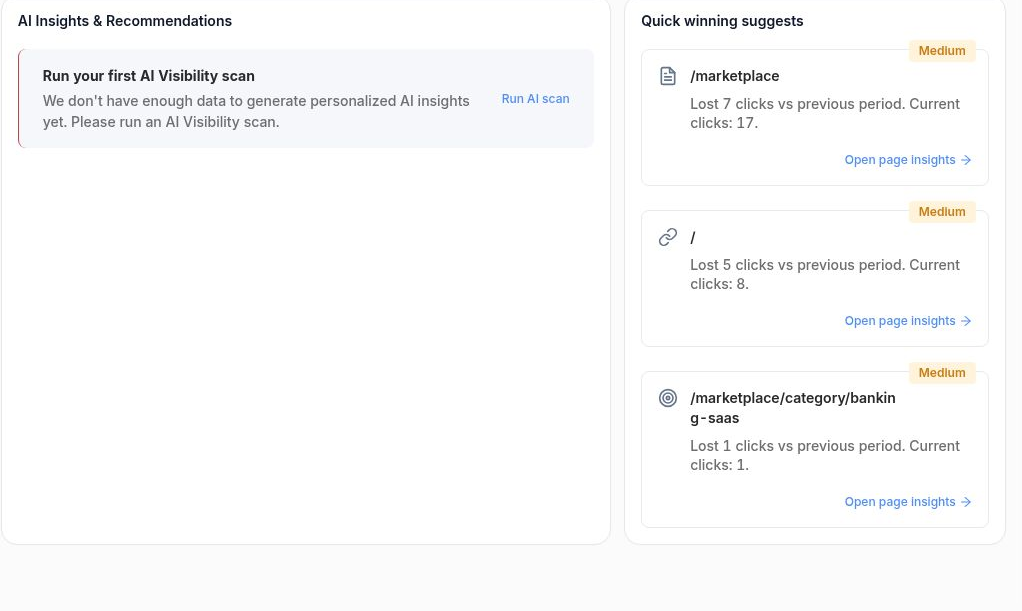
AI Insights & Recommendations can offer Run AI scan when there is too little data to generate insights. Quick winning suggests lists individual pages, the click change and a priority. Here /marketplace lost seven clicks and retained 17. It previously received 24, so the decline was about 29%. Select Open page insights on that row to review the page in Search Console Data with its date range carried through. Check the queries behind the seven-click loss before deciding whether the page needs work.
 image
Open page insights takes you from a specific decline to its supporting data.
More in Getting started
Website Overview: review your SEO and AI visibility performance
Use Website Overview to review search performance, AI visibility and SEO health, then choose the right report for your next action.
ReadWebsites and Dashboard: choose a project and review your portfolio
ReadWhat is SEO Stack?
What the platform does, what it sits on top of, and what it is not.
ReadHow data warehousing works
Why Google's 16-month window exists, and what SEO Stack does about it.
Read