How to use Website Traffic (GA4) in SEO Stack
Learn more about the website traffic (GA4) integration, how to use the tools and how to sub-navigate into reports.
Which channels brought visitors in, which campaign sent them and what did they do on the page? Website Traffic connects those questions through its acquisition, campaign, ecommerce and landing-page reports. Follow the examples below to trace an email newsletter to its two landing pages and find out why a popular SEO article received most of its visits from outside organic search.
 image
Start with the question and the reporting period
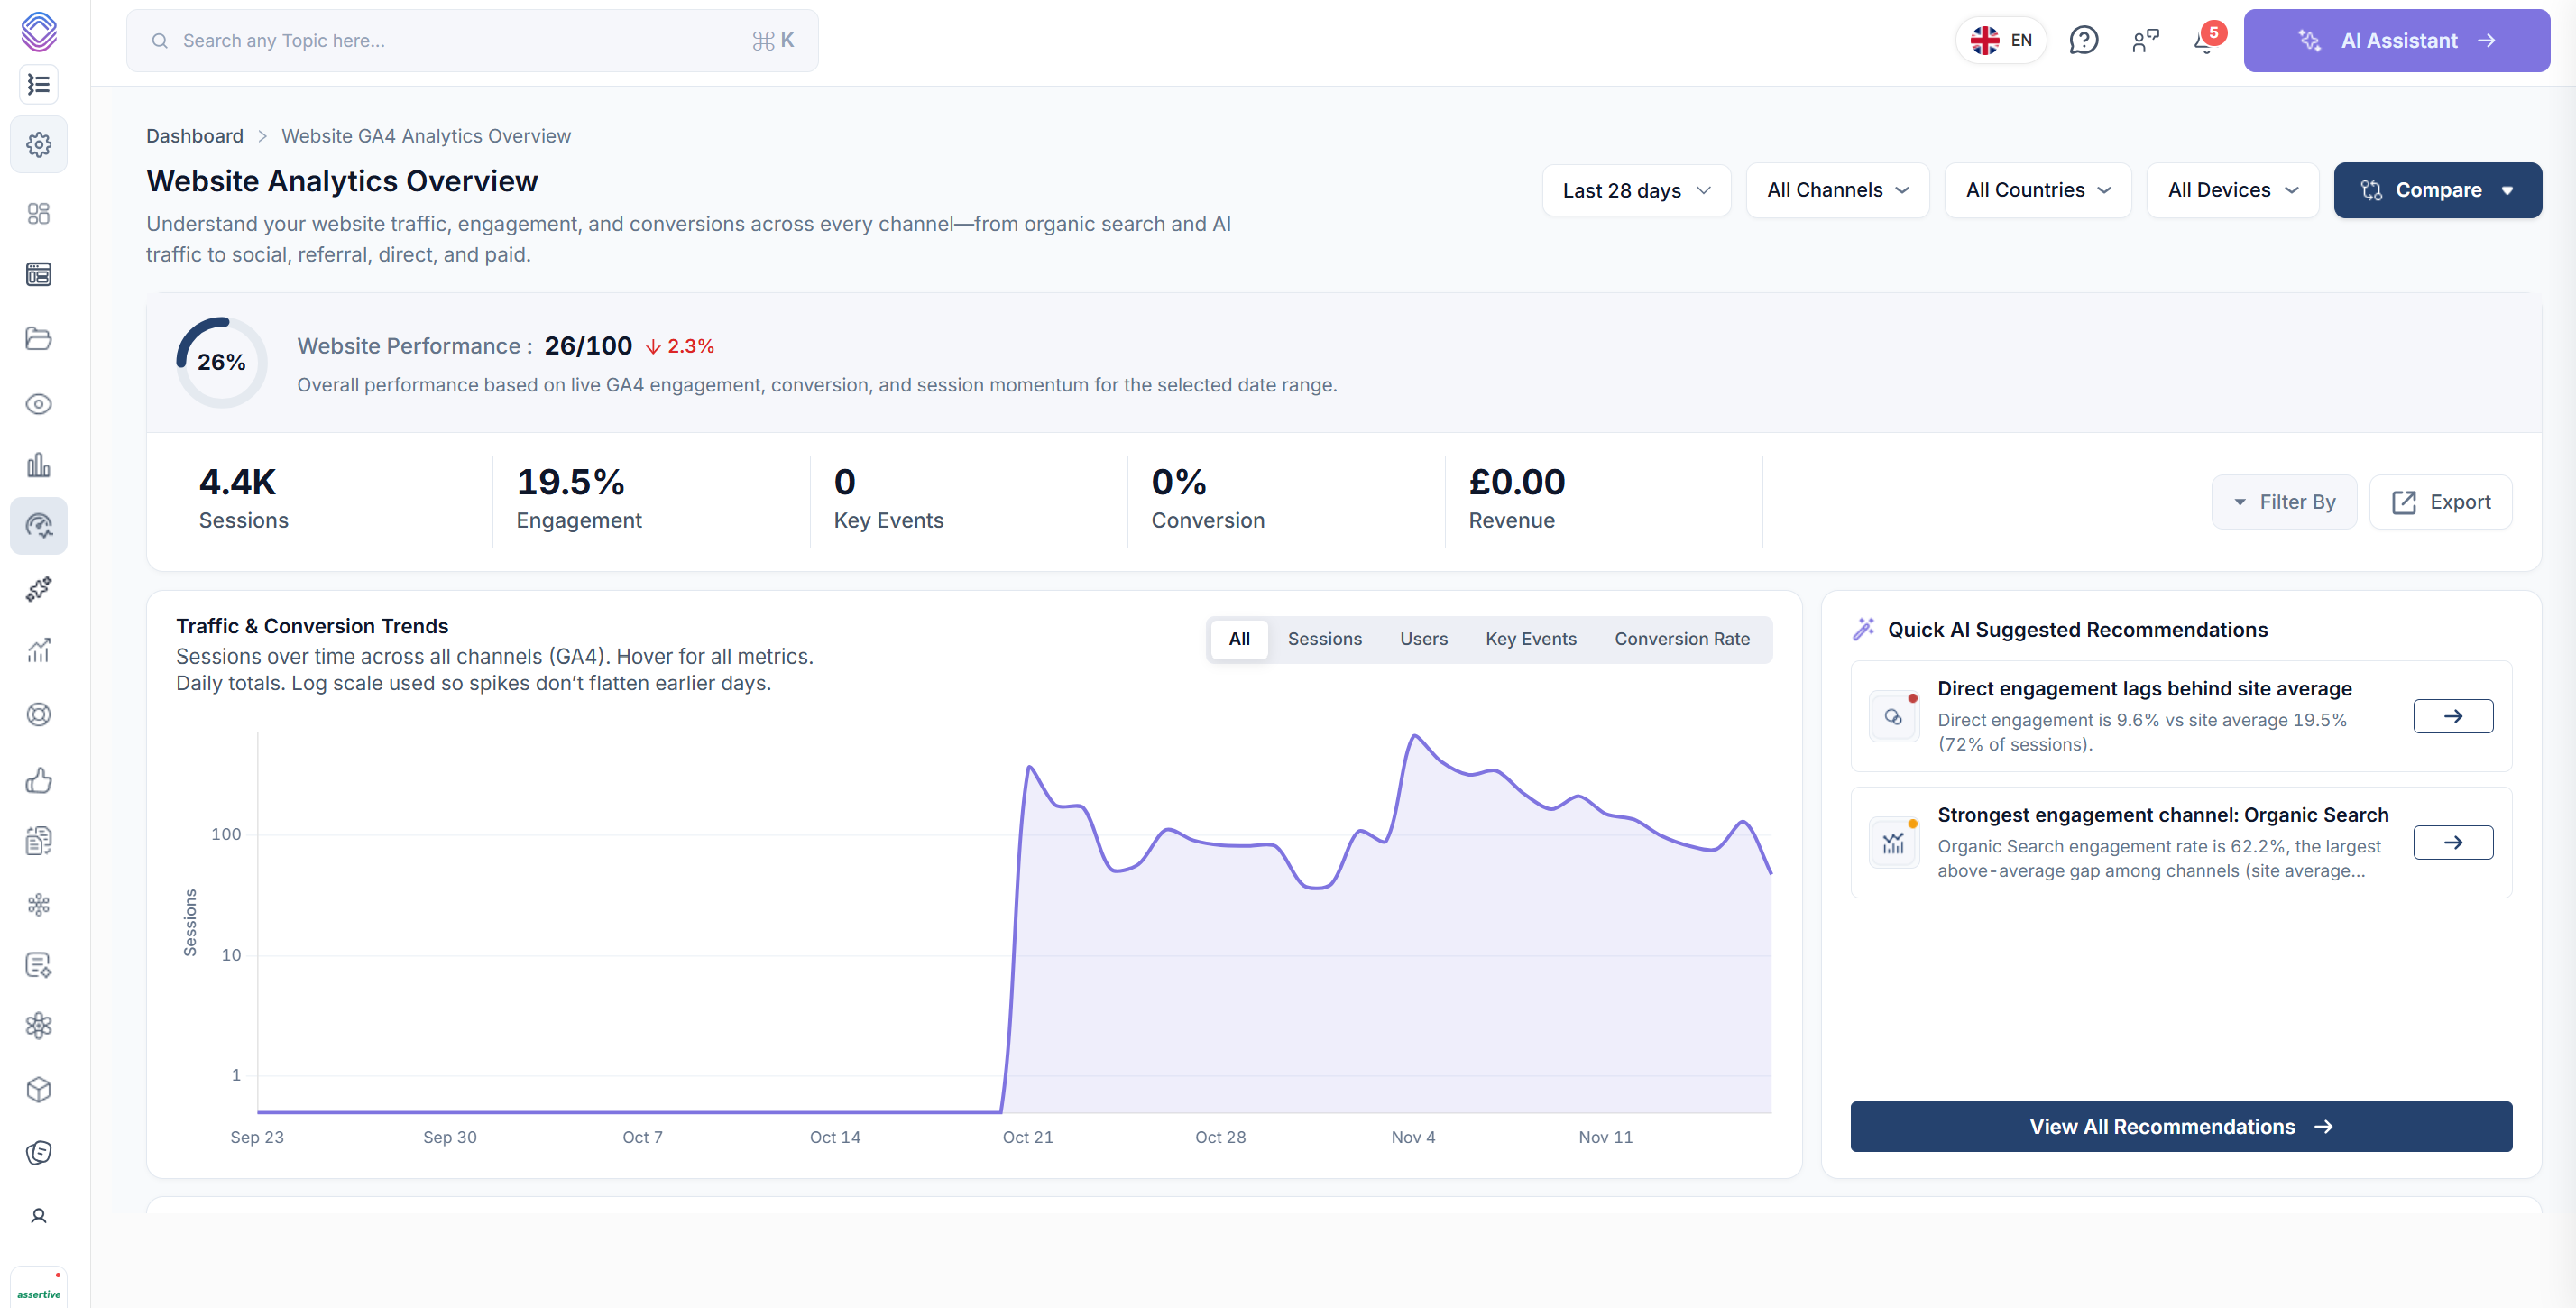
Select your website and open Insights → Website Traffic (GA4). Check the date range, channel, country and device before reading the totals. Use Compare when you need a comparison period. These examples use 21 October to 17 November 2026 with all channels, countries and devices included.
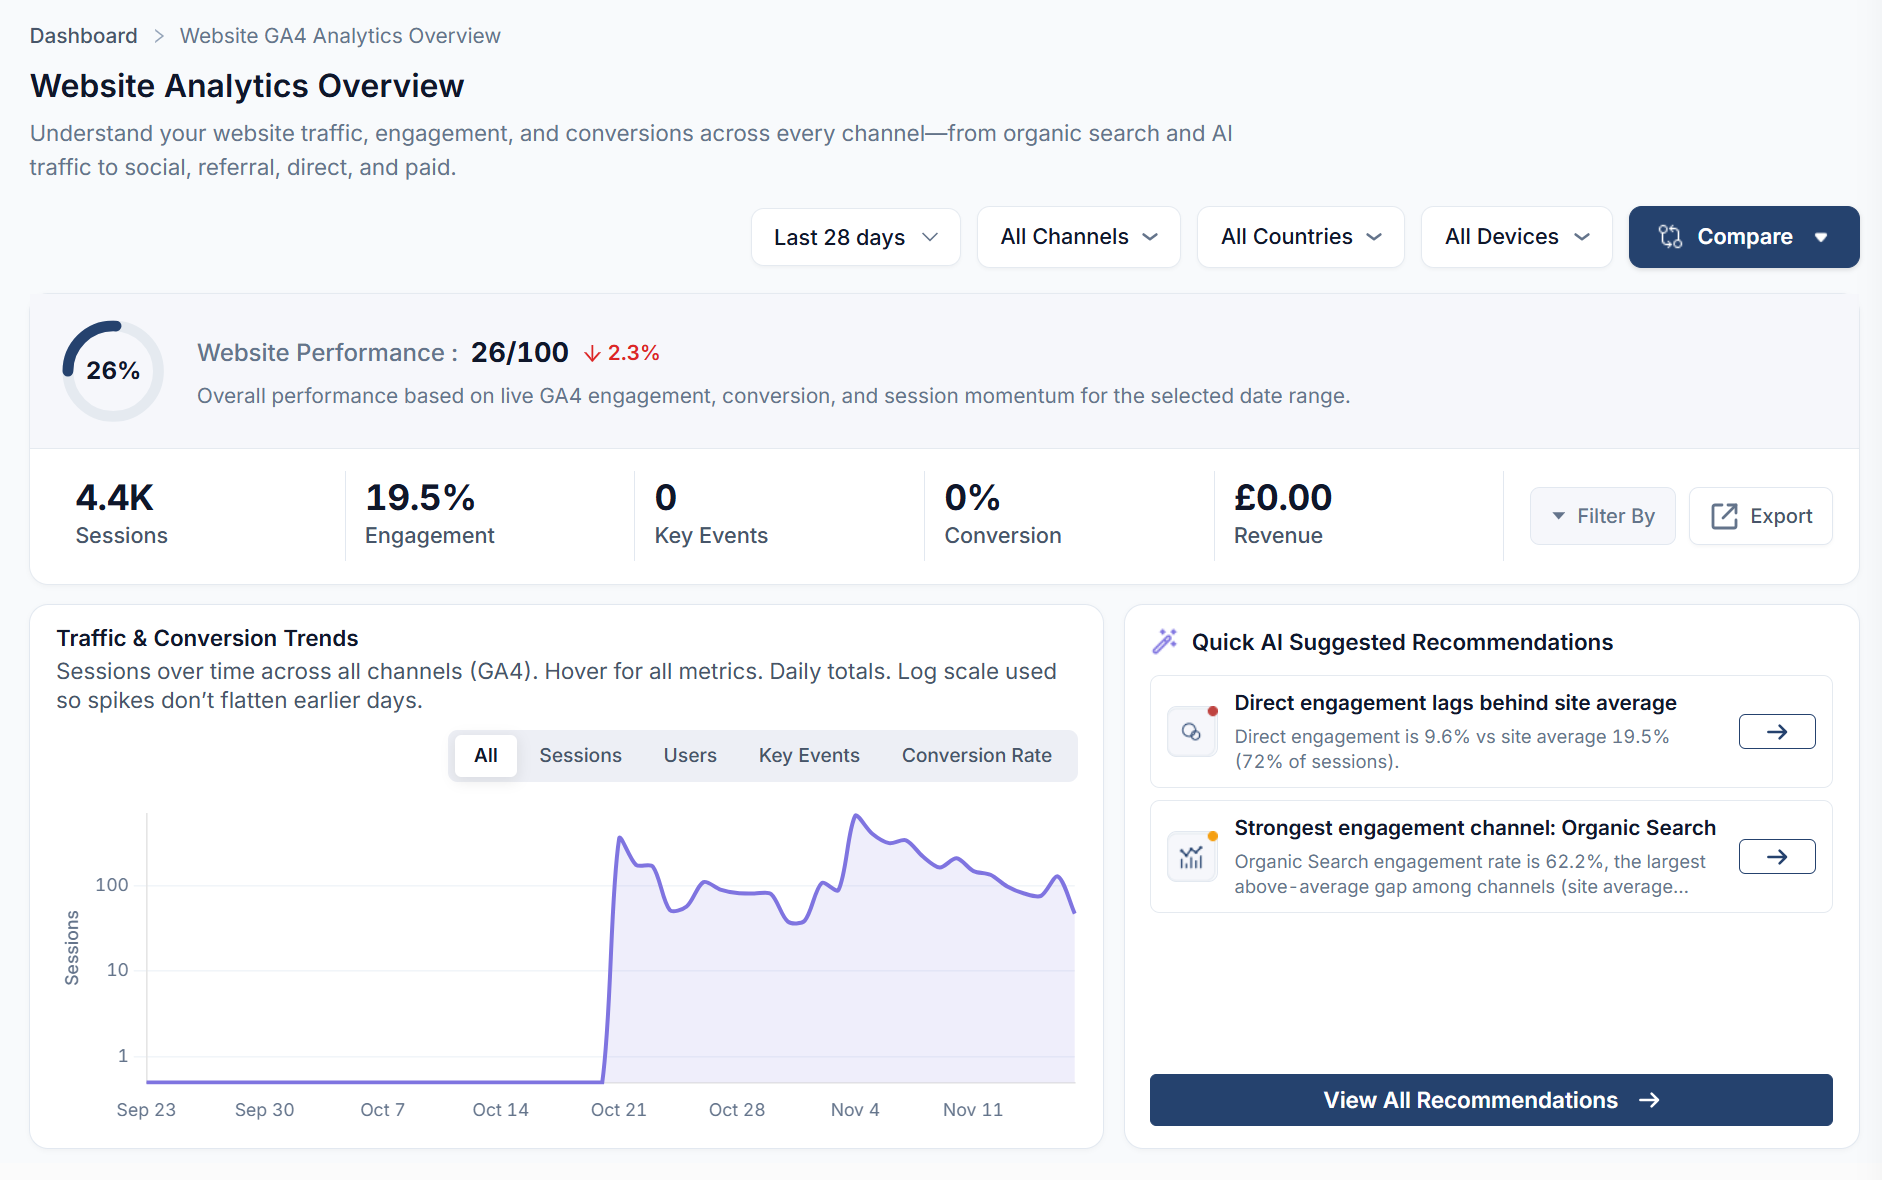
The overview recorded 4.4K sessions and a 19.4% engagement rate. The Website Performance score was 26/100, based on engagement, conversion and session momentum. The cards alongside it give the underlying measures. Key Events, Conversion and Revenue all showed zero. On a lead-generation site, check whether important actions such as a successful enquiry are being recorded before judging the business value of the traffic.
Under Traffic & Conversion Trends, switch between Sessions, Users, Key Events and Conversion Rate. Hover over a date for its values. The sessions chart uses a logarithmic scale, so use the tooltip to quantify a spike. Users by Channel farther down counts people, while the acquisition table counts sessions. A returning visitor can contribute several sessions.
 image
Open View Traffic Acquisition to find the sources behind each channel
From Traffic from different channels, choose View Traffic Acquisition. The detail page gives the exact total of 4,443 sessions, alongside 3,781 new users, an 80.6% bounce rate, average session duration and pages per session. Use the time series to see when organic, AI assistant, referral or social traffic changed.
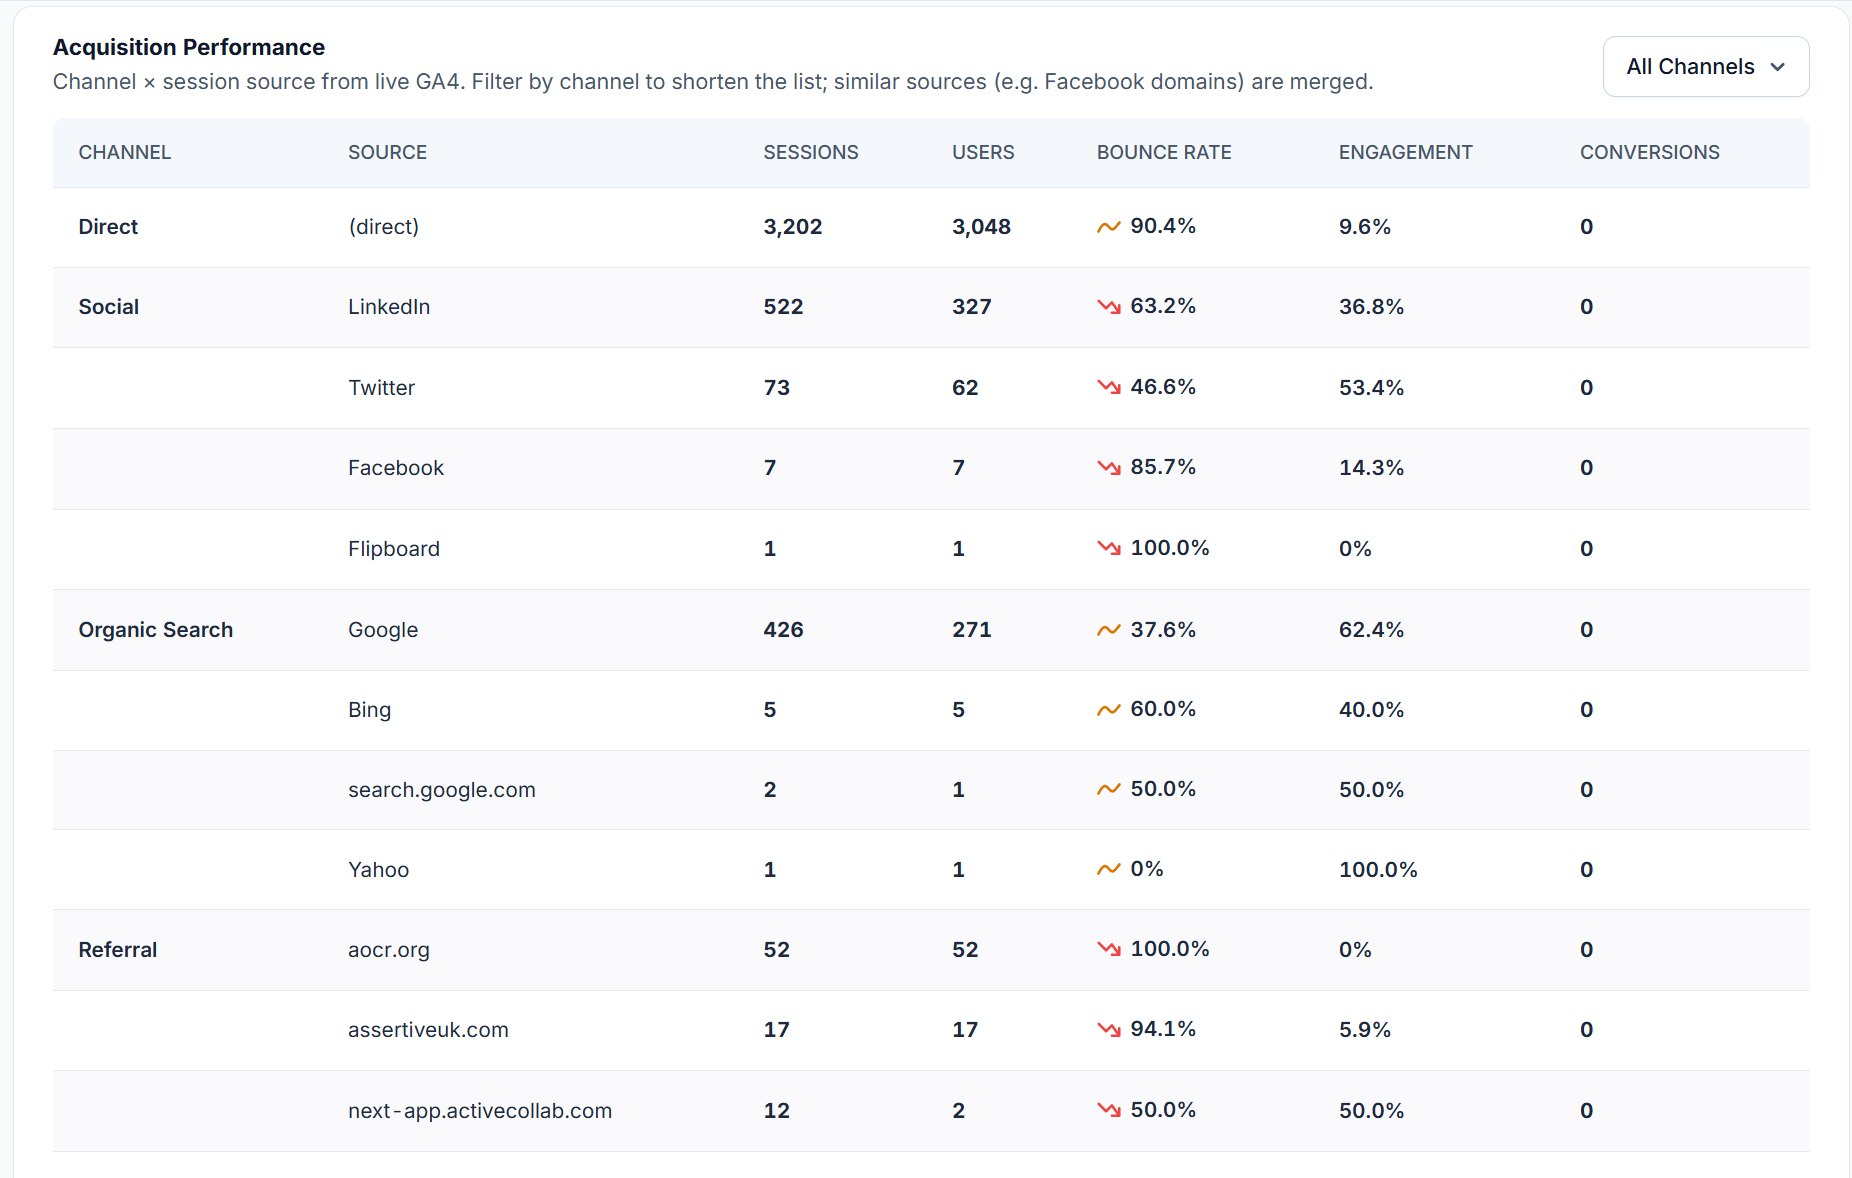
Scroll to Acquisition Performance. The channel selector above this table shortens the source list. Use Show all sources to reveal the remaining rows. Direct contributed 3,200 sessions at 9.6% engagement. Google contributed 425 sessions at 62.4% engagement within Organic Search. The overview reported 433 organic sessions across all search sources. Reading the source row explains why the Google and Organic Search totals differ.
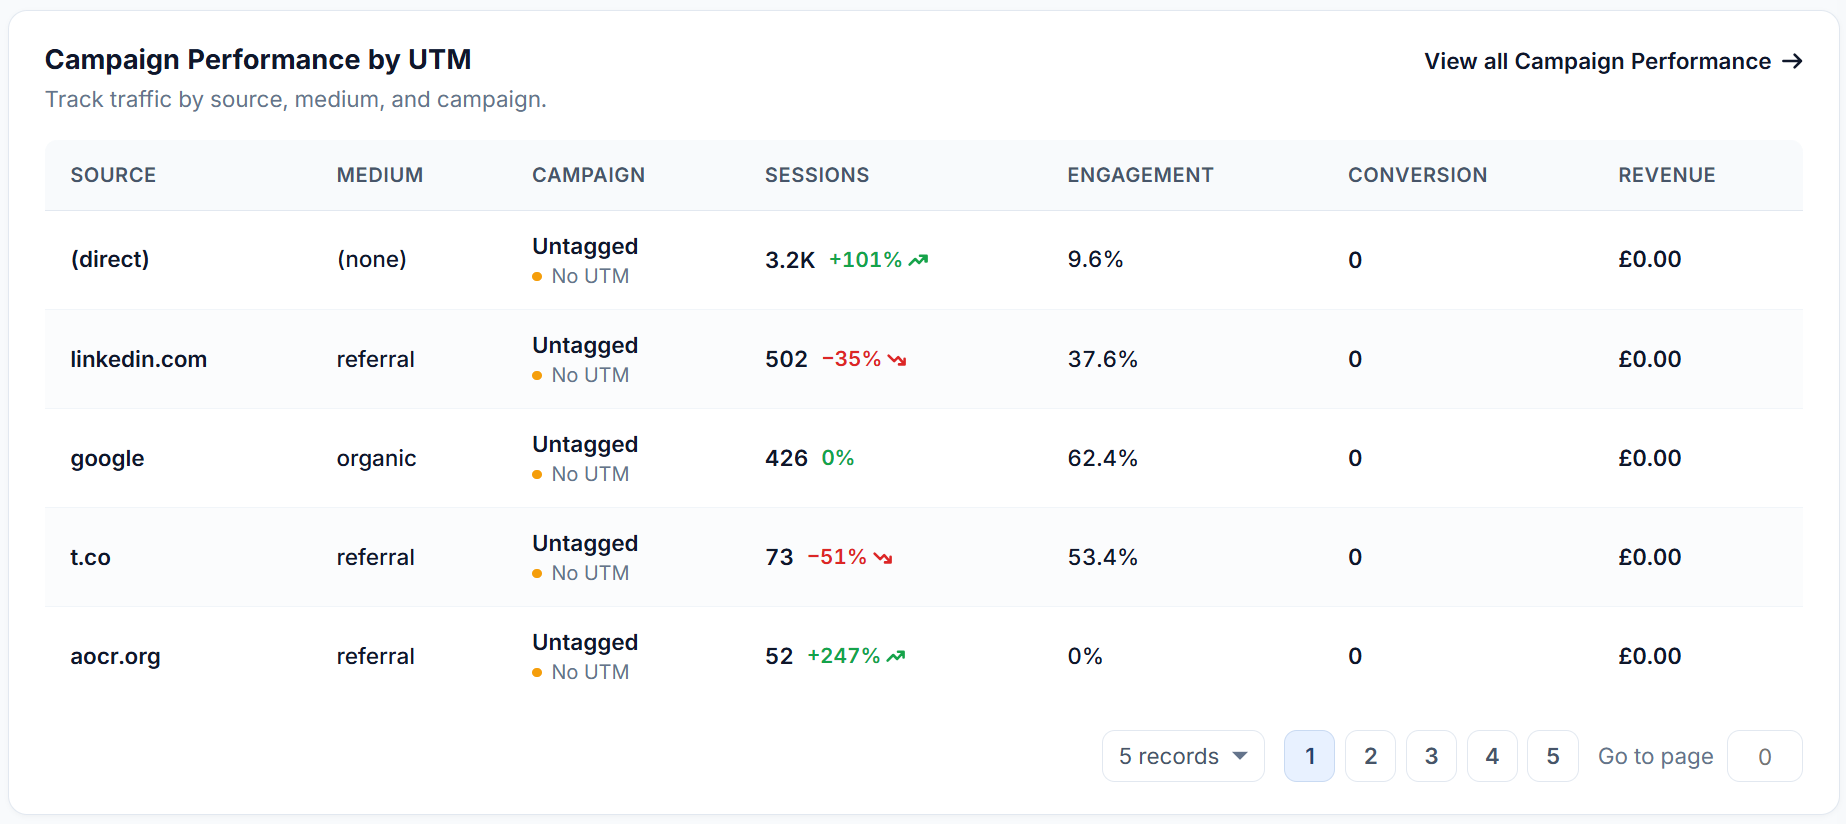
The report groups related source domains. For example, acquisition shows 522 LinkedIn sessions, while the overview campaign table shows 502 for the specific linkedin.com referral row. Keep the source definition with the number you report.
 image
Open View all Campaign Performance to review UTM tagging
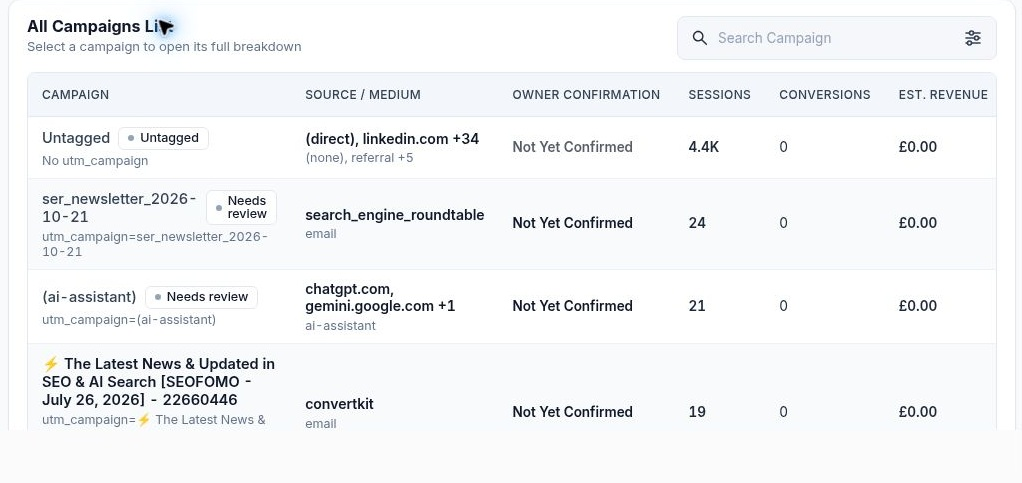
Return to the overview and find Campaign Performance by UTM → View all Campaign Performance. Read source, medium and campaign together. Source identifies where the visit came from, medium describes how it arrived and campaign groups visits under the campaign value. A referral can have a known source and medium even when its campaign is Untagged.
The detail report includes a campaign trend, All Campaigns List, device and location shares, and landing pages split by session medium. The example contained 12 campaign rows, including the Untagged group. A landing page can appear several times because an email visit, an organic visit and a referral are separate rows. Not Yet Confirmed is the owner-confirmation state of a detected campaign name. It can appear on a row that has already recorded sessions.
 image
 image
Open a named campaign and follow its visitors
In All Campaigns List, select ser_newsletter_2026-10-21. The source was search_engine_roundtable and the medium was email. The individual report recorded 24 sessions, 16.7% engagement and zero key events. All sessions came from desktop. The US accounted for 96%.
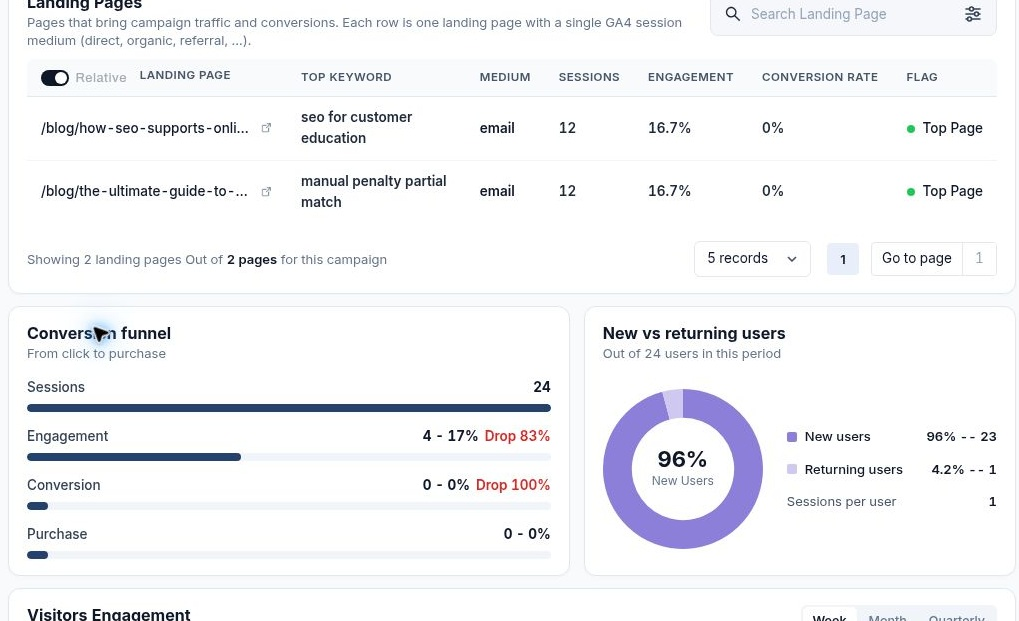
Use Campaign Trend to compare sessions or conversions over time. In Conversion Rate: Device by Country, select a cell to restrict the report to that combination. Read the landing-page table before assigning credit to the first result. The course-growth article and manual-actions guide each received 12 sessions, both at 16.7% engagement. They tied for the lead.
The Conversion funnel shows 24 sessions, four engaged and zero conversions or purchases. New vs returning users shows 23 new users and one returning user. For this newsletter, the next question is whether either landing page prompted the intended action and whether GA4 was set up to record it.
 image
Open E-commerce Revenue Trend to inspect sales
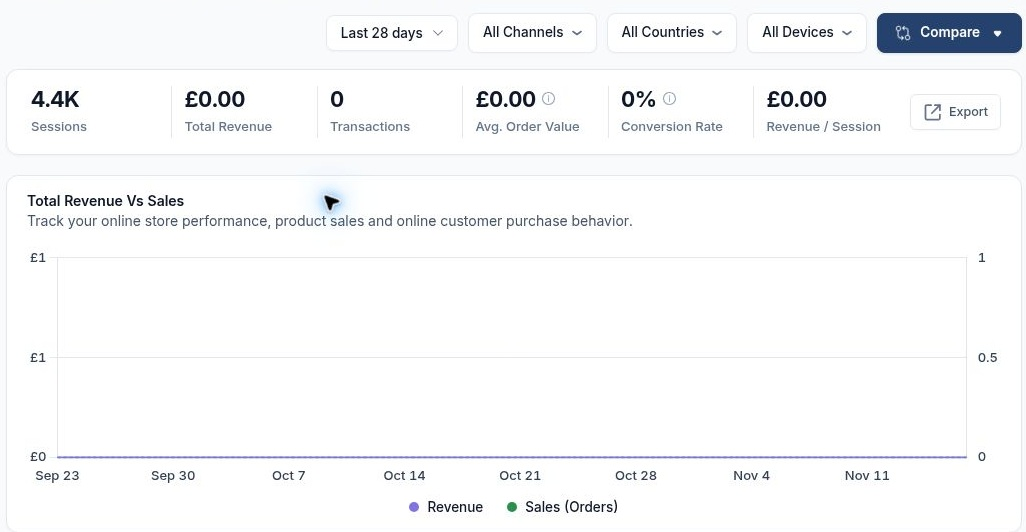
From the overview, select E-commerce Revenue Trend → View Details. The Ecommerce overview reports sessions, total revenue, transactions, average order value, conversion rate and revenue per session. Total Revenue Vs Sales lets you compare money received with orders over time. Use the channel and category panels below to locate the source of a revenue change. Revenue can rise because order volume rose, average order value rose, or both.
This property recorded 4.4K sessions, £0 revenue and zero transactions in the period. There are no recorded sales to attribute to a channel, product or country. For a shop with known orders, compare the dates with the store’s order records and check the GA4 purchase event, transaction ID, currency and value.
 image
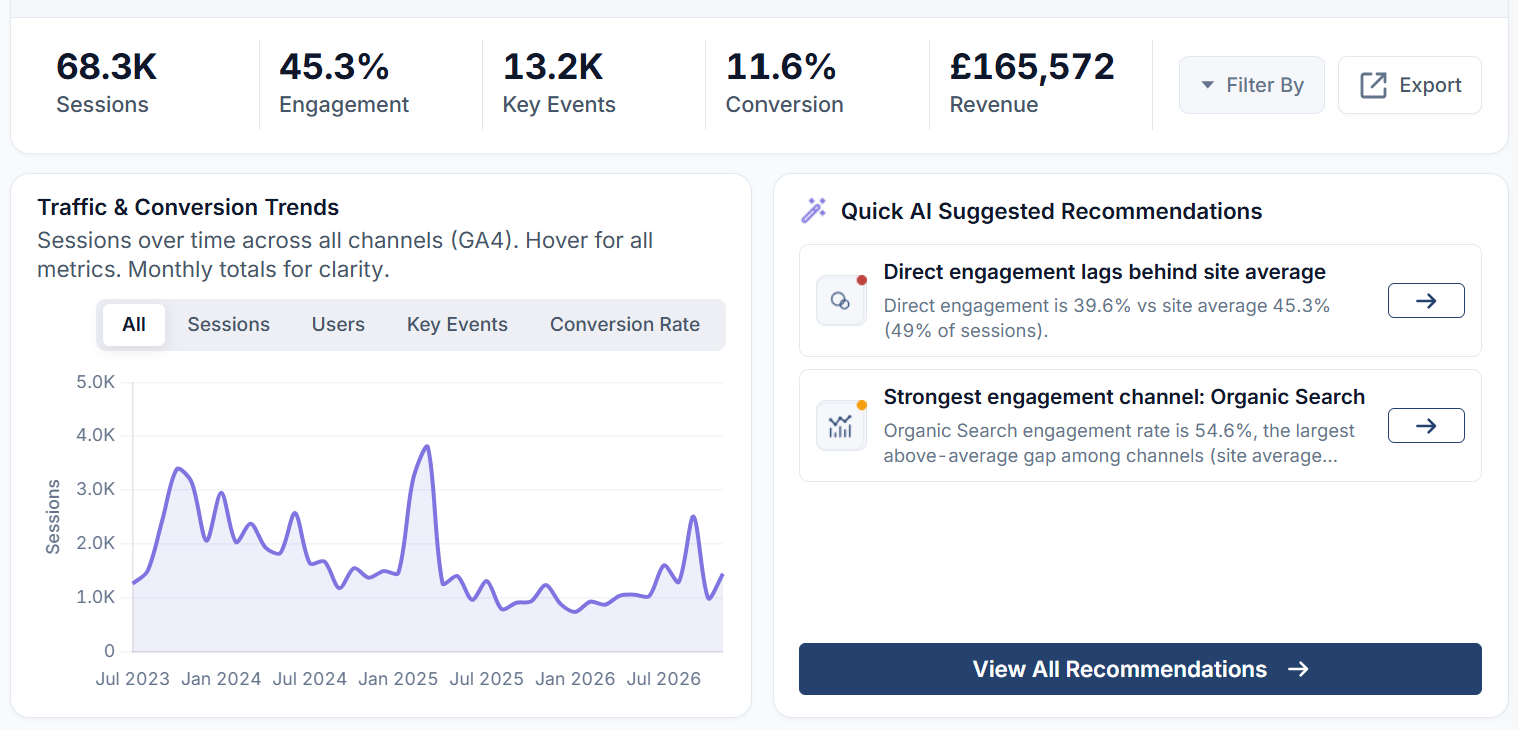
Demonstrating another site with revenue data -
 image
We can see revenue by channel quickly and easily >
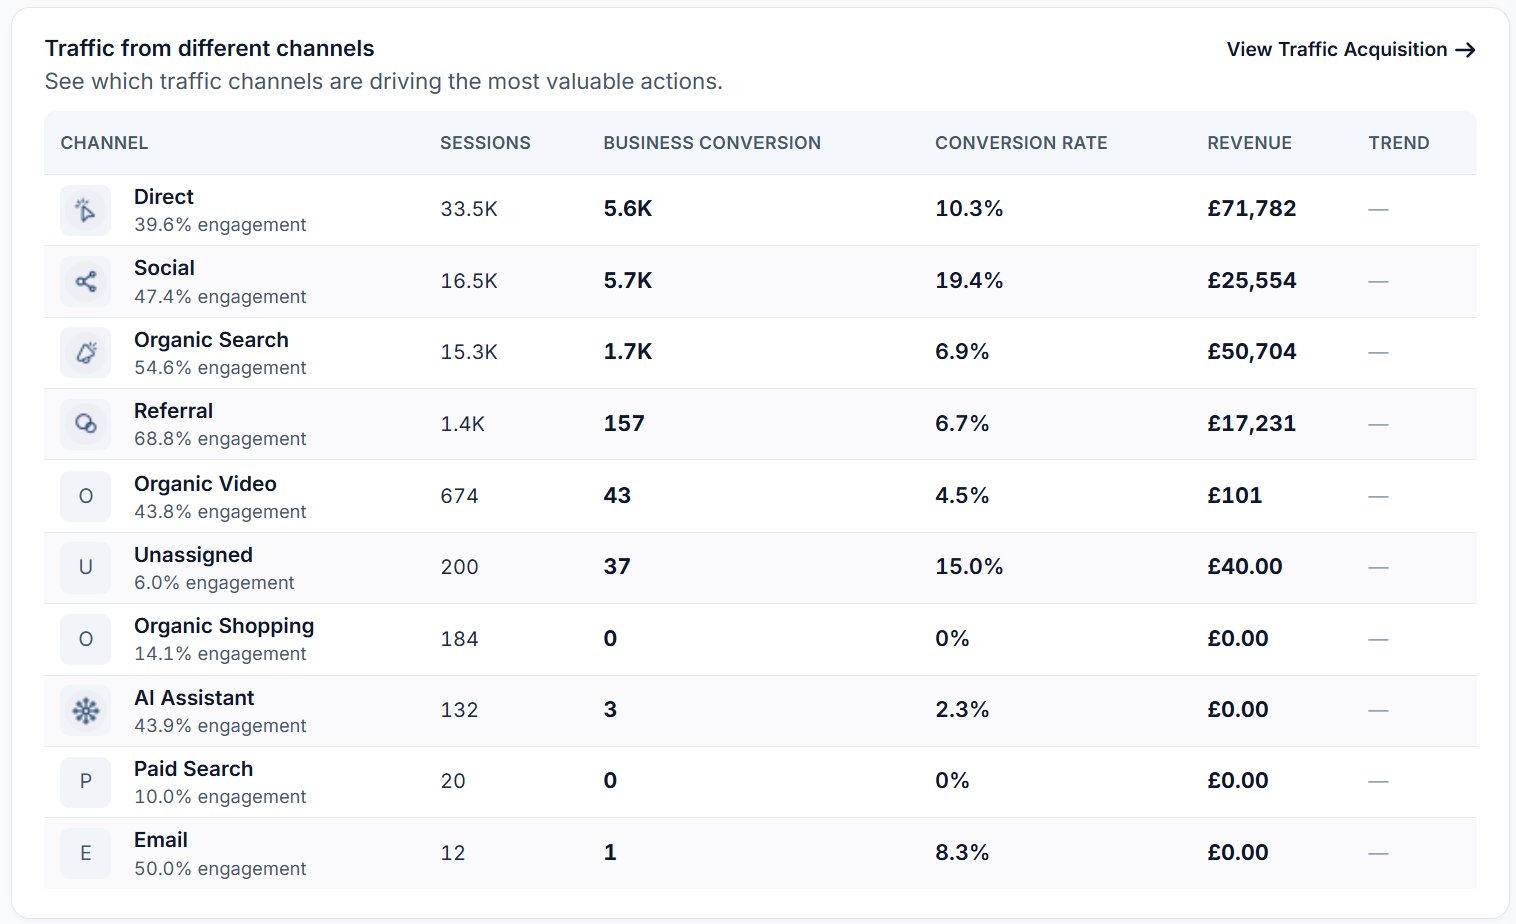 image
Drilling back down to the eCommerce overview we see >
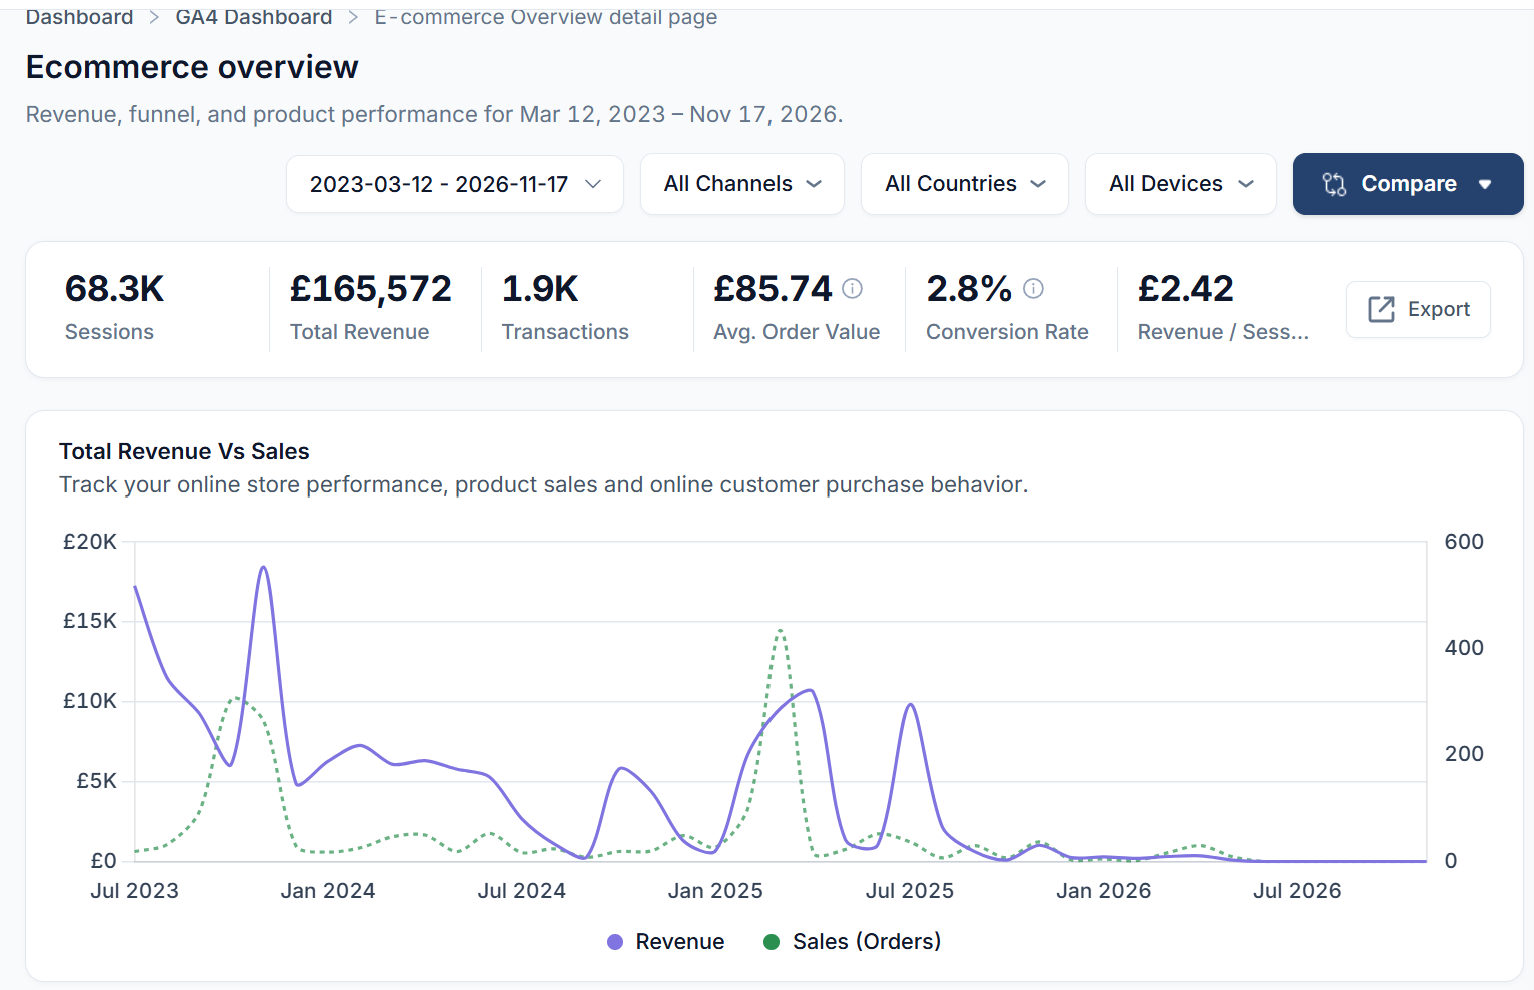 image
Follow Events & Goals into the purchase journey
On the overview, Events & Goals lists users, events and completion rate for recorded goals. Its View Details link opens the Purchase Journey section of Ecommerce overview. From Top 3 selling products, View All opens the product section of the same report.
Read the funnel in order: Sessions → Product Views → Add to cart → Begin to checkout → Purchase. Here only Sessions had data. Without recorded product views, the report cannot identify a checkout abandonment problem. On a populated store, inspect where the counts fall, then check Top Product Performance for views, units sold, revenue and purchase rate. Sales by Device & Countries lets you examine the mix by country or device.
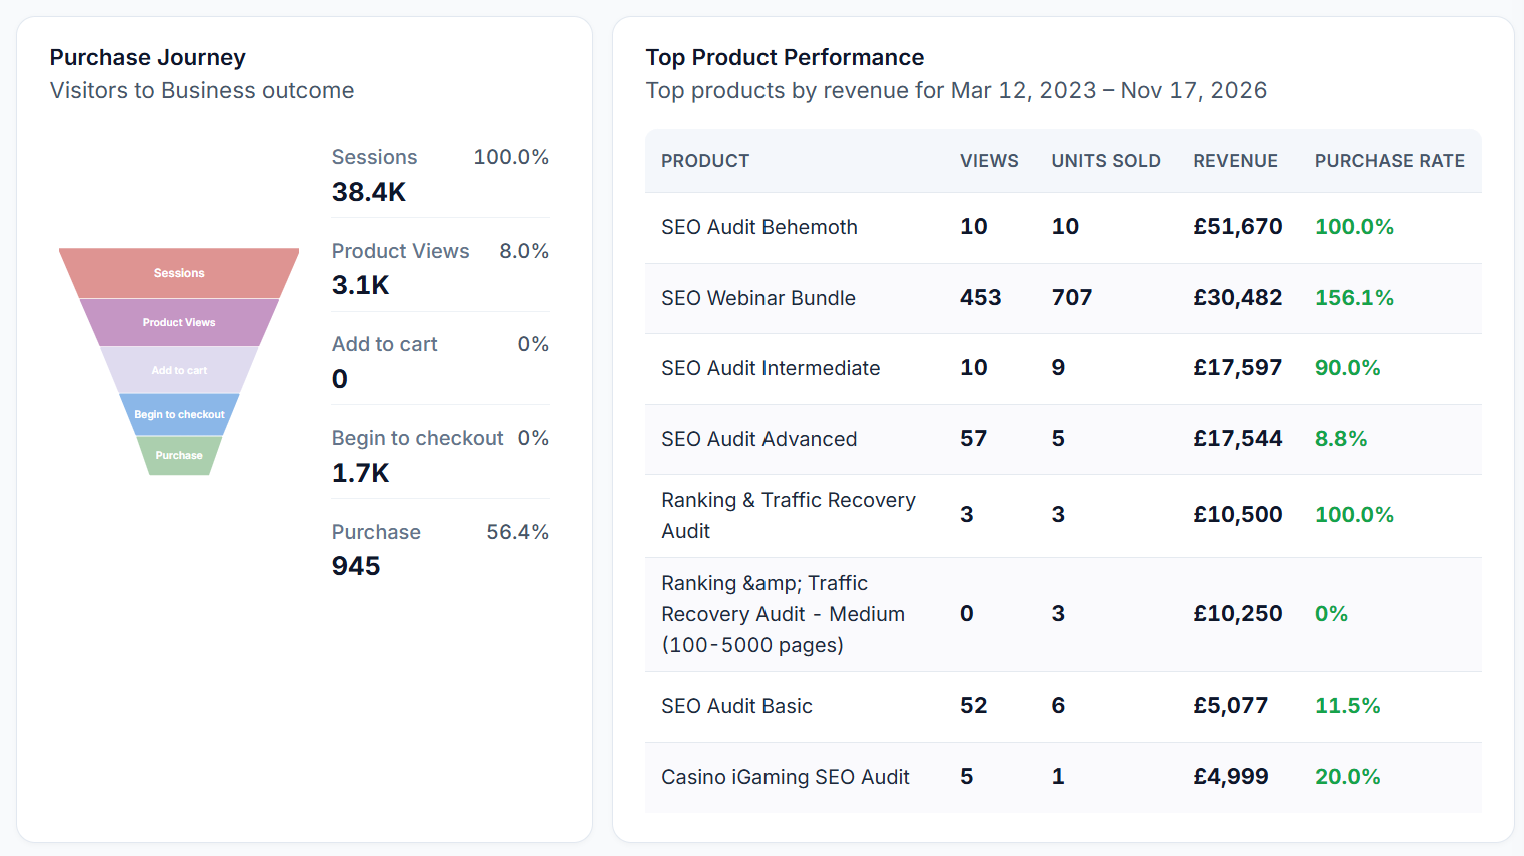 image
Open Top Landing Pages and choose a segment
From the overview, choose Top Landing Pages → View All. The report listed 205 landing pages, including 121 growing and 46 declining. Use Growing, Declining or High Engagement above the table to narrow the list. In this report, the declining-page recommendation defined a decline as a session decrease of more than 15% versus the previous period under the current filters.
The traffic-source selector was All Traffic Sources. Keep that scope in mind when you see an article growing. Its new visits could be coming from a newsletter or social post. To investigate organic traffic specifically, narrow the source first. A row labelled (not set) means the landing-page value was unavailable for those sessions.
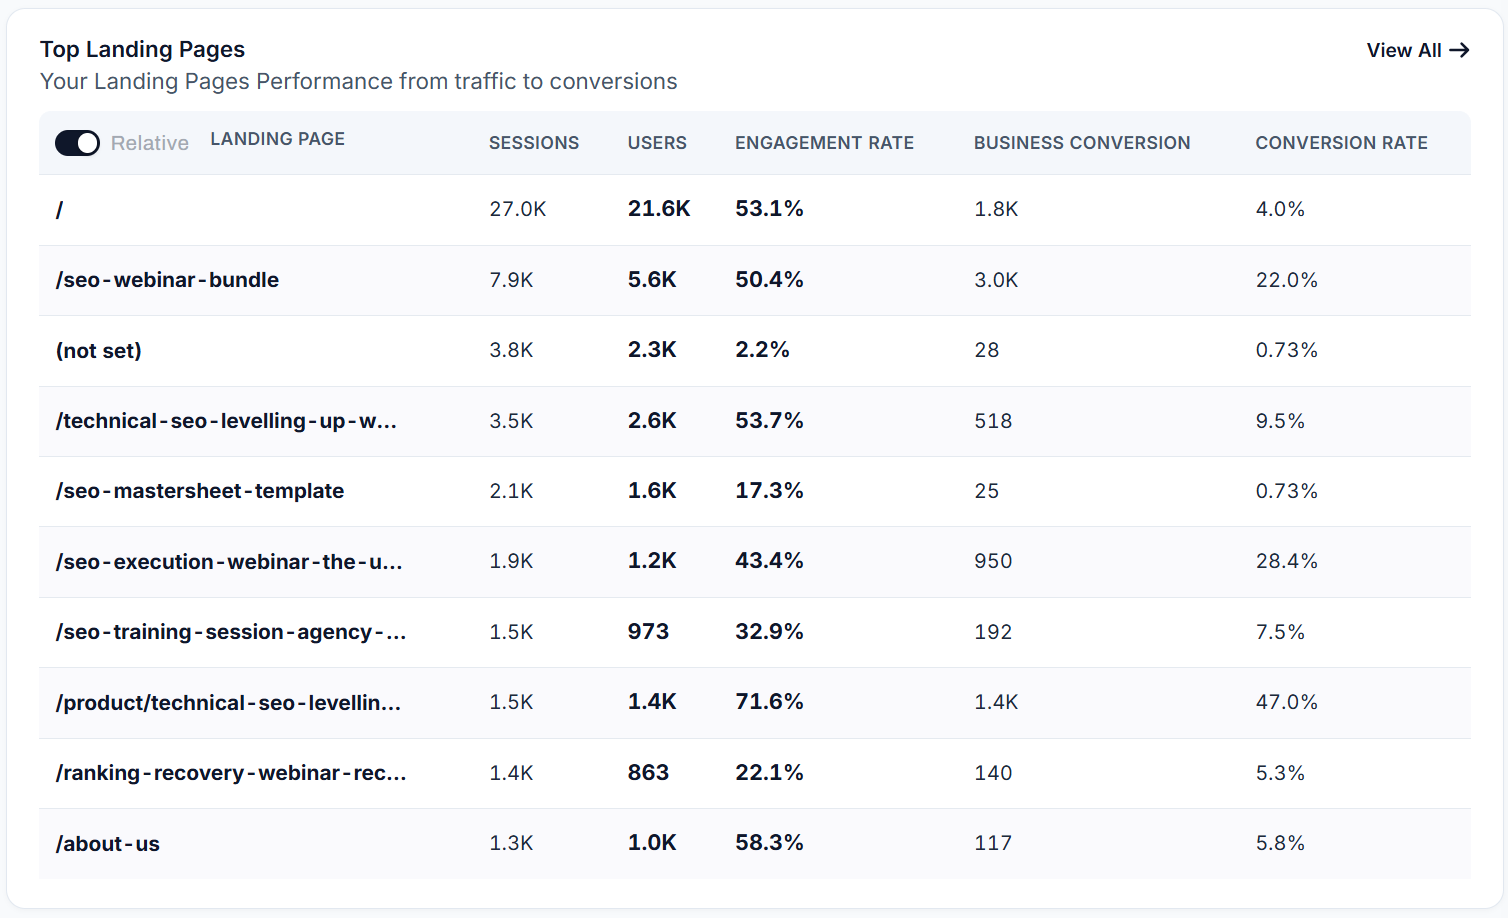 image
Open one landing page to explain where growth came from
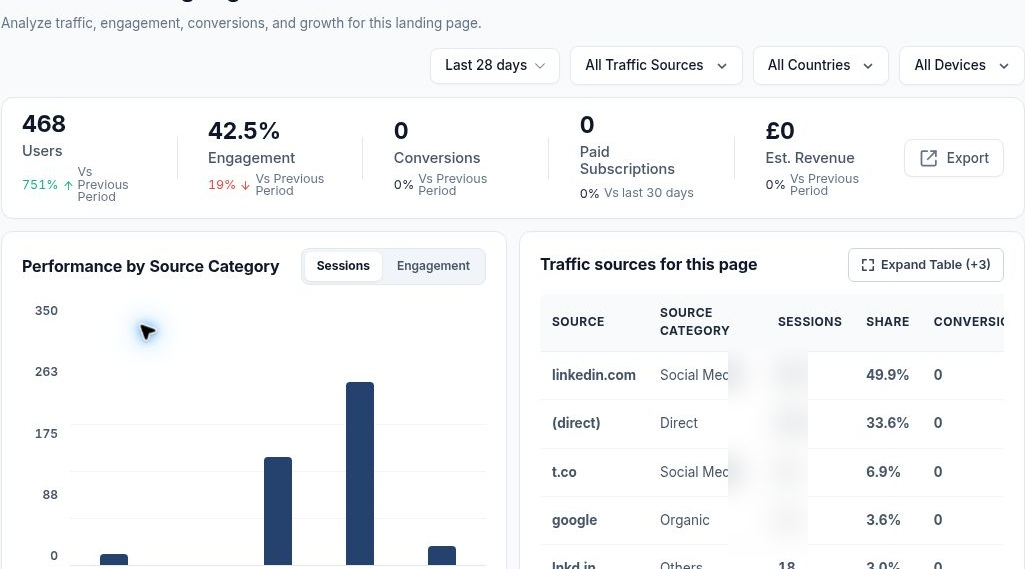
Select the manual-actions guide in the landing-page table. It received 605 sessions from 468 users with 42.5% engagement. In Traffic sources for this page, linkedin.com contributed 302 sessions (49.9%), Direct contributed 203 (33.6%) and Google contributed 22 (3.6%). Use Expand Table to see the smaller sources. LinkedIn alone supplied nearly half the visits, which changes how you would describe this article’s performance in an SEO report.
Switch Performance by Source Category between sessions and engagement to compare volume with visit quality. Then read Key conversions and the page funnel. This page recorded zero conversions. Inspect the intended conversion action and its GA4 measurement before concluding that the content failed to generate enquiries.
 image
Use search queries and recommendations to choose the next check
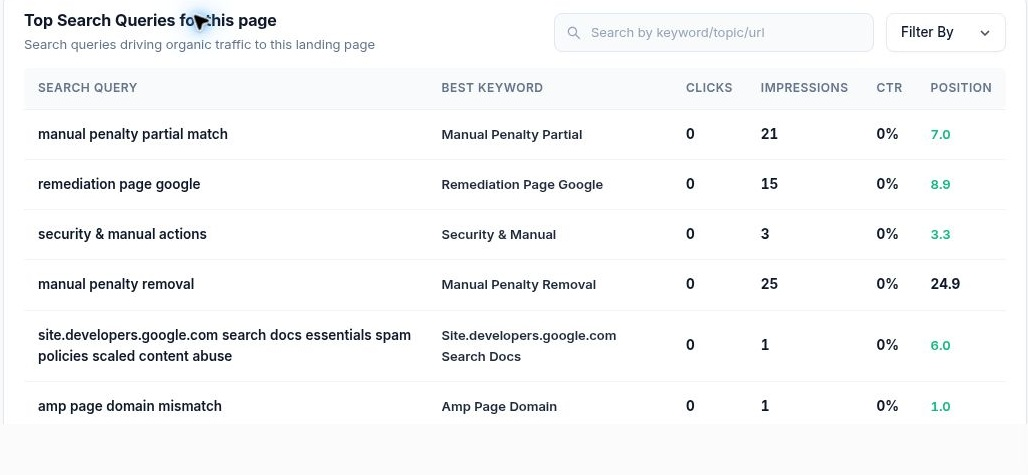
Scroll to Top Search Queries for this page for Search Console clicks, impressions, CTR and average position. The query “manual penalty partial match” recorded 21 impressions, zero clicks and average position 7.0. That describes one Google Search query. It cannot account for the 302 sessions the page received from LinkedIn.
AI diagnosis brings the page’s GA4 and Search Console findings together. Use Review Search Queries to investigate search exposure, or Optimize With Content Writer when the query evidence supports a content change. In this case, a clearer first check is whether visitors arriving from LinkedIn had a relevant next step and whether GA4 recorded it. For a sitewide review, the overview’s View Direct Landing Pages and Review Organic Landing Pages shortcuts take you back to the same investigation with a channel in focus.
 image
More in Getting started
Website Overview: review your SEO and AI visibility performance
Use Website Overview to review search performance, AI visibility and SEO health, then choose the right report for your next action.
ReadWebsites and Dashboard: choose a project and review your portfolio
ReadWhat is SEO Stack?
What the platform does, what it sits on top of, and what it is not.
ReadHow data warehousing works
Why Google's 16-month window exists, and what SEO Stack does about it.
Read