Diagnosing Organic Click Loss with URL Query Count
How to separate lost query coverage, ranking slippage and lower click-through from changing search results. Now, before you get into this article I made a video about query counting - it's 5
How to separate lost query coverage, ranking slippage and lower click-through from changing search results.
Now, before you get into this article I made a video about query counting - it's 5 minutes long, watch it, it explains what it is and how it works (yes this is the old SEO stack UI, I plan on recording a new one shortly).
Watch the video here:
As SEOs we've all been there, there's always that 1 website that despite everything seems to get a kick in the teeth from Google core updates. But, not all losses are equal, in fact, many of the click losses we see today tends to be from CTR erosion as opposed to more traditional reasons i.e. lost rankings / position slippage etc.
A fall in Google clicks can come from three different changes:
a page ranks for fewer queries, its queries slip to lower positions,
or the same search visibility earns fewer clicks.
or positions are lost altogether
SEO Stack’s URL Query Count Tool helps separate those patterns by counting Search Console queries for a URL and showing how the query set is distributed across position bands.
The Bulkco.co.uk example below shows why the position mix and click-through rate matter alongside the total.
Treat the tool as a diagnostic view, not a verdict about why Google changed. A stable query count does not prove stable rankings, and a falling click-through rate does not by itself prove that an AI Overview caused the loss.
How to use the URL Query Count Tool
Open SEO Workspace > Data Tools, choose URL Query Count Tool, select the project and enter the exact URL you want to diagnose. URL variants matter: confirm the canonical hostname, protocol, path and trailing slash match the page whose Search Console performance you are investigating.
• Choose a date range that includes the decline and a useful baseline. Use monthly resolution to see sustained movement and smooth weekly noise; switch to weekly or daily resolution to line a change up with a launch, migration or known event.
• Plot Total Queries with Clicks and Impressions, then turn on the position bands: 1–3, 4–10, 11–20, 21–30 and 31–100. Toggle lines to make the trend readable. The chart can use separate axes, so read the values and units rather than comparing line heights as if they shared one scale.
• Inspect the month matrix and query rows. Look for queries that disappeared, moved from the top three into lower bands, or kept their impressions while losing CTR. Query rows provide clicks, impressions, CTR and average position for drilling into individual terms.
• Add a URL annotation for the change you made and use the algorithm update overlay as timing context. An update marker is a clue to investigate, not evidence that the update caused the movement.
Tool reference: SEO Stack URL Query Count describes the position-band chart, month matrix, query detail and annotation workflow.
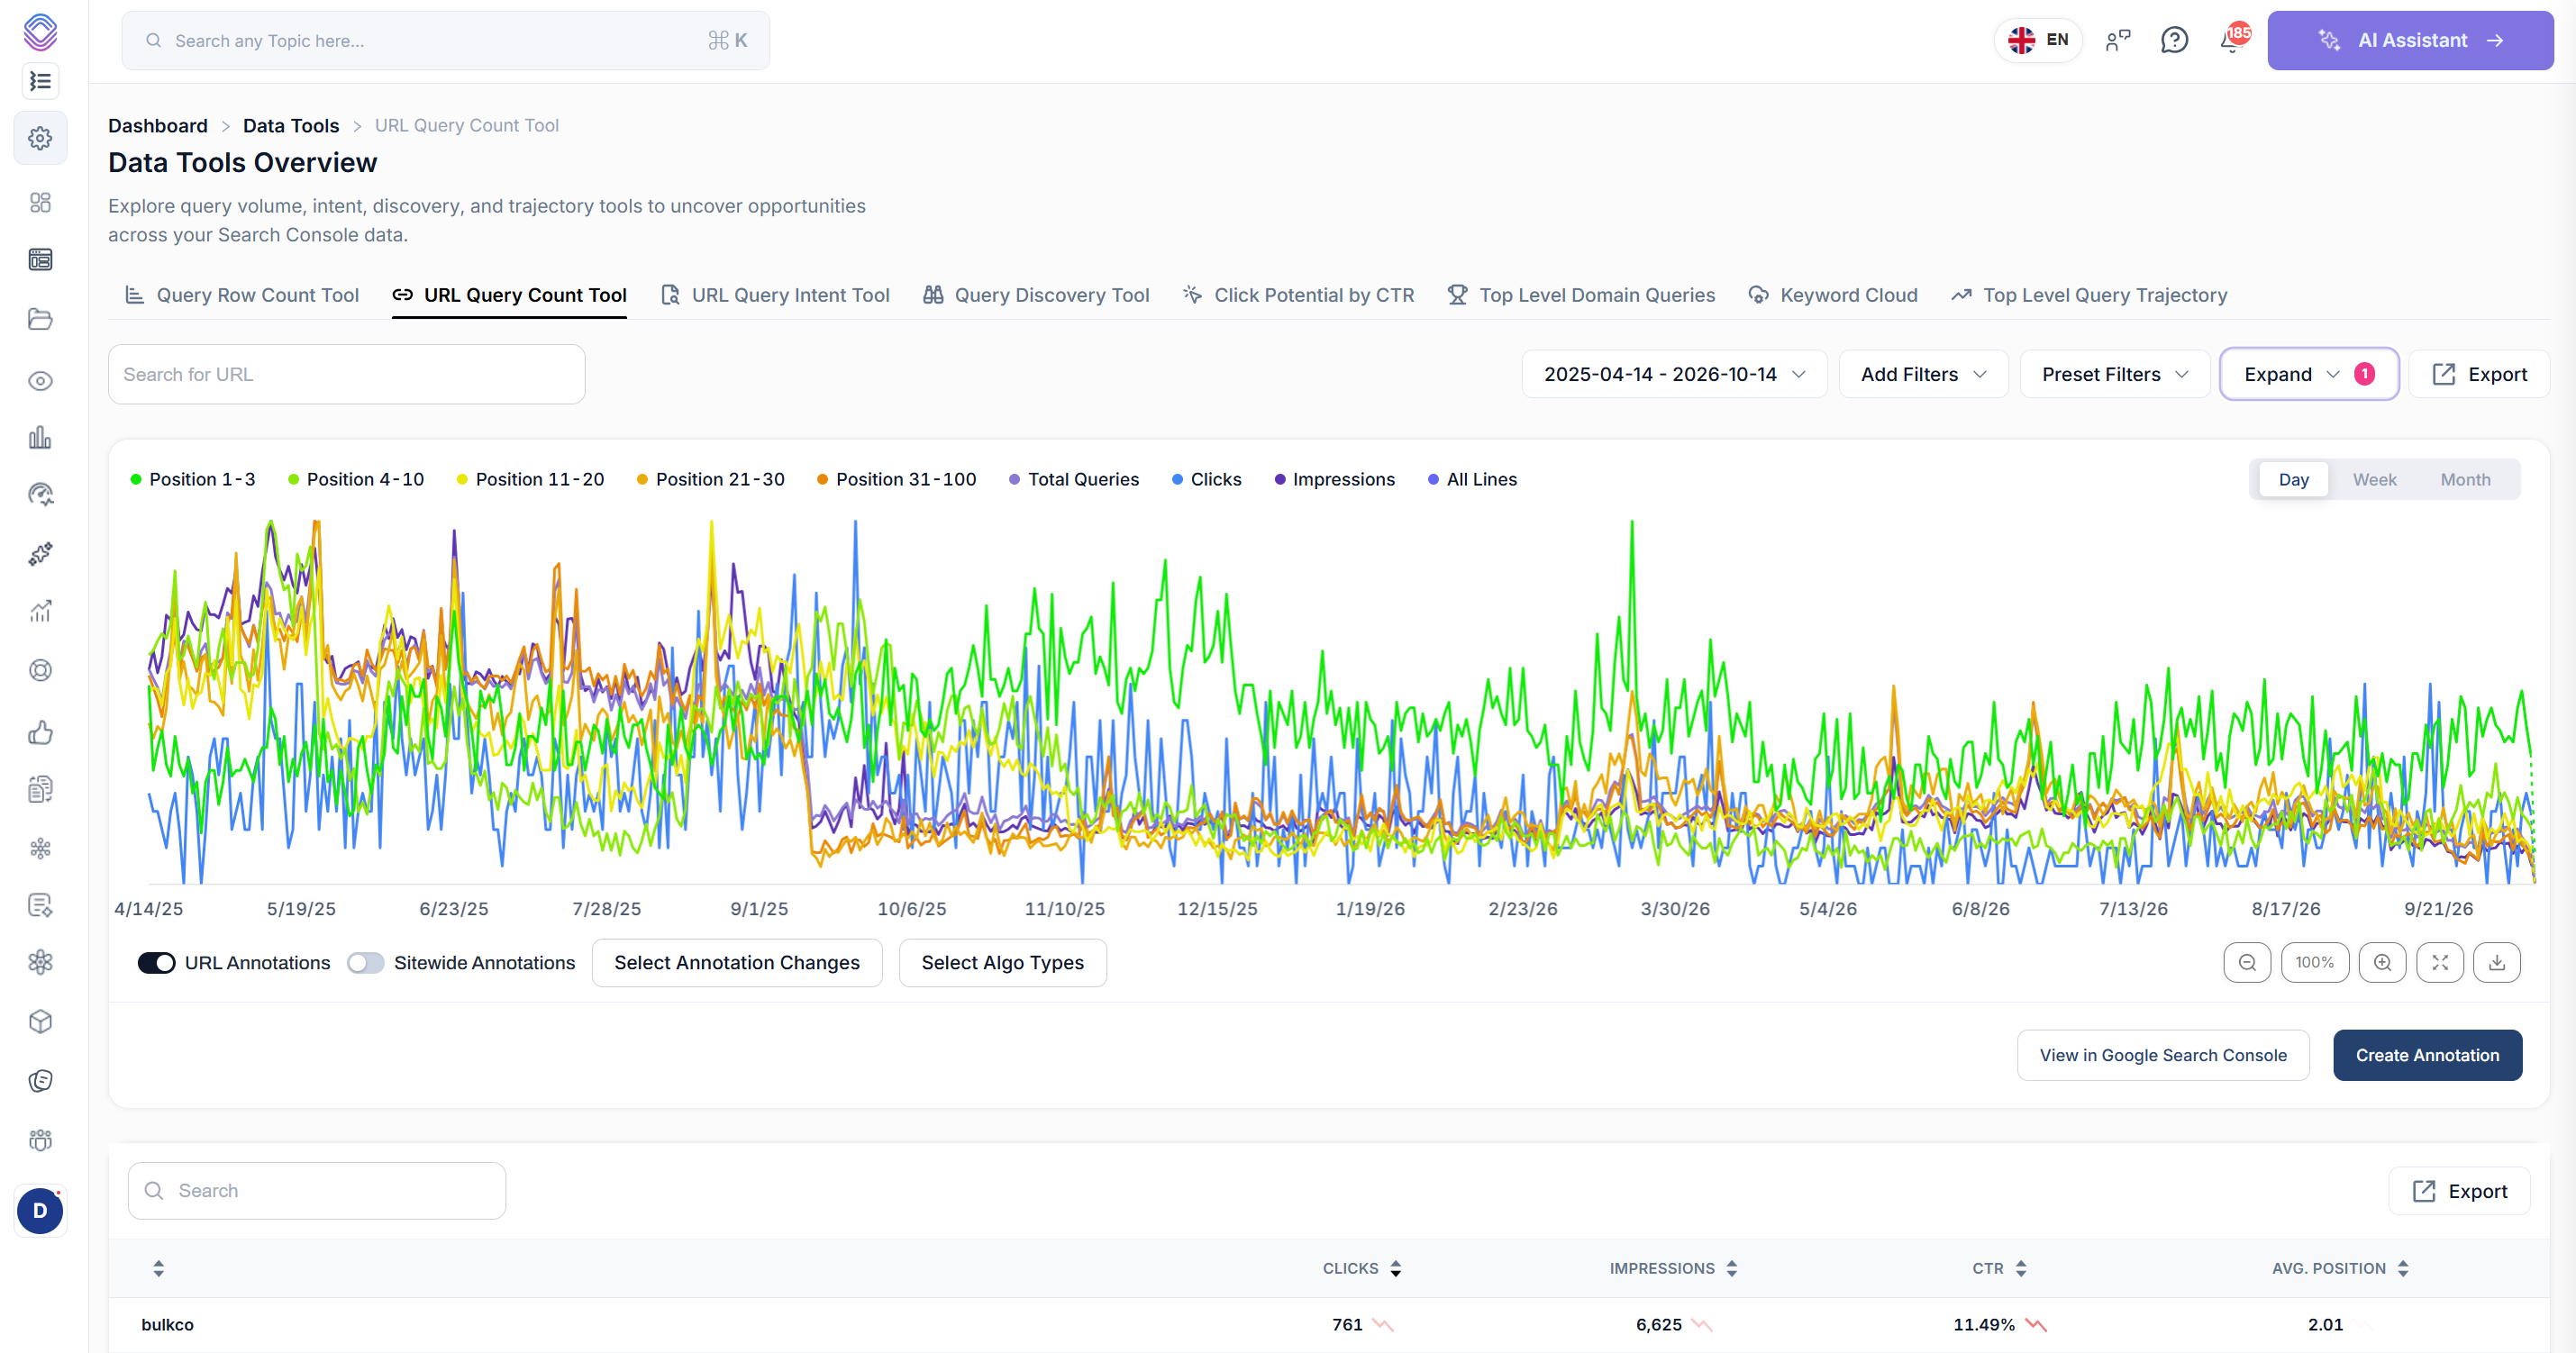
Bulkco.co.uk snapshot and what it shows
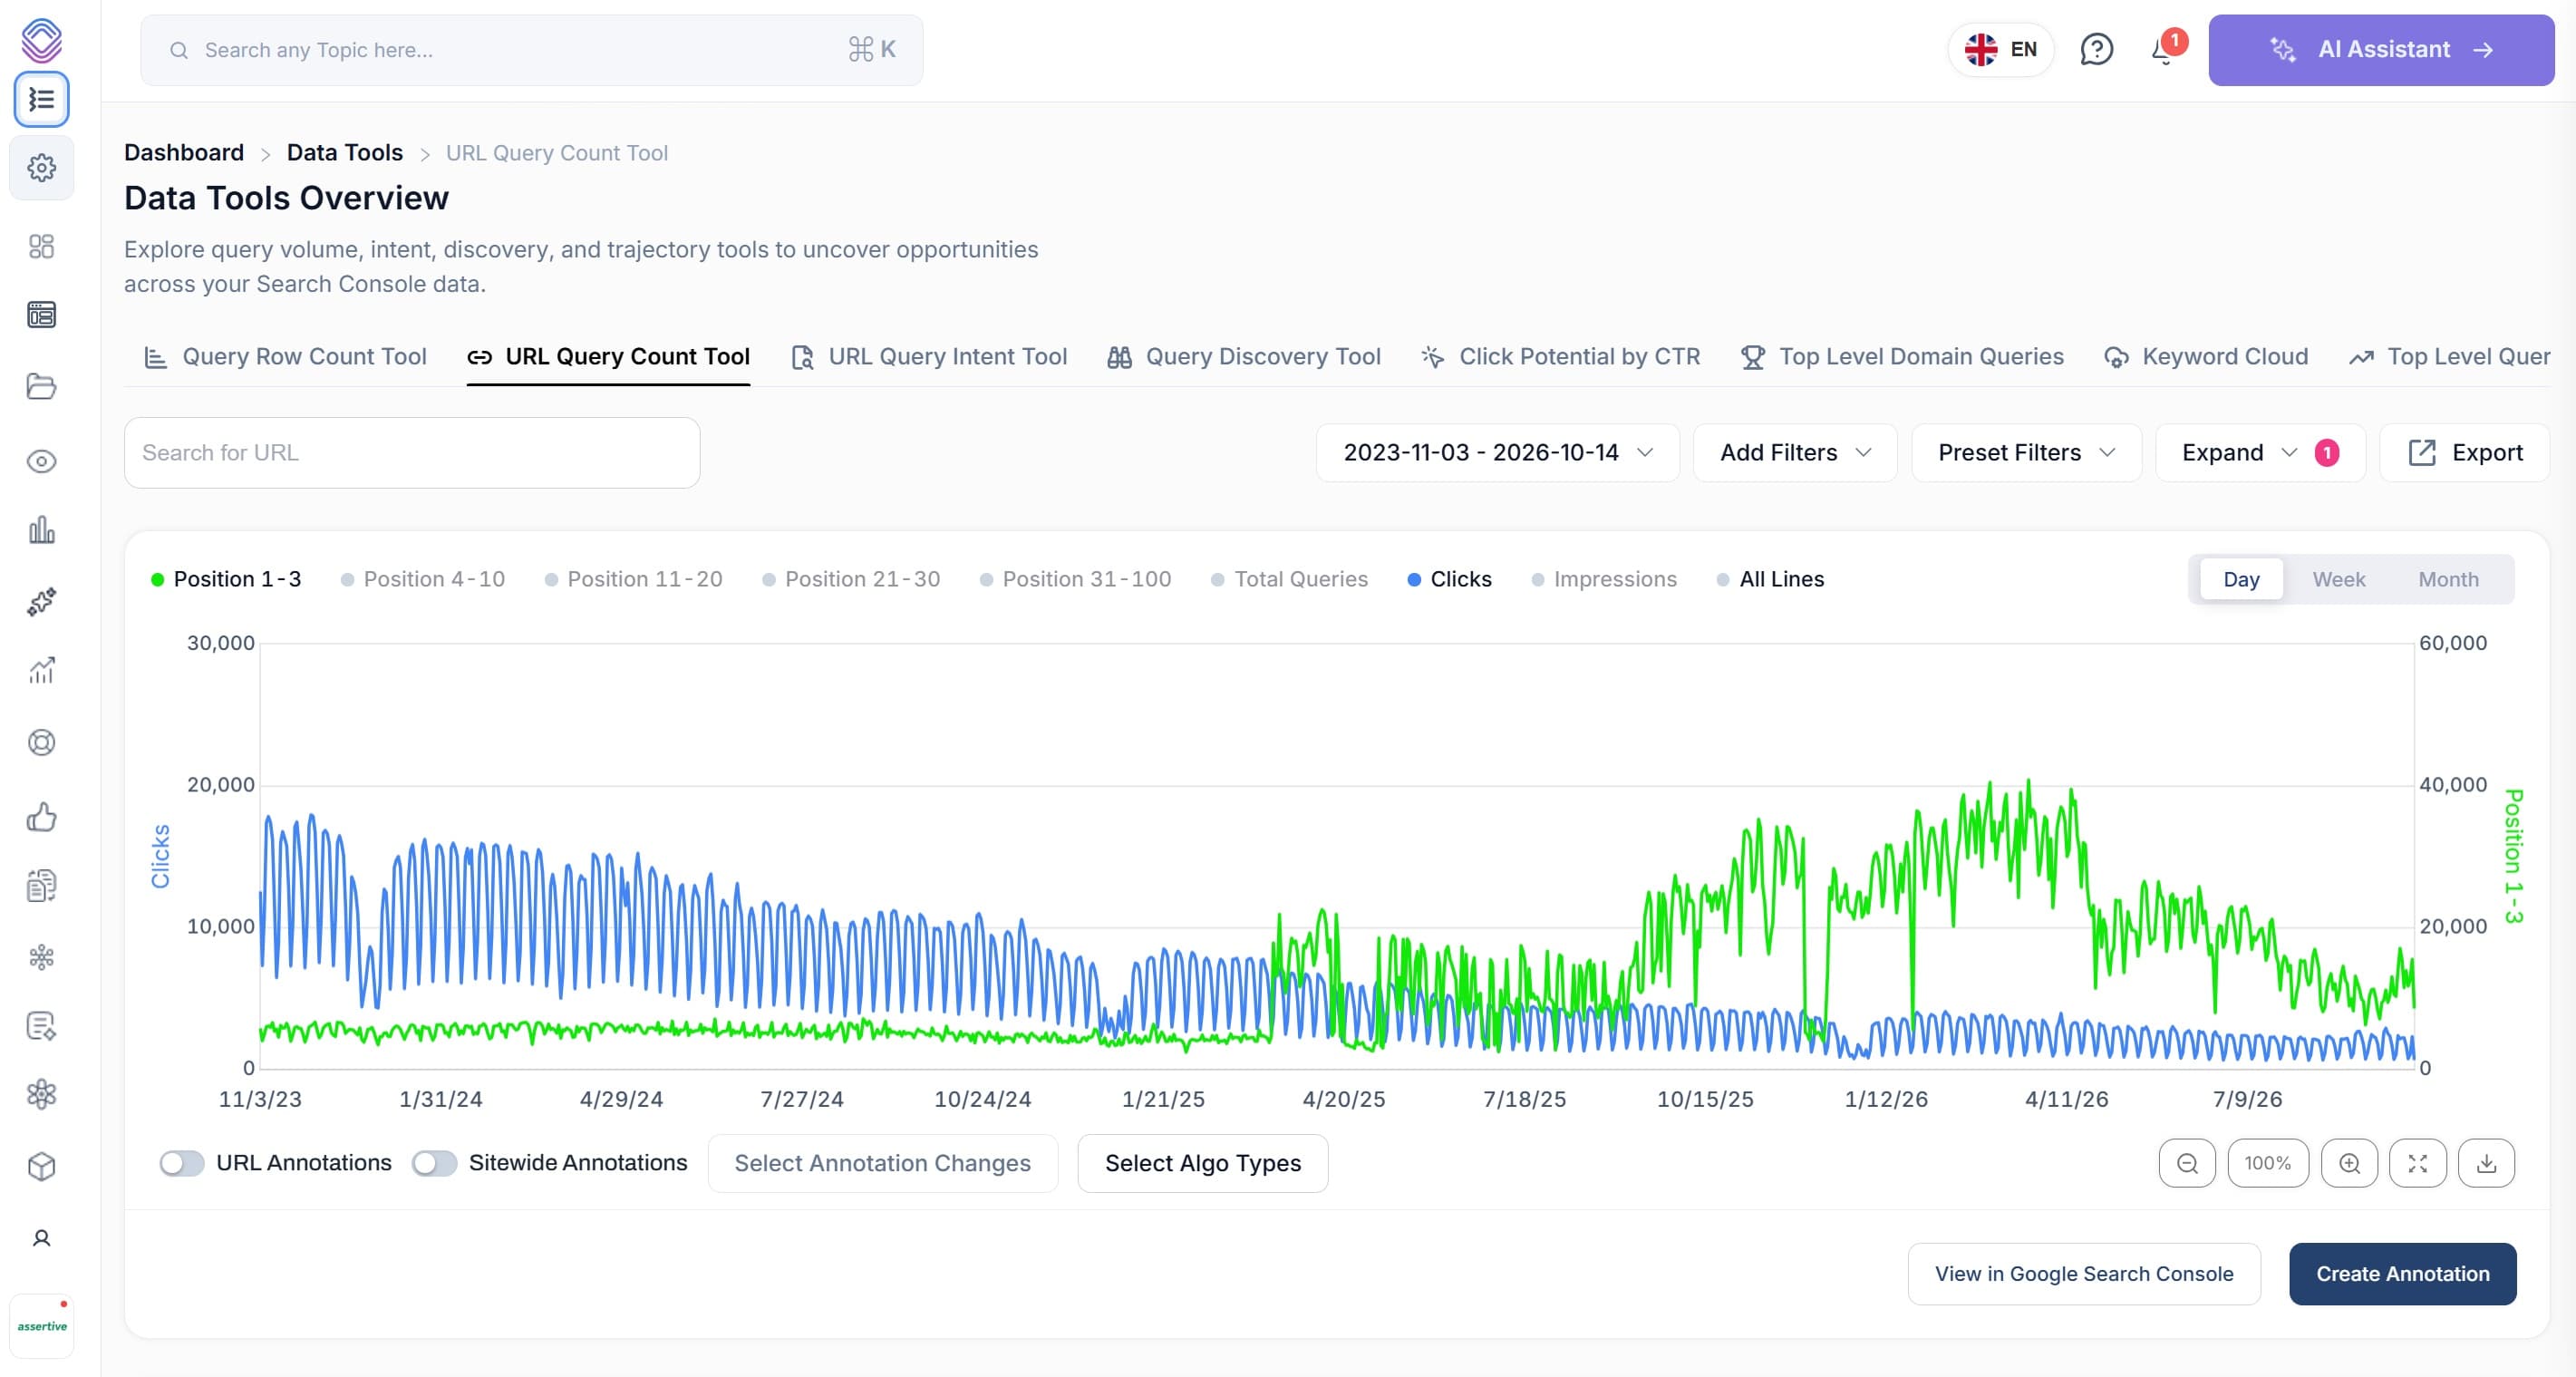
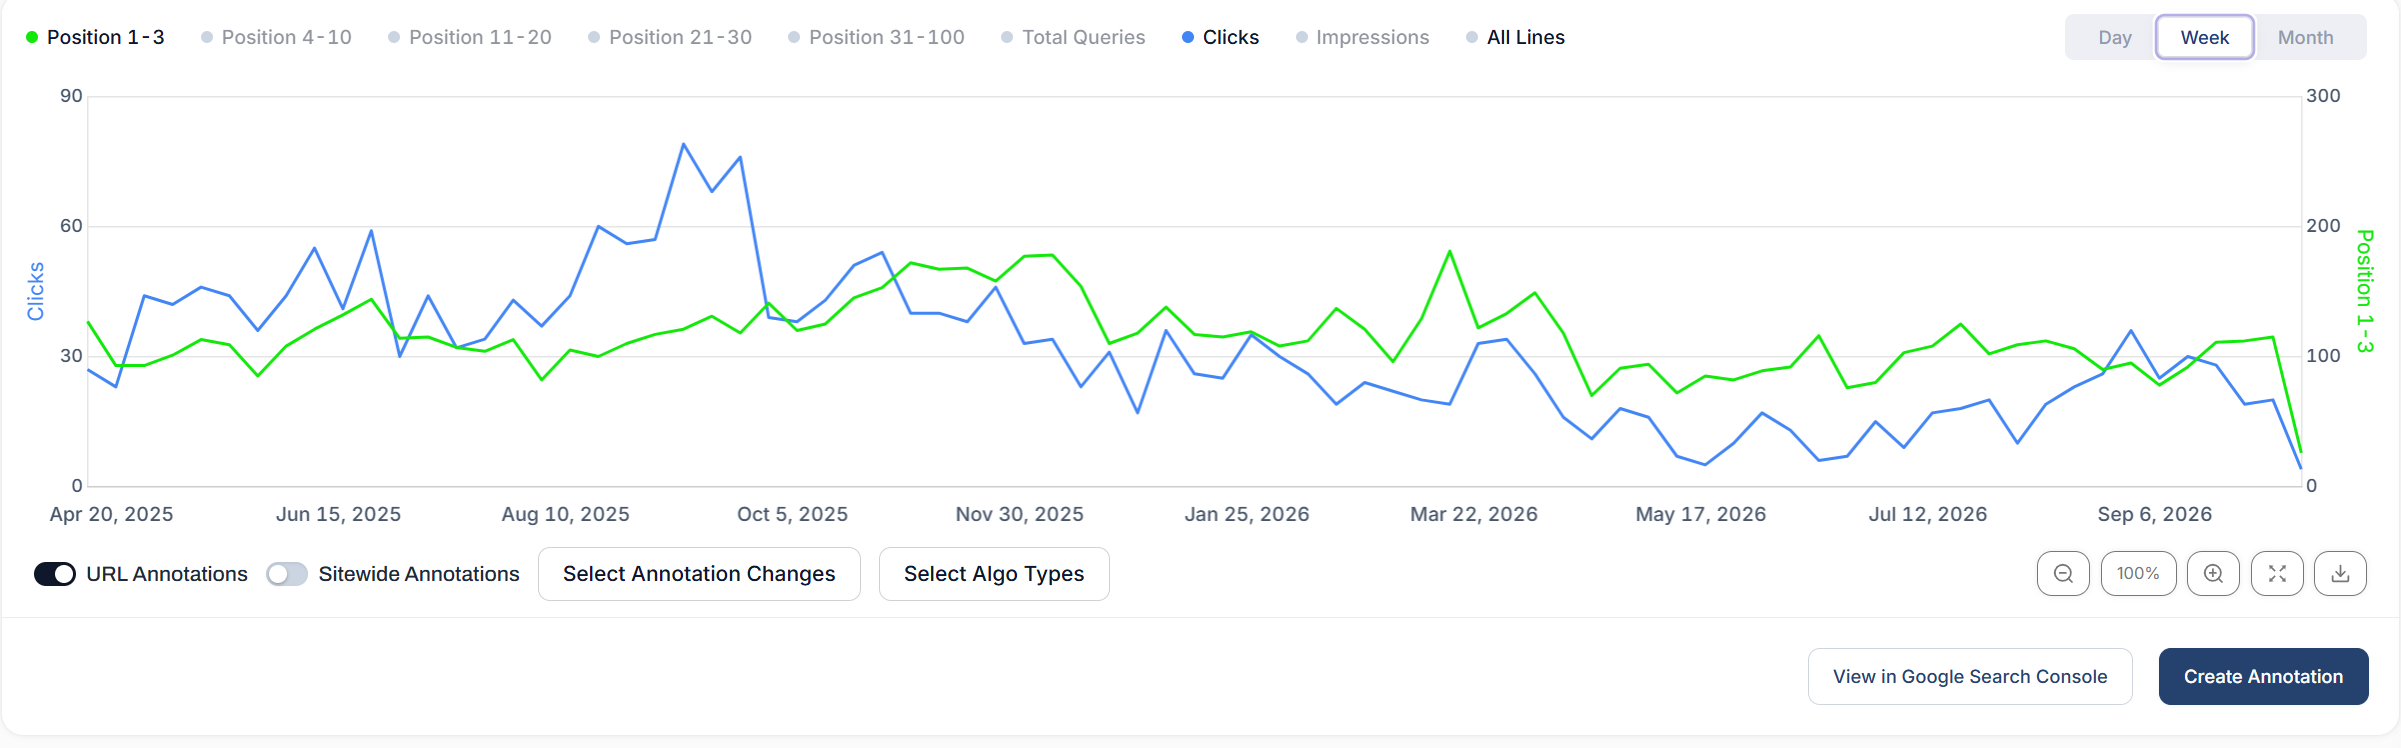
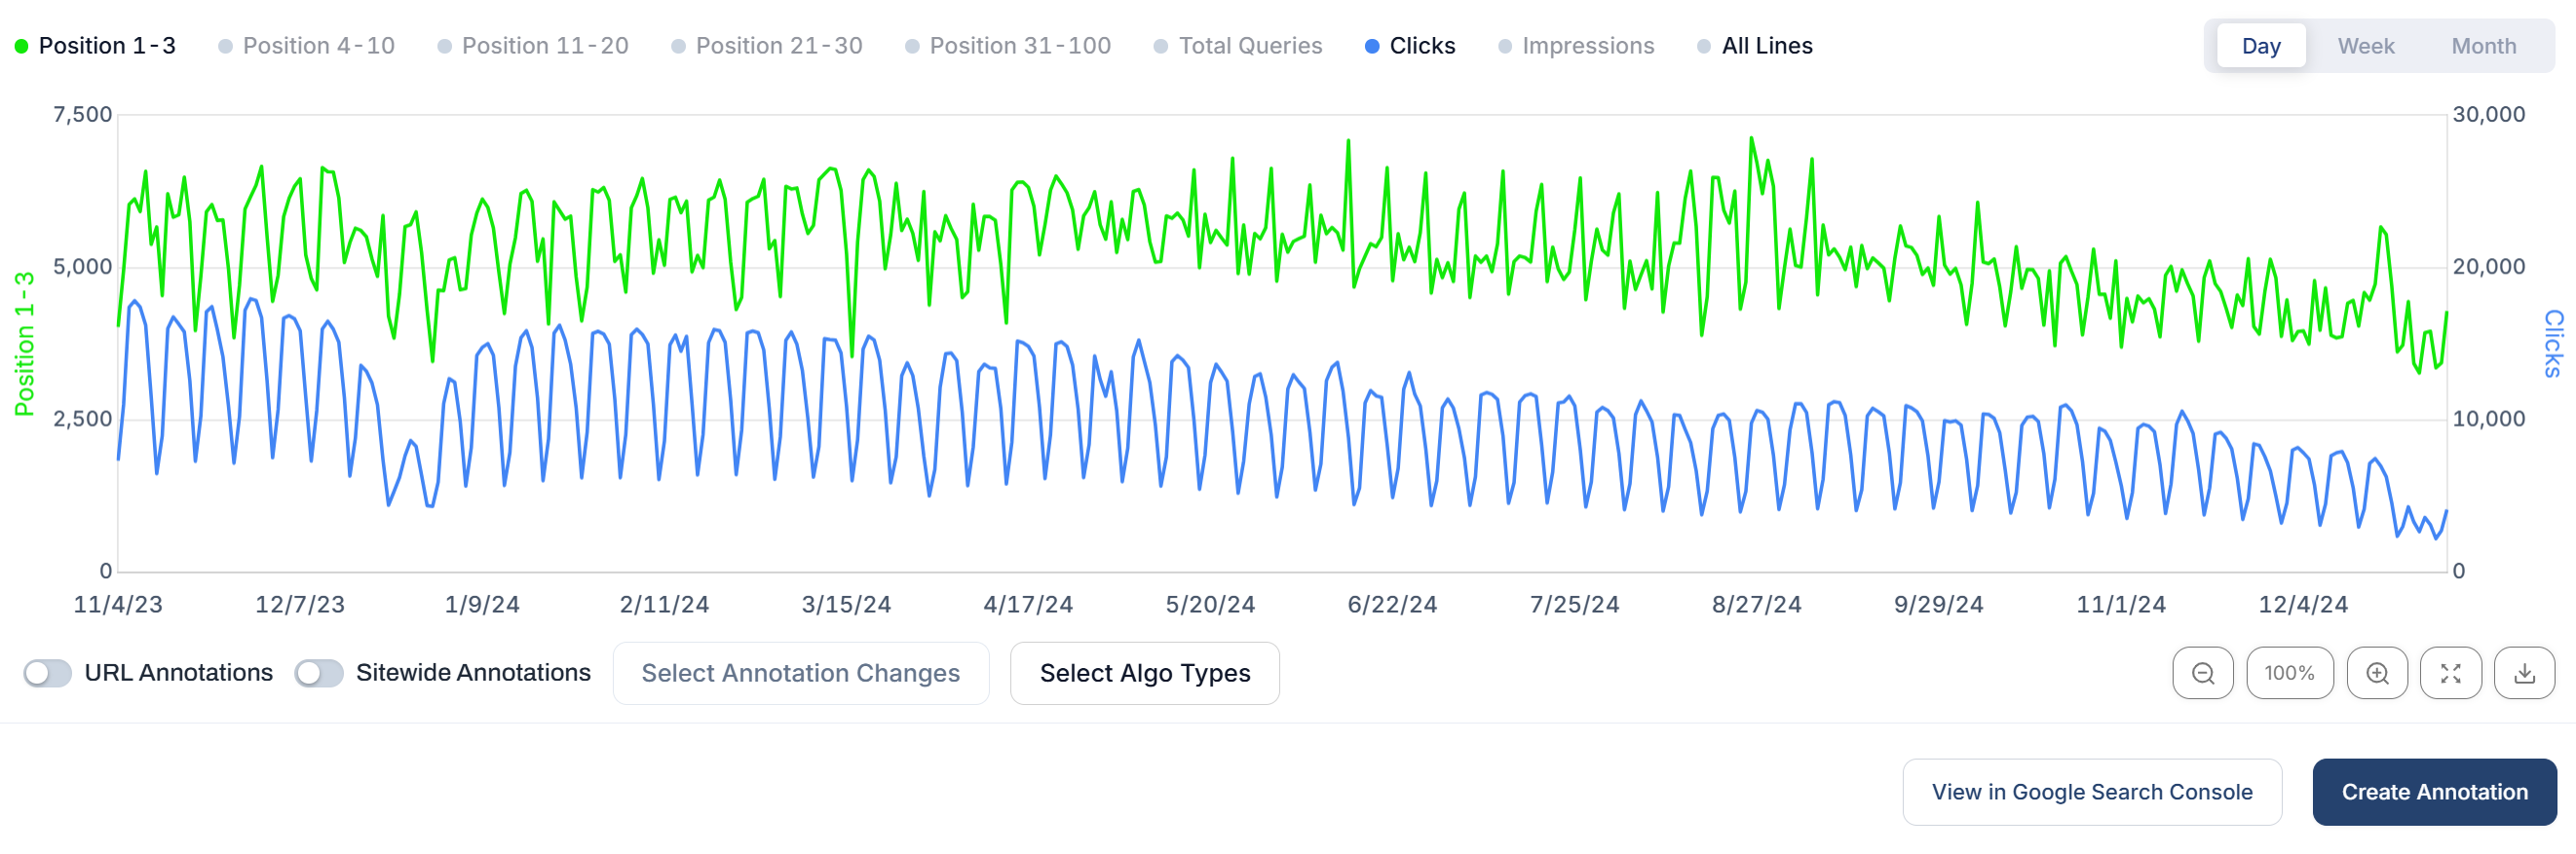
The screenshot is the URL Query Count view for https://www.bulkco.co.uk/, with a selected date range of 1 February 2023 to 14 October 2026 and daily resolution. The visible chart plots Position 1–3 in green and Clicks in blue. Both series are volatile, but the plotted data visibly stops around May 2025 even though the selected range continues later. The query matrix available at capture also ran through May 2025, so later months are a data-coverage gap in this view, not evidence that performance stayed at zero.
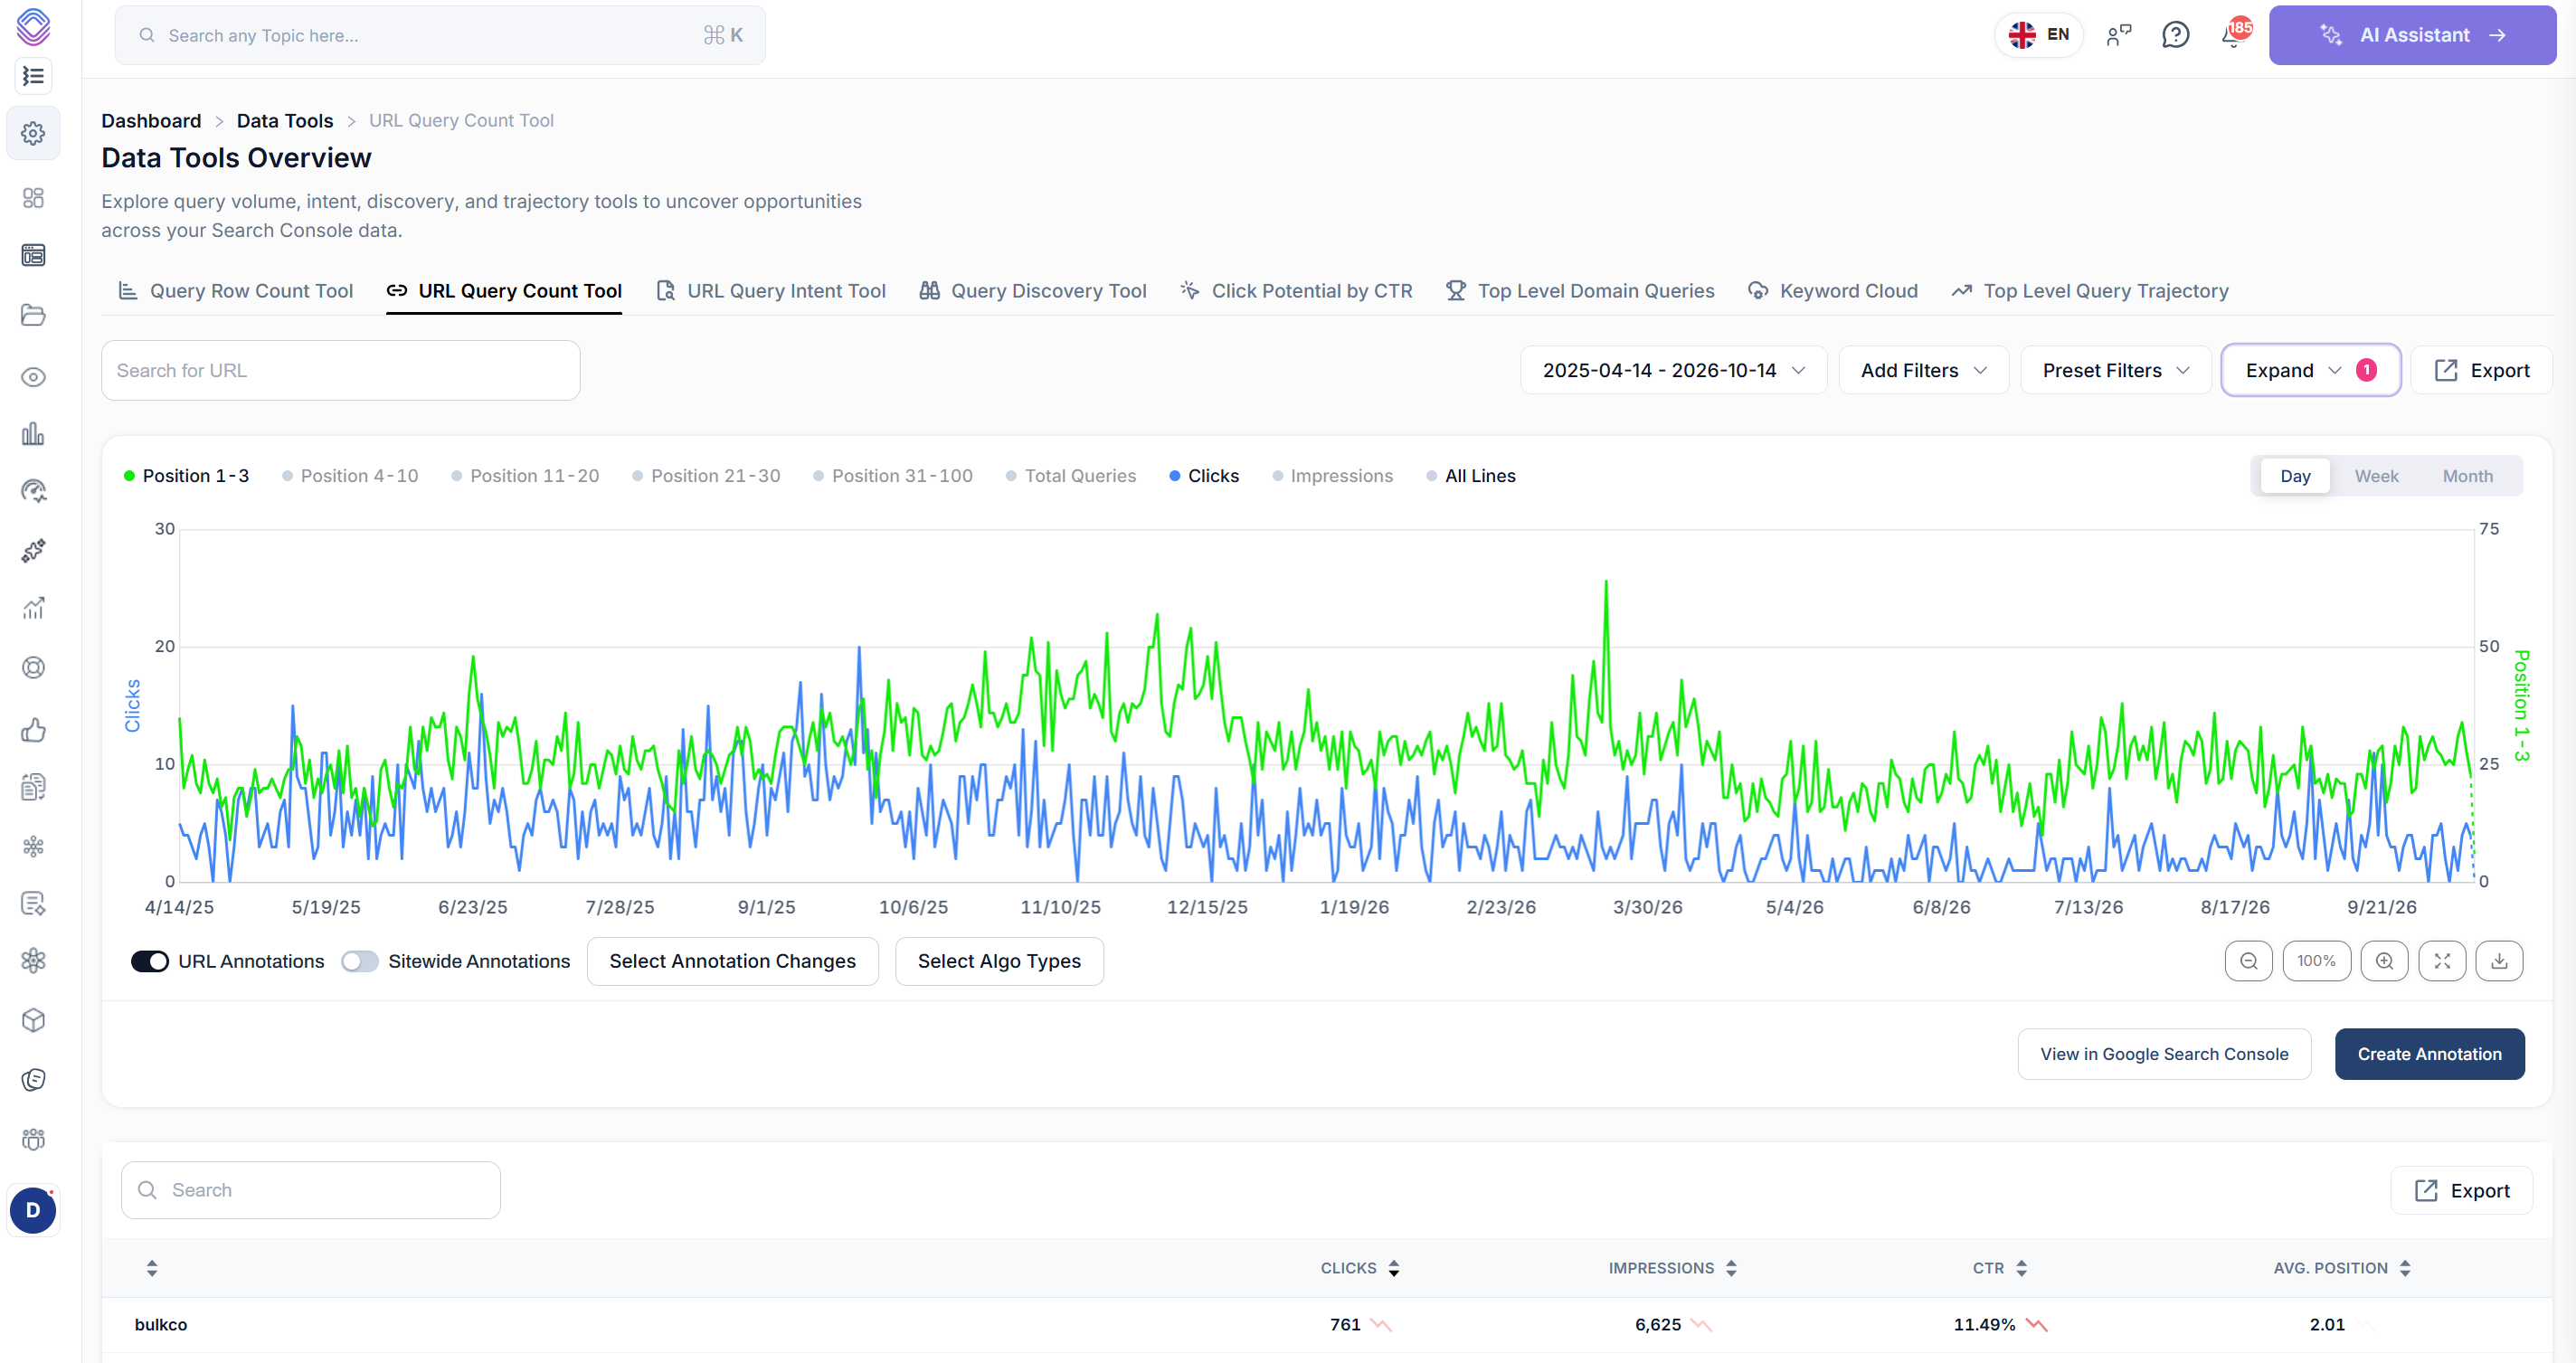
Snapshot note: Only the top-three band and clicks are selected in this chart. The monthly values below came from the tool’s matrix; CTR is calculated as clicks divided by impressions.
A year-on-year comparison points to slippage
January 2024 compared with January 2025 keeps the calendar month constant. Bulkco’s total query count increased while clicks more than halved. The position mix changed at the same time: top-three queries fell sharply, and several lower bands grew.

This is not the pattern of a simple loss of query coverage: the total grew by 12%. It is stronger evidence of ranking slippage and weaker click yield together. Position 4–10 moved from 449 to 419, while 11–20 rose from 251 to 396, 21–30 from 117 to 200, and 31–100 from 527 to 676. That widening lower-position footprint supports the slippage reading. CTR also fell from 2.85% to 1.11%, so a change in the search results may have contributed, but these aggregate figures cannot identify AI Overviews as the cause.
For a stronger test, compare the same query cohort across both periods. A different mix of branded, product, informational or seasonal queries can change the aggregate CTR even if individual snippets perform similarly.
A later collapse looks like lost reach as well
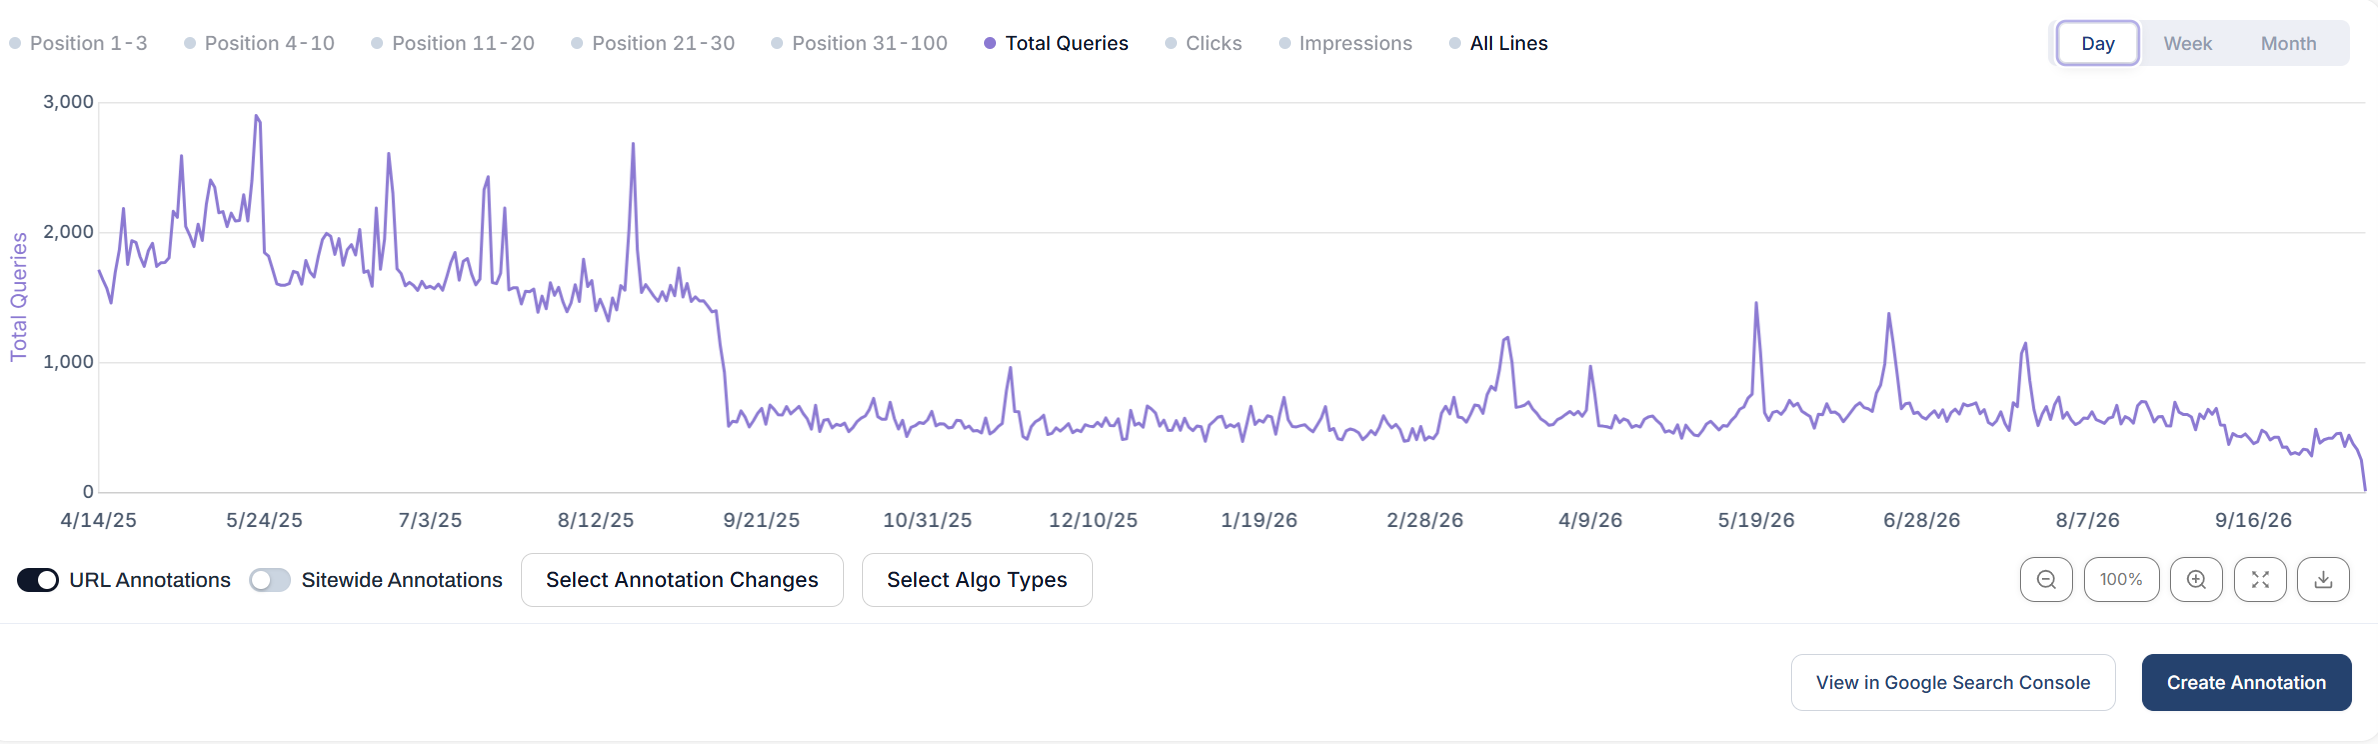
From February to April 2025, query coverage, top-three visibility, impressions and clicks all contracted. May recovered part of that loss, but one month is not enough to call it a sustained recovery.
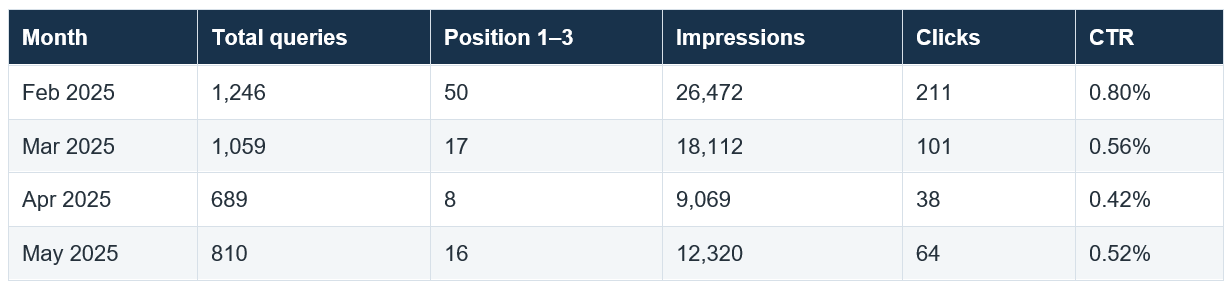
Between February and April, total queries fell 44.7%, clicks fell 82.0%, impressions fell 65.7%, and the top-three count fell 84.0%. That combination points to a broad visibility decline, with the steepest loss at the top of the results.
Possible explanations include ranking loss, demand changes, technical or URL changes, or content devaluation; this chart alone cannot distinguish them.
From April to May, queries rose 17.6% and clicks 68.4%, but both remained well below February. Check canonical and indexation changes, internal links, competing URLs, site releases, demand and algorithm timing before deciding what to revise.
Read band counts carefully In Bulkco’s monthly matrix, position-band counts are not additive to Total Queries. This is consistent with a query appearing in more than one band during a month as its rank moves. Compare the direction of each band and inspect query rows; do not sum the bands to reproduce the total.
Four patterns and the next investigation
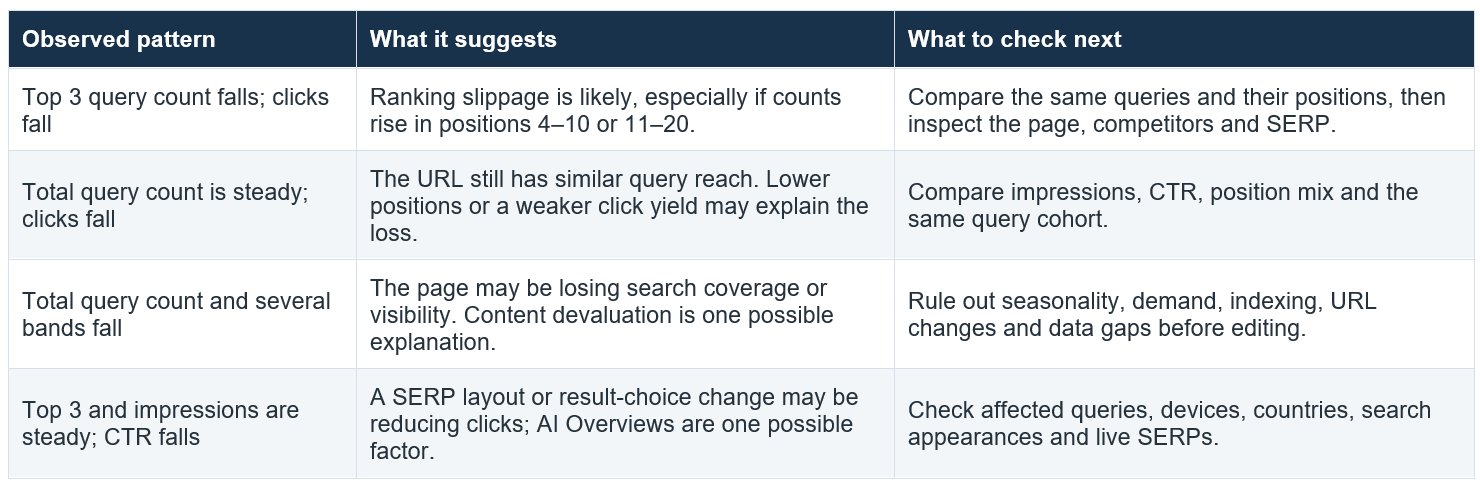
When positions 1–3 and clicks both fall
Start with ranking slippage. Check whether the same queries moved into positions 4–10 or 11–20. If those bands rise, queries may have slipped rather than vanished. If lower bands also fall, the URL may have lost reach altogether. Query-level comparisons show which terms moved and whether one intent group or page section is responsible. Review the page’s relevance, freshness, internal links, competing pages and current SERP before making changes.
When total queries stay level but clicks fall
A stable total means the page still appears for a similar number of query rows; it does not mean those queries held their rank or search demand. Compare impressions and CTR, then compare position-band counts and individual queries. Stable impressions and stable positions paired with lower CTR point toward reduced click yield. A shift in branded versus non-branded terms, device mix or country mix can also lower aggregate CTR.
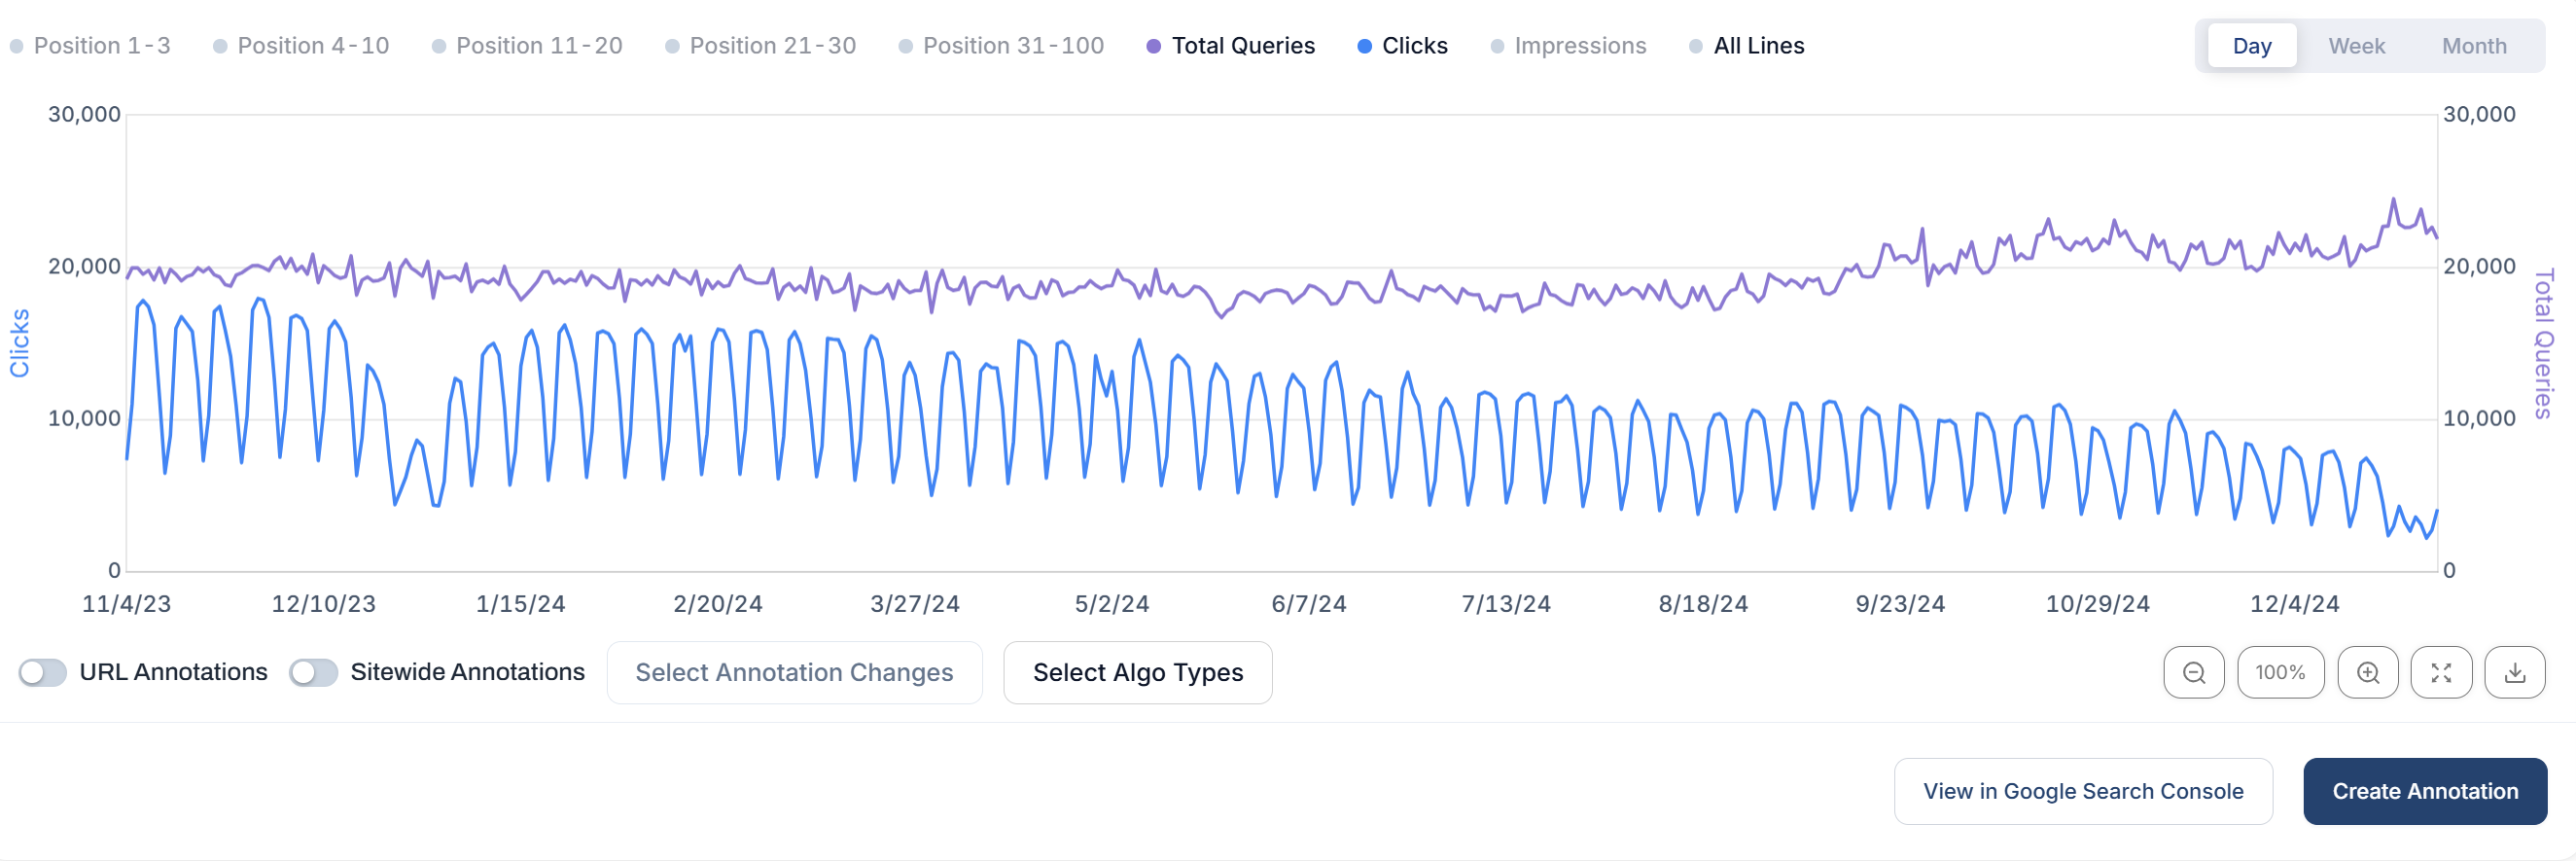
When total queries enter a sustained decline
Treat this as possible coverage loss or content devaluation, not as a diagnosis by itself. Check whether the fall is concentrated in lower bands, suggesting broadening visibility has been lost, or whether even top positions disappeared. Rule out seasonal demand and query anonymisation, then verify indexing, canonicalisation, redirects, status codes, page moves, overlapping URLs and Search Console data coverage. Compare against algorithm update dates and site changes, but do not infer causation from timing alone.
When positions 1–3 hold but clicks fall
AI Overviews and other SERP features are plausible contributors if the same queries and impressions remain while CTR declines. Inspect the exact queries and live results on the affected device and location. Look for AI Overviews, ads, shopping units, local packs, featured snippets, People Also Ask, video and image blocks. Review Search Console by search appearance, device and country where available.
Google’s current GenAI Performance report exposes impressions for AI Overviews and AI Mode by page, country, device and date; it is useful as an exposure signal, but the report’s documented metric is impressions, not a direct explanation for lost clicks. Google also documents that an AI Overview can occupy one position and that a click on an external link within it counts as a click. So a stable average position neither rules out a changed SERP nor proves an AI Overview caused the CTR decline.
See Google’s GenAI Performance report documentation and its Search Console performance metric definitions for current reporting details.
Make a change, annotate it and measure patiently
Use annotations to turn the chart into a decision record. Before changing a page, save the baseline: date range, query count, position-band counts, clicks, impressions and CTR. Record the URL, date, what changed and why. Keep unrelated changes separate where practical so the next movement is easier to interpret.
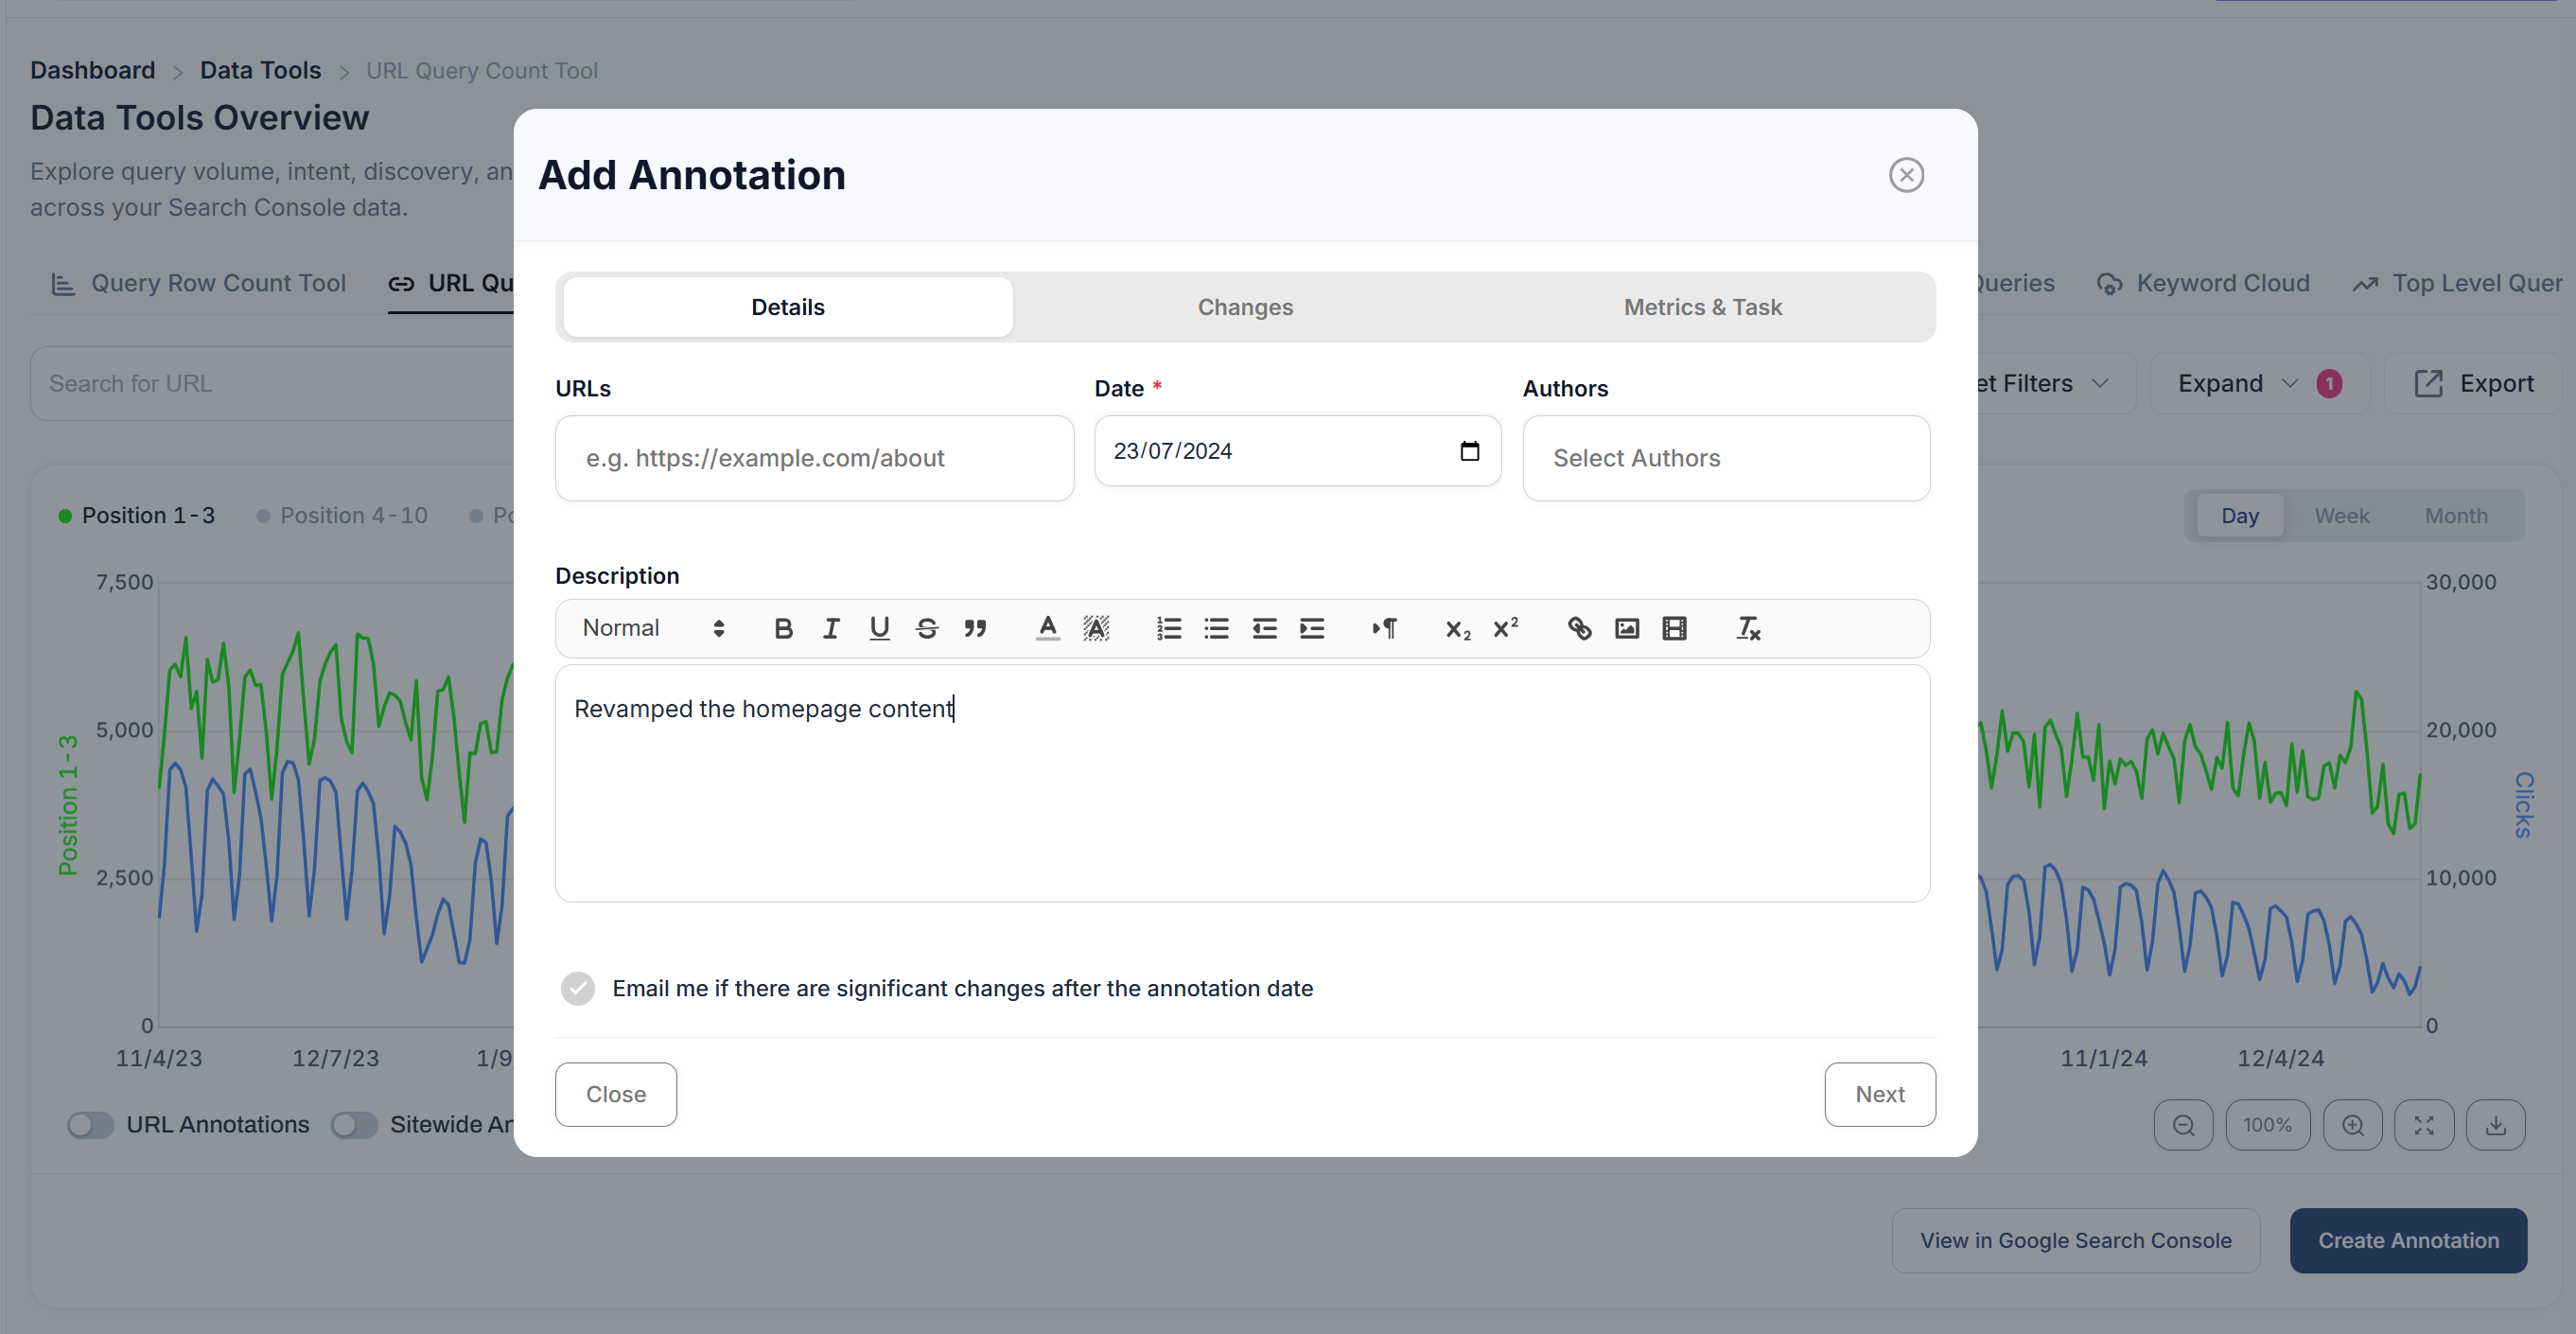
• Make the change that fits the evidence: restore missing coverage or resolve a technical issue for a broad query decline; improve relevance and page support for a ranking slip; test titles, snippets or page value when positions and impressions hold but CTR weakens.
• Wait for Google to recrawl the page and for a complete follow-up period. Use monthly data for the main read and weekly or daily data only to understand timing. Compare similar calendar periods when seasonality matters.
• Recheck total query count, position bands, clicks, impressions, CTR and the affected query cohort. Record whether the expected signal improved, stayed flat or worsened.
• Avoid declaring success or failure from one short, noisy interval. Keep the annotation even when the result is neutral; that history makes later tests more useful.
Search Console data is not a complete census of every search. Google omits some rare or anonymised queries, may retain only top rows, and commonly reports with a short delay. Daily data uses the property’s local time zone. Use the same filters and data type in both periods, and treat small changes cautiously. See Google’s Search Console data guidance and Performance report guide.
Search Console data guidance · Performance report guide
Ask the AI Assistant to evaluate the impact
Give the assistant a URL, a comparison window and a specific annotation. Ask it to separate what the data shows from what might explain it, and to note any missing evidence. For example:
Prompt For [URL], compare the 28 days before and after annotation [name/date]. Did total queries, queries in positions 1–3 and 4–10, clicks, impressions and CTR move together? Separate observed facts from likely cause. Check algorithm updates and call out seasonality and data coverage.
Prompt For [URL], clicks are down while total queries and position 1–3 are stable. Compare query-level CTR, impressions, device, country and search appearance where available. Does the pattern support SERP feature or AI Overview click loss, and what evidence is still missing?
A good readout should show the date windows and metric deltas, list the queries driving the change, distinguish an observed pattern from a causal claim, and propose the next check. An AI Overview explanation should stay a hypothesis unless the affected query and SERP evidence support it.
Use MCP for repeatable agentic analysis
MCP is useful when you want an assistant to fetch the same evidence every time, compare several URLs or evaluate annotations over a longer period. In SEO Stack’s MCP connection, a practical read-only sequence is:
• List My Websites to identify the Bulkco property and the Search Console data index to use.
• Get Search Console Min Max Date to confirm the available data range before comparing periods.
• Get Metrics Over Time for the URL at monthly resolution, including query count, position bands, clicks and impressions.
• Use Get Search Console Data Comparison for a year-on-year or pre-change/post-change comparison.
• Use Get Search Console Metrics Aggregated By Two Dimensions to inspect query with page, device, country or search appearance where supported; query plus page can also reveal URL overlap.
• Fetch Get Annotations and Get Algorithm Updates to add timing context to the metric changes.
Ask the agent to return a compact evidence ledger: the periods compared, absolute and percentage changes, queries gained and lost, position-band movement, CTR and impression changes, annotations or updates nearby, a classification of coverage loss / slippage / CTR effect / mixed, a confidence level, and the next test. If the initial date check shows a gap, have the agent stop the comparison and report the gap instead of treating missing months as zero.
MCP prompt Analyse https://www.bulkco.co.uk/ for January 2024 versus January 2025, then February to May 2025 month by month. First validate the available Search Console dates. Return query count by position band, clicks, impressions and CTR; identify query-level losses and gains; check annotations and algorithm update dates; classify each period as coverage loss, slippage, CTR/SERP effect or mixed. Separate measured facts from hypotheses, and flag data gaps.
MCP access keys authenticate as your account and carry its permissions. Keep the key private, use a trusted client and revoke it if it is exposed.
A practical rule to keep
Clicks tell you that the outcome changed. Total query count tells you whether the page still appears across a similar range of searches. Position bands show whether those queries moved. Impressions and CTR show whether visibility turned into clicks at the same rate. Read all four together, drill into the queries that changed, annotate your edits and wait for a comparable period before deciding what worked.
Sources and definitions
• SEO Stack URL Query Count Tool · https://www.seo-stack.io/platform/query-count
• Google Search Console Performance report · https://support.google.com/webmasters/answer/7576553?hl=en
• About Search Console data · https://support.google.com/webmasters/answer/96568?hl=en
• Clicks, impressions and position definitions · https://support.google.com/webmasters/answer/7042828?hl=en
• GenAI Performance report · https://support.google.com/webmasters/answer/16984139?hl=en-GB
Bulkco figures are taken from the SEO Stack URL Query Count monthly matrix available at capture on 14 October 2026. CTR values in this article are calculated from the displayed clicks and impressions and rounded to two decimal places. Percentage changes are calculated from the displayed month values.

Founder, SEO Stack
Daniel is the founder of SEO Stack. He has spent over 2 decades working on technical SEO and search data, and built SEO Stack after hitting the same Search Console limits on client work one time too many.
Daniel has extensive SEO experience having built SEO agencies, audit businesses & a thriving consultancy, in his spare time Daniel likes to run SEO experiments & to share findings.
Published 14 October 2026