The Complete Guide to Google Search Console's URL Inspection Tool

Daniel has 25+ years SEO experience & loves everything SEO including testing, ranking & getting clients results
Google Search Console's URL Inspection tool is arguably the single most useful diagnostic instrument in the modern SEO's toolkit. It's the only place where Google tells you for each URL you give it, exactly how it sees a specific page, whether it's indexed, how it was rendered, which resources were fetched, what its canonical is, and what Google has decided to do with it.
For a tool that most SEOs use daily, it remains surprisingly underutilised. Most people tap it for a quick "is this indexed?" check and move on, without realising the depth of diagnostic data sitting one click away inside the tested page view. This guide is intended to be a comprehensive reference for getting everything you can from Google's URL inspection.
What is the URL Inspection Tool?
The URL Inspection tool is a feature inside Google Search Console (GSC) that returns Google's own view of a single URL from a verified property. It sits at the top of every GSC property as a search bar labelled "Inspect any URL in [property name]" and is also accessible via the left-hand navigation.
It's fundamentally a URL-level diagnostic. Where reports like Pages or Core Web Vitals show aggregated data across your site, URL Inspection hones in on exactly 1 URL and tells you:
Whether the URL is currently in Google's index
What indexing state Google has assigned it (and why)
When it was last crawled and with which user agent
The canonical URL Google chose (versus the one you declared)
The rendered HTML Google produced after executing JavaScript
A screenshot of how the page rendered
HTTP response headers and status codes
All page resources Google attempted to load, and which ones failed
JavaScript console messages produced during rendering
Any enhancements (structured data, HTTPS, etc.) detected
How the page was discovered (sitemaps, referring pages)
There is no other source of this information. Third-party crawlers can simulate Googlebot, but they cannot tell you what Google actually did with your URL. URL Inspection can.
How does the URL Inspection Tool work?
Google's URL inspection tool offers end users to see a cached or live URLs state, understanding the difference between them is the foundation for using it effectively.
Cached inspection (the default)
Returns data from Google's index. When you paste a URL and hit enter, you are not triggering a fresh crawl. You are pulling a fresh report based on Google's last crawl of that URL. That crawl could have been minutes ago, days ago, or for low-priority or orphaned URLs months ago. The "Last crawl" timestamp inside the coverage detail tells you exactly when.
This is the mode that answers: "What does Google currently believe about this URL?"
Test Live URL triggers a fresh, real-time fetch of the URL using Googlebot Smartphone. Google makes an HTTP request to your server, renders the page in a recent version of Chromium, and returns the results. Critically, a live test does not update the index. It's a preview of what Google would see if it crawled the page right now. You then have the option to "Request Indexing" if the live test looks good.
Live URL inspection is basically - "What would Google see if it visited this URL today?"
A typical diagnostic workflow uses both in sequence. You inspect the cached data to understand the current indexing state and find any problems, then test live to confirm the fix has been deployed and is visible to Googlebot.
Why is URL Inspection important?
There are a handful of SEO problems where URL Inspection is incredibly useful (and essential in most cases)
Indexing diagnosis at URL level
The Pages report will tell you that 4,200 URLs are "Crawled - currently not indexed." URL Inspection tells you why that specific URL is in that bucket, what Google crawled when it decided, and what the rendered output looked like.
URL inspection specifically returns the indexing state and attributes around the single URL only.
Fix verification
You've updated a noindex tag, fixed a canonical, removed a redirect chain, or deployed a template change. URL Inspection's live test lets you verify the fix is actually live and visible to Googlebot before you sit around waiting for the next organic recrawl.
JavaScript rendering validation
For any site that relies on client-side rendering, hydration, or framework-based content loading, URL Inspection's rendered HTML view allows you to see what Google was able to render from the HTML source obtained during inspection >
Canonical auditing
Google's chosen canonical can differ from your declared canonical. URL Inspection is where that discrepancy becomes more obvious, and it's often the root cause of "why isn't this page indexed?"
If a URL is not indexed, it will not report google-selected canonical. If a URL is indexed and the Google-selected canonical is the same as the user-declared canonical there is no issues.
IF however, the Google-selected canonical is different to user-declared canonical this generally means Google is ignoring the canonical path set for the URL, which could indicate canonicalisation issues.
Structured data and enhancement validation
You can see exactly which rich result types Google detected on a specific URL and whether they're valid.
Manual indexing requests
For a new page, a recently updated page, or a URL that's been stuck in discovery limbo, the Request Indexing button is the fastest legitimate nudge available.
Cached URL Inspection vs Test Live URL: the critical difference
These two modes answer fundamentally different questions, and conflating them is one of the most common mistakes I see SEOs make.
Cached inspection shows the indexed state
It reflects what Google has stored in its index based on a past crawl. If the page was last crawled three weeks ago and you've since fixed a critical issue, the cached inspection will still show the old state. The "URL is on Google" or "URL is not on Google" verdict at the top is a verdict based on that past crawl.
Live test shows the current state of the page
It bypasses the index entirely. If your fix is live, the live test will reflect it. If it isn't because of a cache, a deployment issue, or a CDN, the live test will tell you immediately.
A few practical consequences:
After shipping a fix, always run a live test before requesting indexing. Requesting indexing on an unverified fix is a waste of time, Google is unlikely to index a problematic URL
Cached data can lag reality by weeks. A cached inspection showing "Excluded by noindex tag" on a page where you removed the noindex yesterday is not a bug, it's just a side effect of indexing / processing lag
Live tests use Googlebot Smartphone by default and always render the page. Cached data reflects whatever user agent Google used during the original crawl (usually smartphone for mobile-first indexed sites)
Live tests do not update the index. You must explicitly request indexing afterwards if you want to accelerate recrawl. Simply running a live test does nothing to your live search presence
Some enhancements are only available in cached mode (because they require an actual indexed version to reference). Others are testable live
Index states: what the top-level verdict means
At the top of every URL Inspection result is a coloured icon and a verdict. This is Google's headline answer. The possible states are:
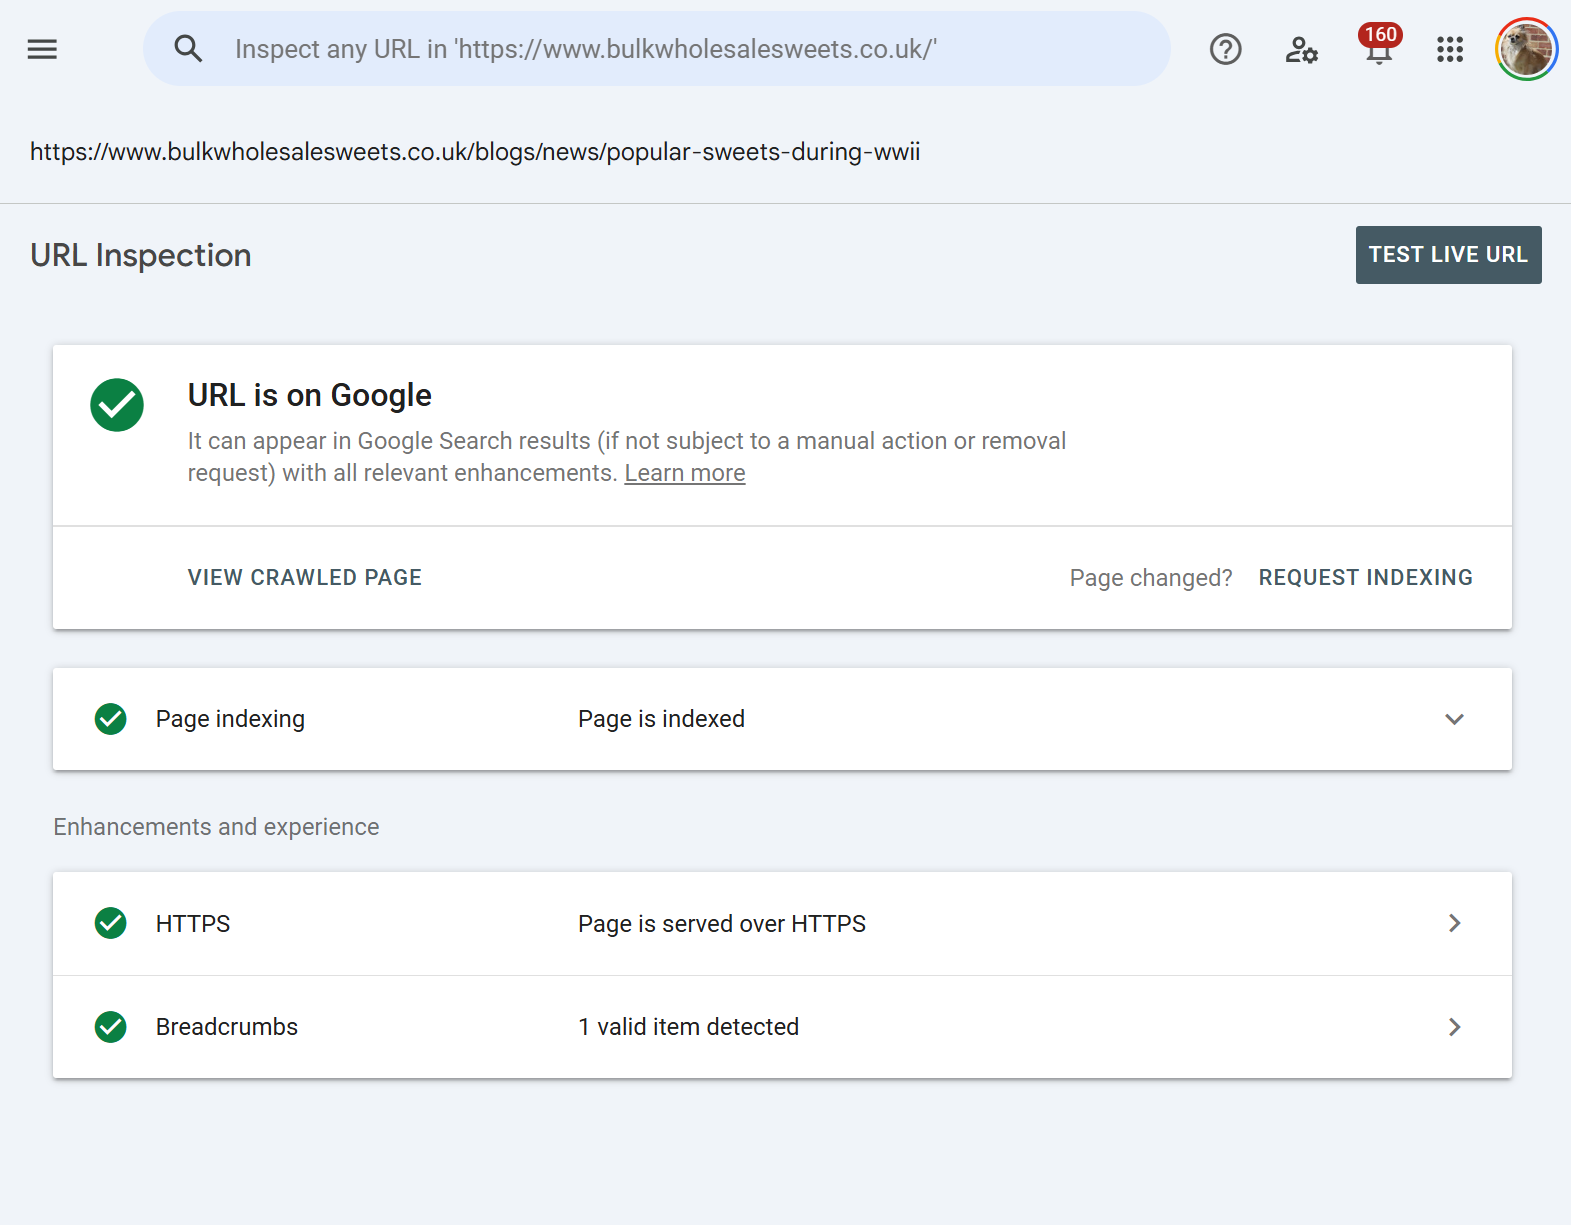
URL is on Google The URL is indexed and can appear in search results. Green checkmark. Best case.
URL is on Google, but has issues Indexed, but one or more enhancements have problems (structured data errors, Core Web Vitals failing, etc.). Amber warning.
URL is not on Google: Indexing errors The URL couldn't be indexed because of an error Google encountered. Red error.
URL is not on Google The URL isn't indexed. The detail panel below will tell you why.
URL is unknown to Google Google has no record of this URL ever being crawled. Common for brand-new URLs or URLs that haven't been discovered.
URL is an alternate version Google sees this URL as a non-canonical variant (e.g., a mobile version, an AMP variant, or a duplicate).
This verdict is always based on the cached/indexed state, not the live state. Even after a successful live test, this headline won't change until Google recrawls and reindexes.
Page indexing states: every reason Google gives
The Page indexing section (previously "Coverage") is where Google shows the specific reasons for a non-indexing decision. These reasons map directly to the states you'll see in the Pages report in GSC. Knowing all of them is essential because the remediation differs for each.
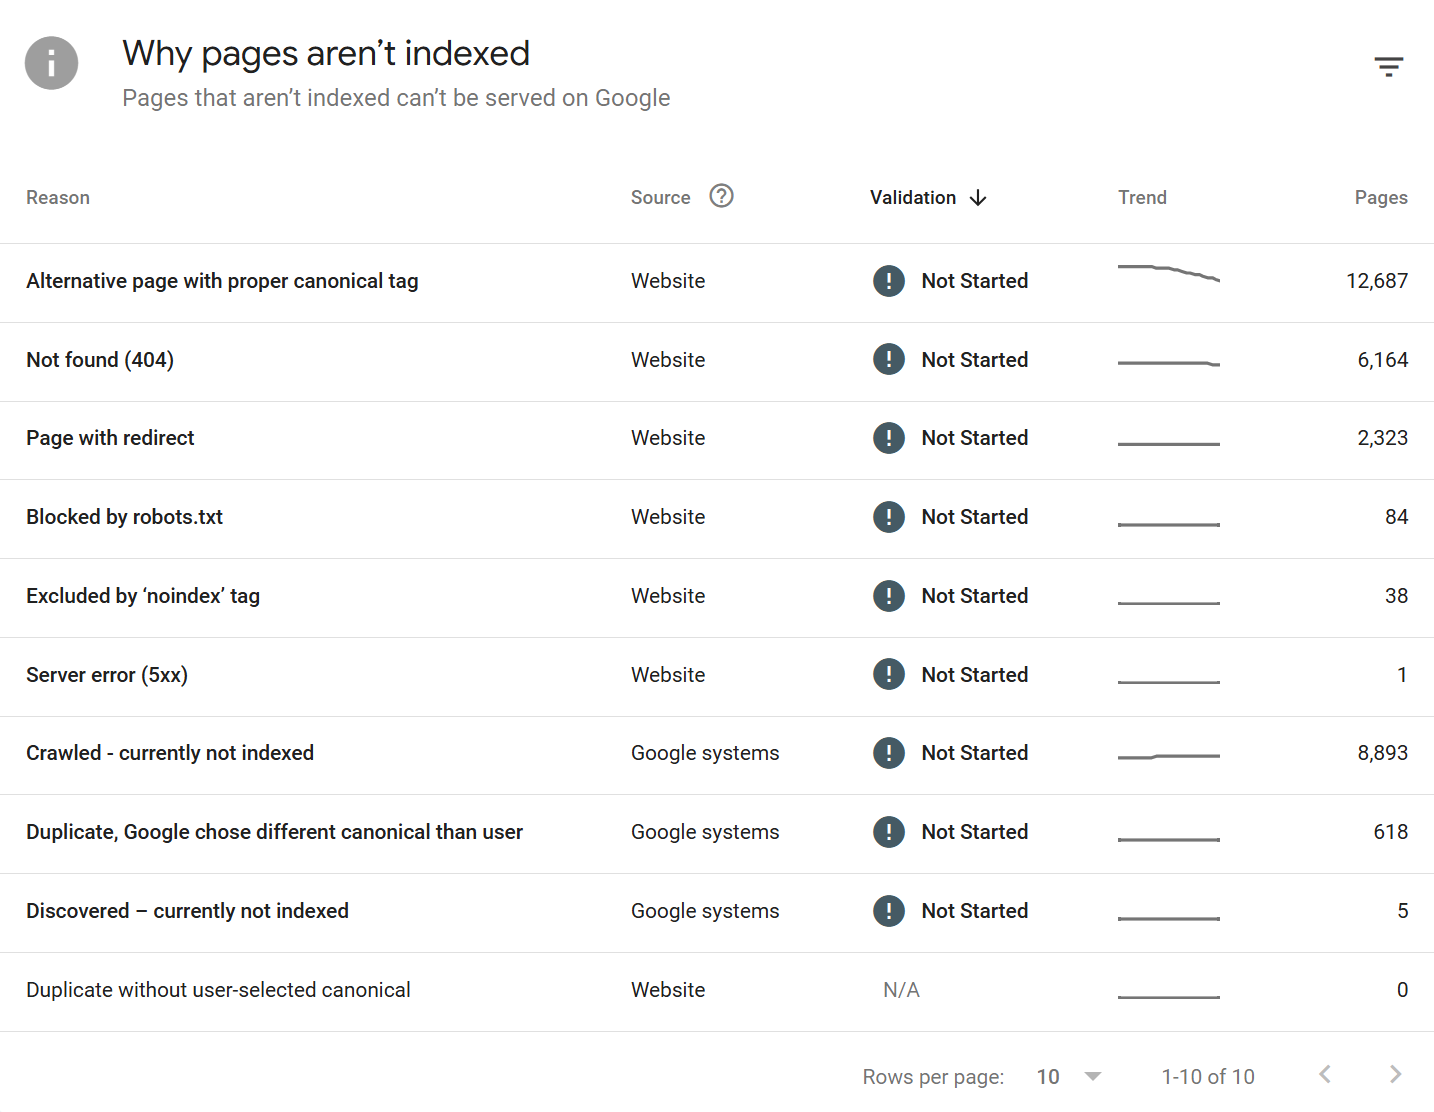
Successful states:
Submitted and indexed Submitted via sitemap and successfully indexed.
Indexed, not submitted in sitemap Indexed, but Google found it without a sitemap entry. Worth adding to your sitemap for crawl priority.
Indexed, though blocked by robots.txt Indexed based on external signals (usually links), but Google couldn't crawl the content. The page appears in search with a snippet saying "No information is available for this page." A common and usually unintended state.
Exclusion states (not indexed, but intentional or acceptable):
Excluded by 'noindex' tag - A
<meta name="robots" content="noindex">orX-Robots-Tag: noindexheader was found. Intended exclusion.Blocked by robots.txt -
robots.txtdisallows crawling. The URL may still be indexed if discovered via links (see above).Page with redirect - The URL redirects elsewhere. The destination gets indexed, not this URL.
Alternate page with proper canonical tag - The URL canonicalises to another page that is indexed. This is correct behaviour for duplicates.
Duplicate without user-selected canonical - Google detected duplicates but you didn't declare a canonical. Google has picked one for you.
Duplicate, Google chose different canonical than user - You declared a canonical, but Google disagreed and chose a different one. Usually a sign your canonical signals are inconsistent (internal links, sitemaps, hreflang all need to agree).
Duplicate, submitted URL not selected as canonical - You submitted this URL, but Google chose a different one as canonical.
Blocked due to access forbidden (403) - Server returned 403.
Blocked due to unauthorized request (401) - Authentication required.
Blocked due to other 4xx issue - A 4xx other than 401/403/404.
URL blocked by page removal tool - Temporarily removed via the Removals tool in GSC.
Indexing failure or warning states:
Not found (404) - The URL returned 404. Google will eventually drop it.
Soft 404 - The URL returned a 200 status, but Google thinks the content looks like an empty or error page. Common on thin category pages, empty search result pages, and out-of-stock product pages.
Server error (5xx) - Server returned 500, 502, 503, 504, etc. Transient 5xxs during crawl can cause this.
Redirect error - Too many redirects, a redirect loop, or a malformed redirect.
Discovered - currently not indexed - Google knows about the URL but hasn't crawled it yet, usually due to crawl budget or perceived low priority.
Crawled - currently not indexed - Google has crawled the URL but chose not to index it. The most frustrating state because Google doesn't give you a specific reason. Usually a quality, duplication, or thin content judgment.
Crawl anomaly - A catch-all for unexplained crawl failures. Rare.
State to act on immediately:
Unexpected
noindex- usually a template or staging environment leak.5xx or crawl anomaly - check server logs and uptime.
Soft 404 on commercial pages - fix the perceived empty content or the page won't rank.
Crawled but not indexed across a template - indicates a quality or duplication issue affecting the pattern.
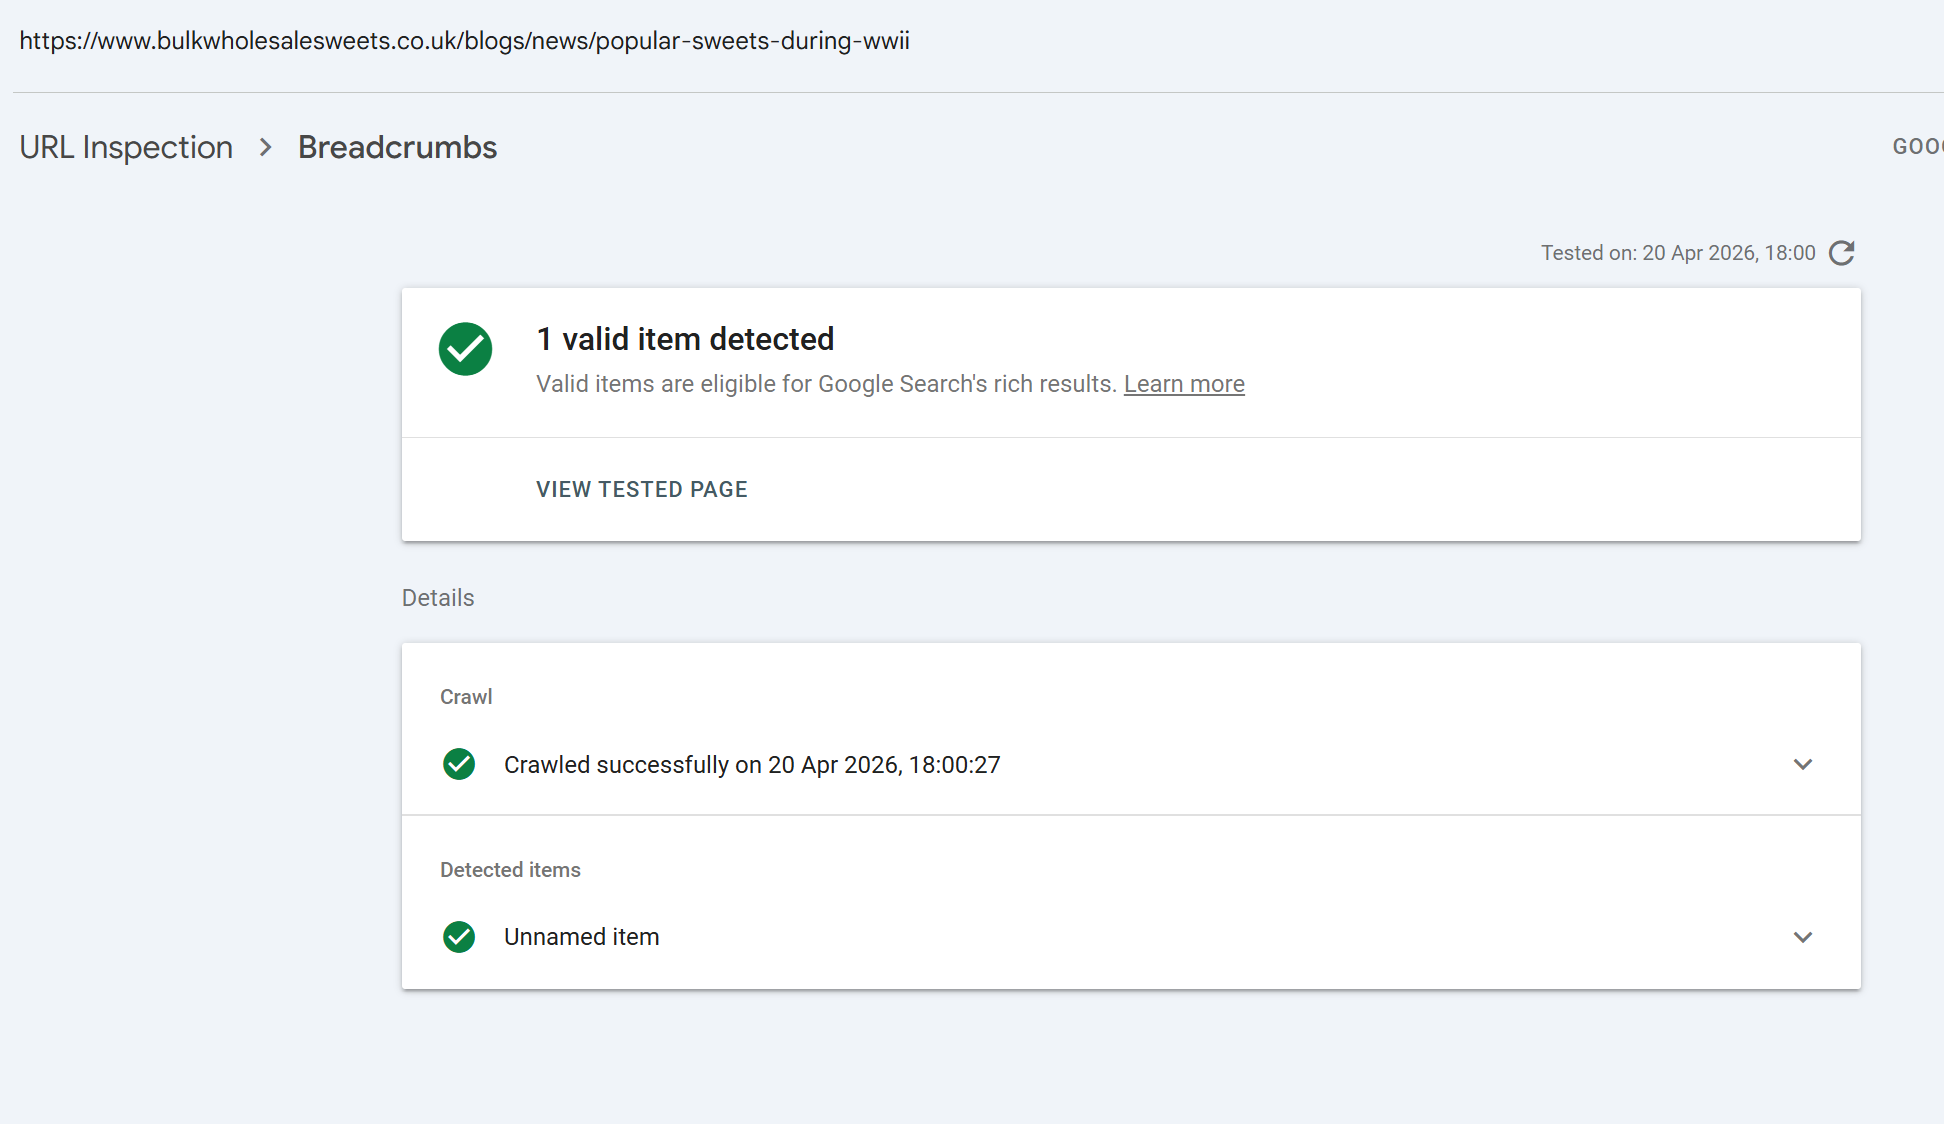
Enhancements and experience: what each report means
Below the page indexing block, GSC surfaces enhancement-level results. These are tied to specific rich result types, structured data, and experience signals. Common ones:
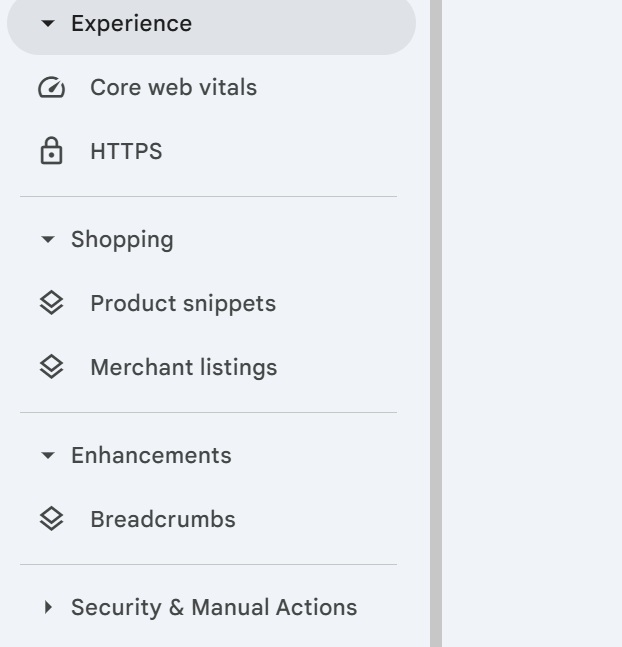
HTTPS Confirms the page is served over HTTPS. This report replaced the old Security Issues reporting for transport.
Breadcrumbs Structured data for breadcrumb trails. Validates
BreadcrumbListschema.Products / Merchant listings / Shipping details Product markup for e-commerce.
Review snippets
RevieworAggregateRatingmarkup.Article
Article,NewsArticle, orBlogPostingmarkup.Video
VideoObjectmarkup and video indexing status. A separate "Video indexing" line appears for every URL regardless of whether video markup is present.Recipe
Recipeschema for cooking sites.Event
Eventschema.Job posting
JobPostingmarkup for careers sites.Sitelinks searchbox
WebSite+SearchActionmarkup.Logos
Organizationlogo markup.Course info / Estimated salary / Learning video / Practice problems newer vertical-specific types.
AMP For sites still using AMP, validation status.
Note that Google has deprecated or significantly restricted several rich result types in recent years FAQ rich results are now only shown for high-authority sites, and How-to rich results were largely retired. The URL Inspection tool will still validate the schema, but visibility in SERPs is no longer guaranteed even for valid markup.
Mobile Usability, previously a prominent line here, was retired by Google in December 2023 and no longer appears in URL Inspection.
Each enhancement shows one of three states: Valid (detected and passes), Invalid (detected but has errors), or Not present (no markup of this type detected).
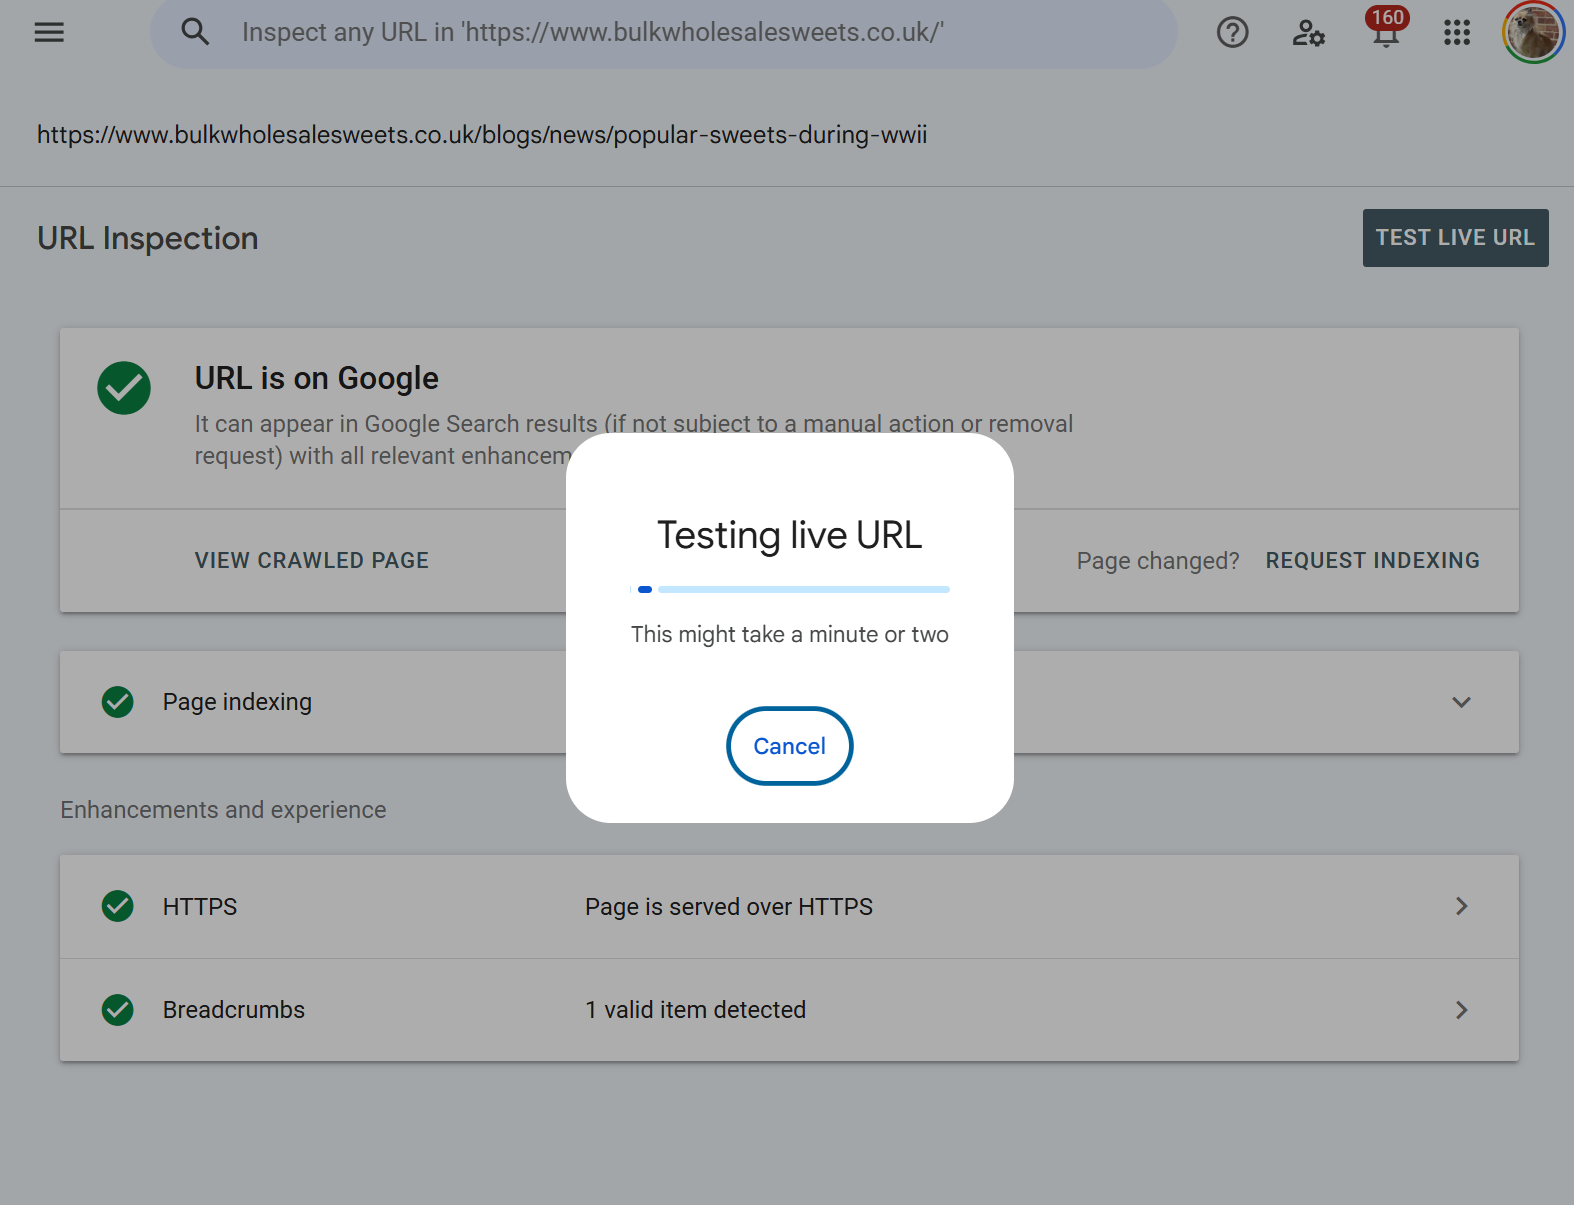
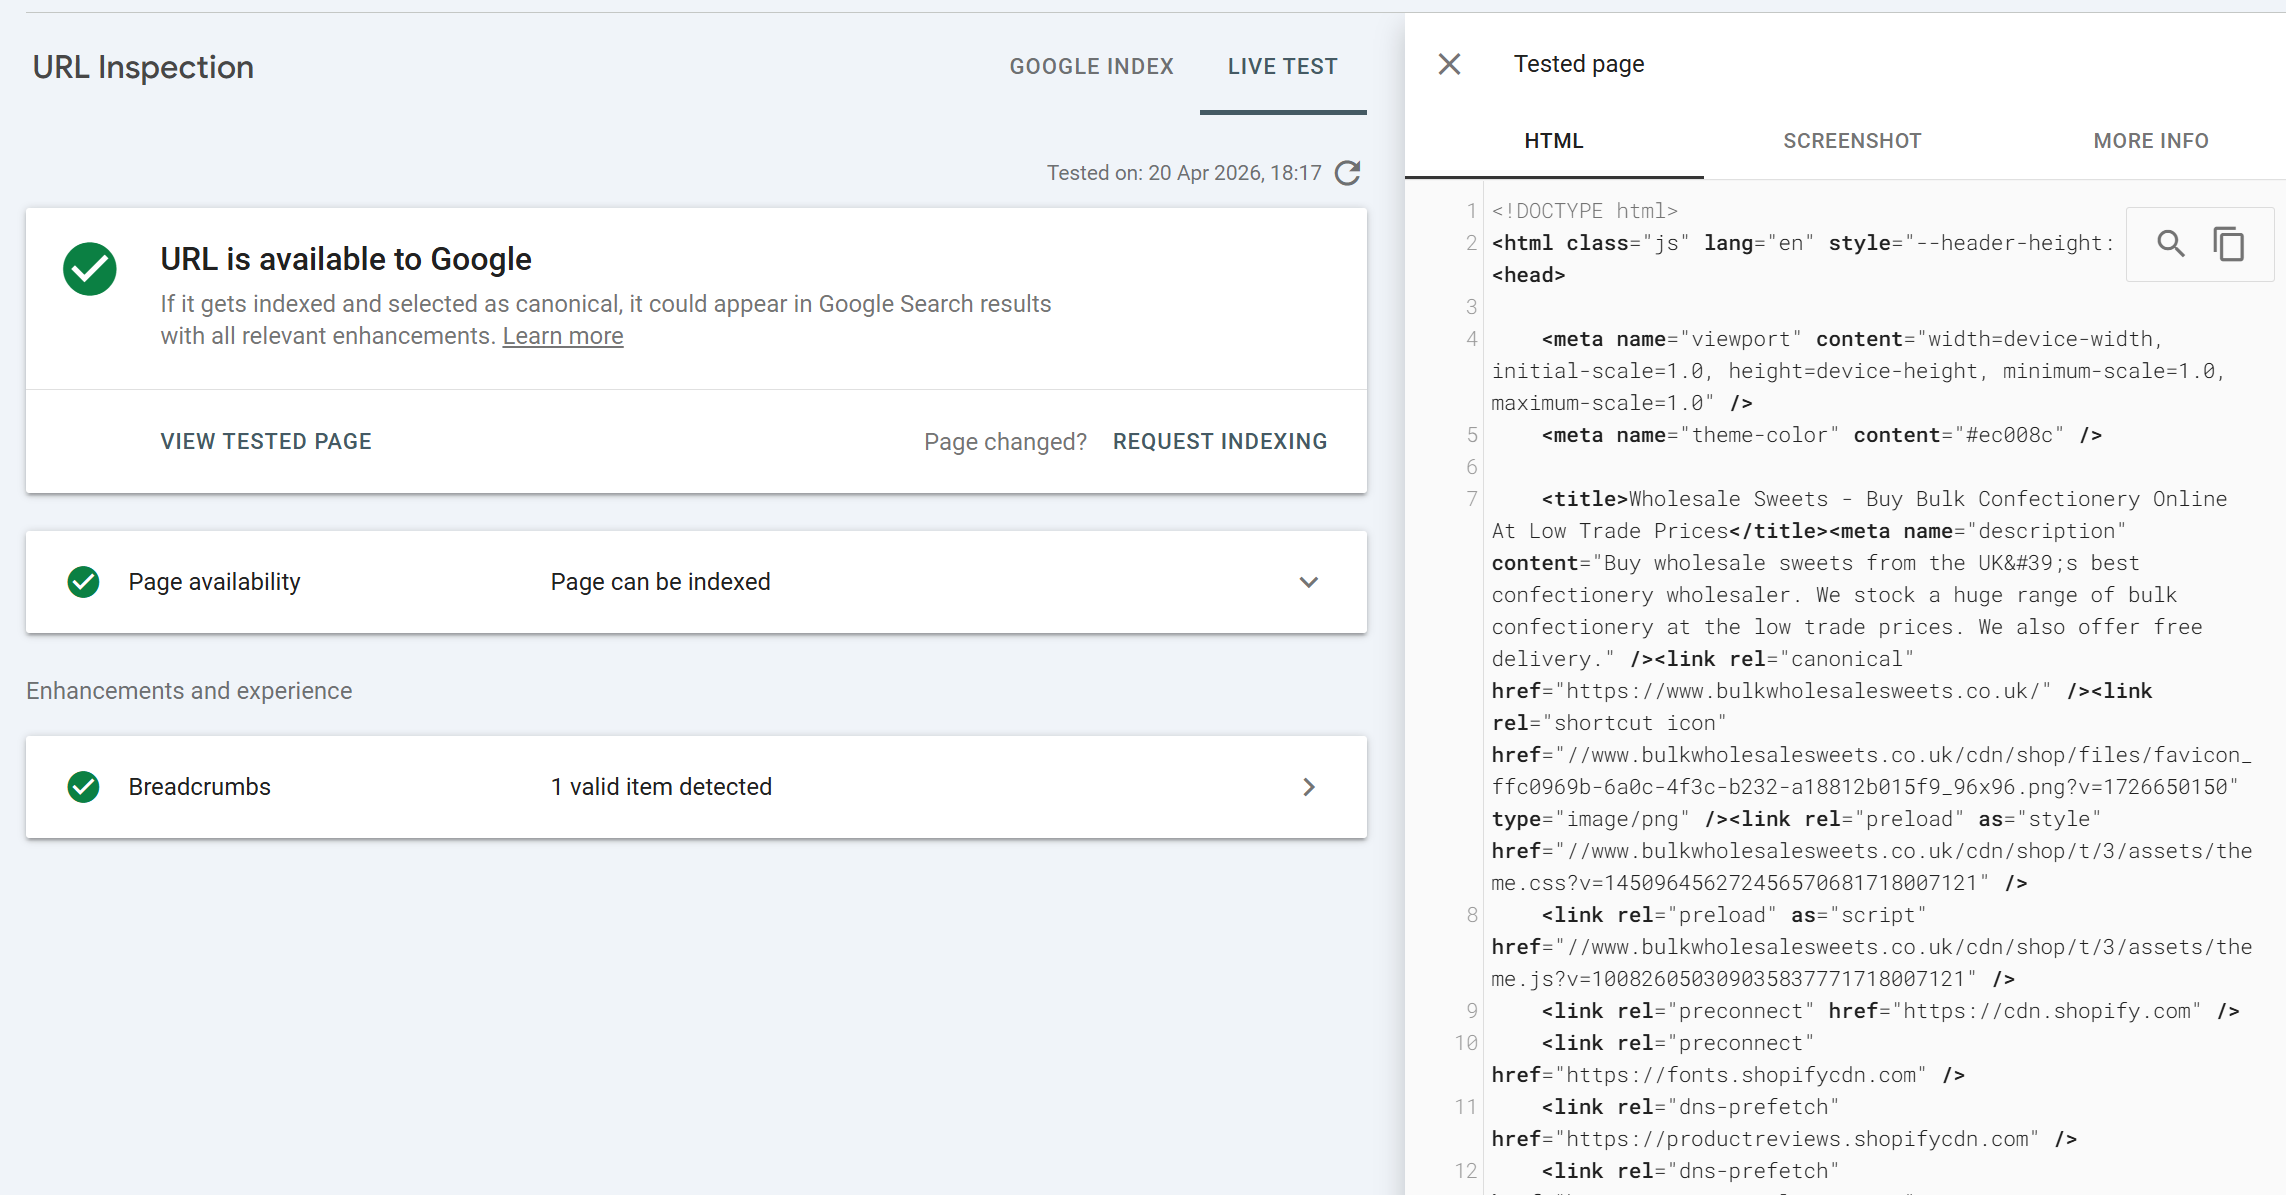
Live URL inspection: what "Test Live URL" actually does
Clicking Test Live URL triggers a real-time fetch. This takes anywhere from ten seconds to a minute or two depending on your server's response time, the number of resources on the page, and how heavy your JavaScript execution is.
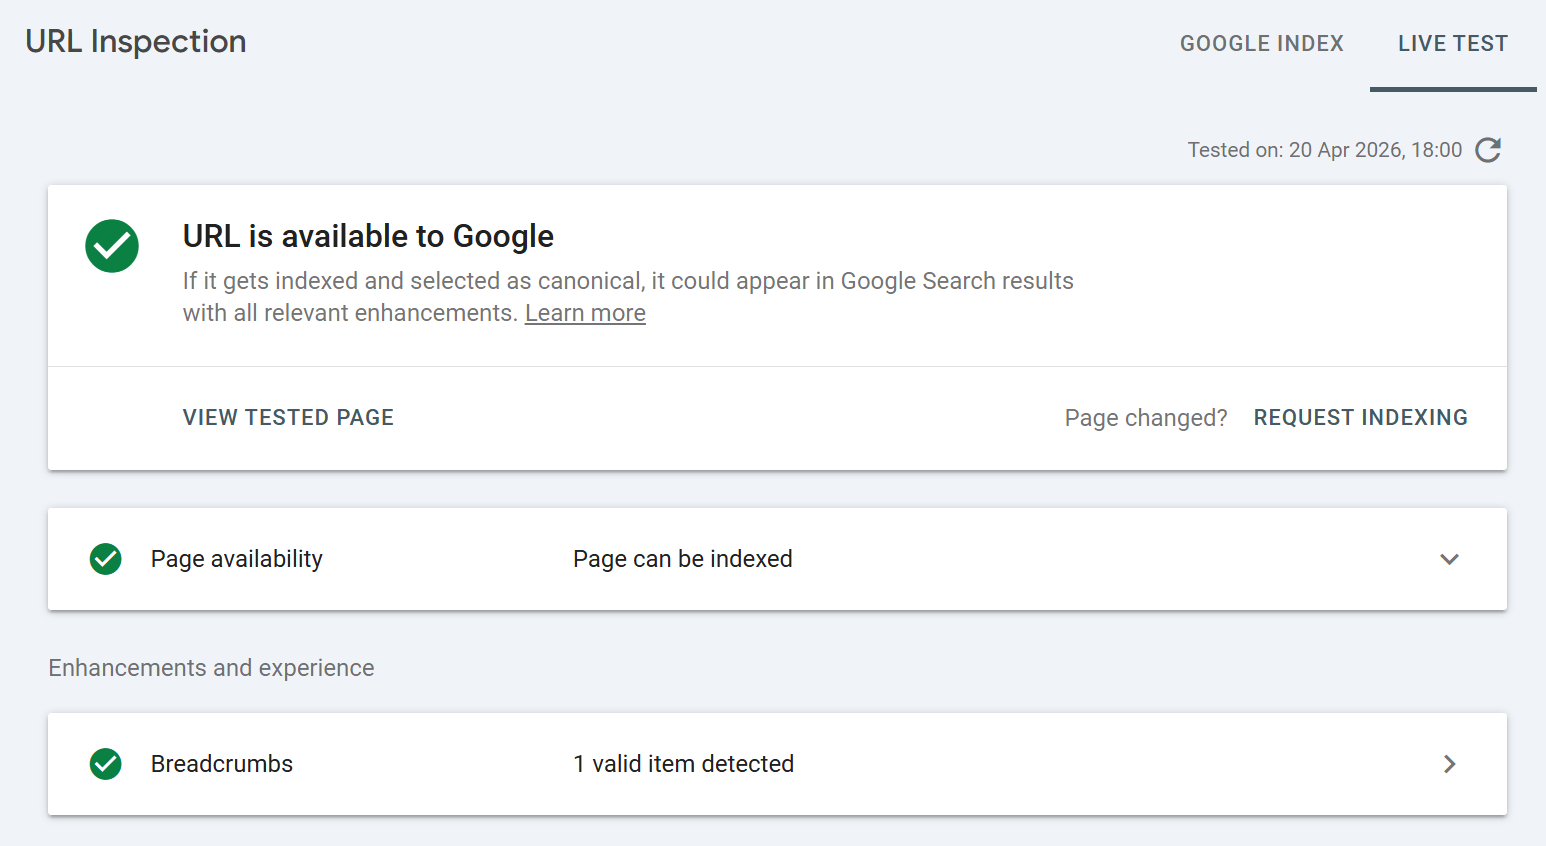
The live test result mirrors the cached inspection layout, a top-level verdict, page availability details, and a "View tested page" option, but every data point reflects the live state of the URL at the moment of test, not the indexed state.
The top-level verdict in live testing is:
URL is available to Google Nothing is stopping indexing.
URL is available to Google, but has issues Would be indexed but with enhancement problems.
URL is not available to Google An indexing blocker exists (noindex, robots.txt, error status, redirect, canonical pointing elsewhere, etc.).
When the live test comes back "not available," the detail panel will cite the specific reason, using the same vocabulary as the page indexing states above. A quick summary of the most common live-test failures:
Blocked by robots.txt Your live
robots.txtis disallowing this URL. Check for a strayDisallowor a staging rule that leaked to production.Page has noindex tag Live HTML includes a noindex directive. Check both meta tag and HTTP header.
Redirect The URL now redirects. Inspect the destination instead.
Not found (404) Page no longer exists.
Soft 404 Page loads but content is judged empty. Look at the rendered HTML to understand why.
Server error 5xx response. Check logs.
Canonicalised to another URL Your
rel="canonical"or Google's inference points elsewhere.Page fetch failed Googlebot couldn't fetch the URL at all. Firewall, WAF, rate limiting, or geo-blocking are common culprits.
Crawl anomaly Rare and vague.
Live test is also where you'll catch issues that wouldn't show in cached data, for example, a Cloudflare rule that accidentally started challenging Googlebot, or a misconfigured WAF rule that fires on a specific user agent.
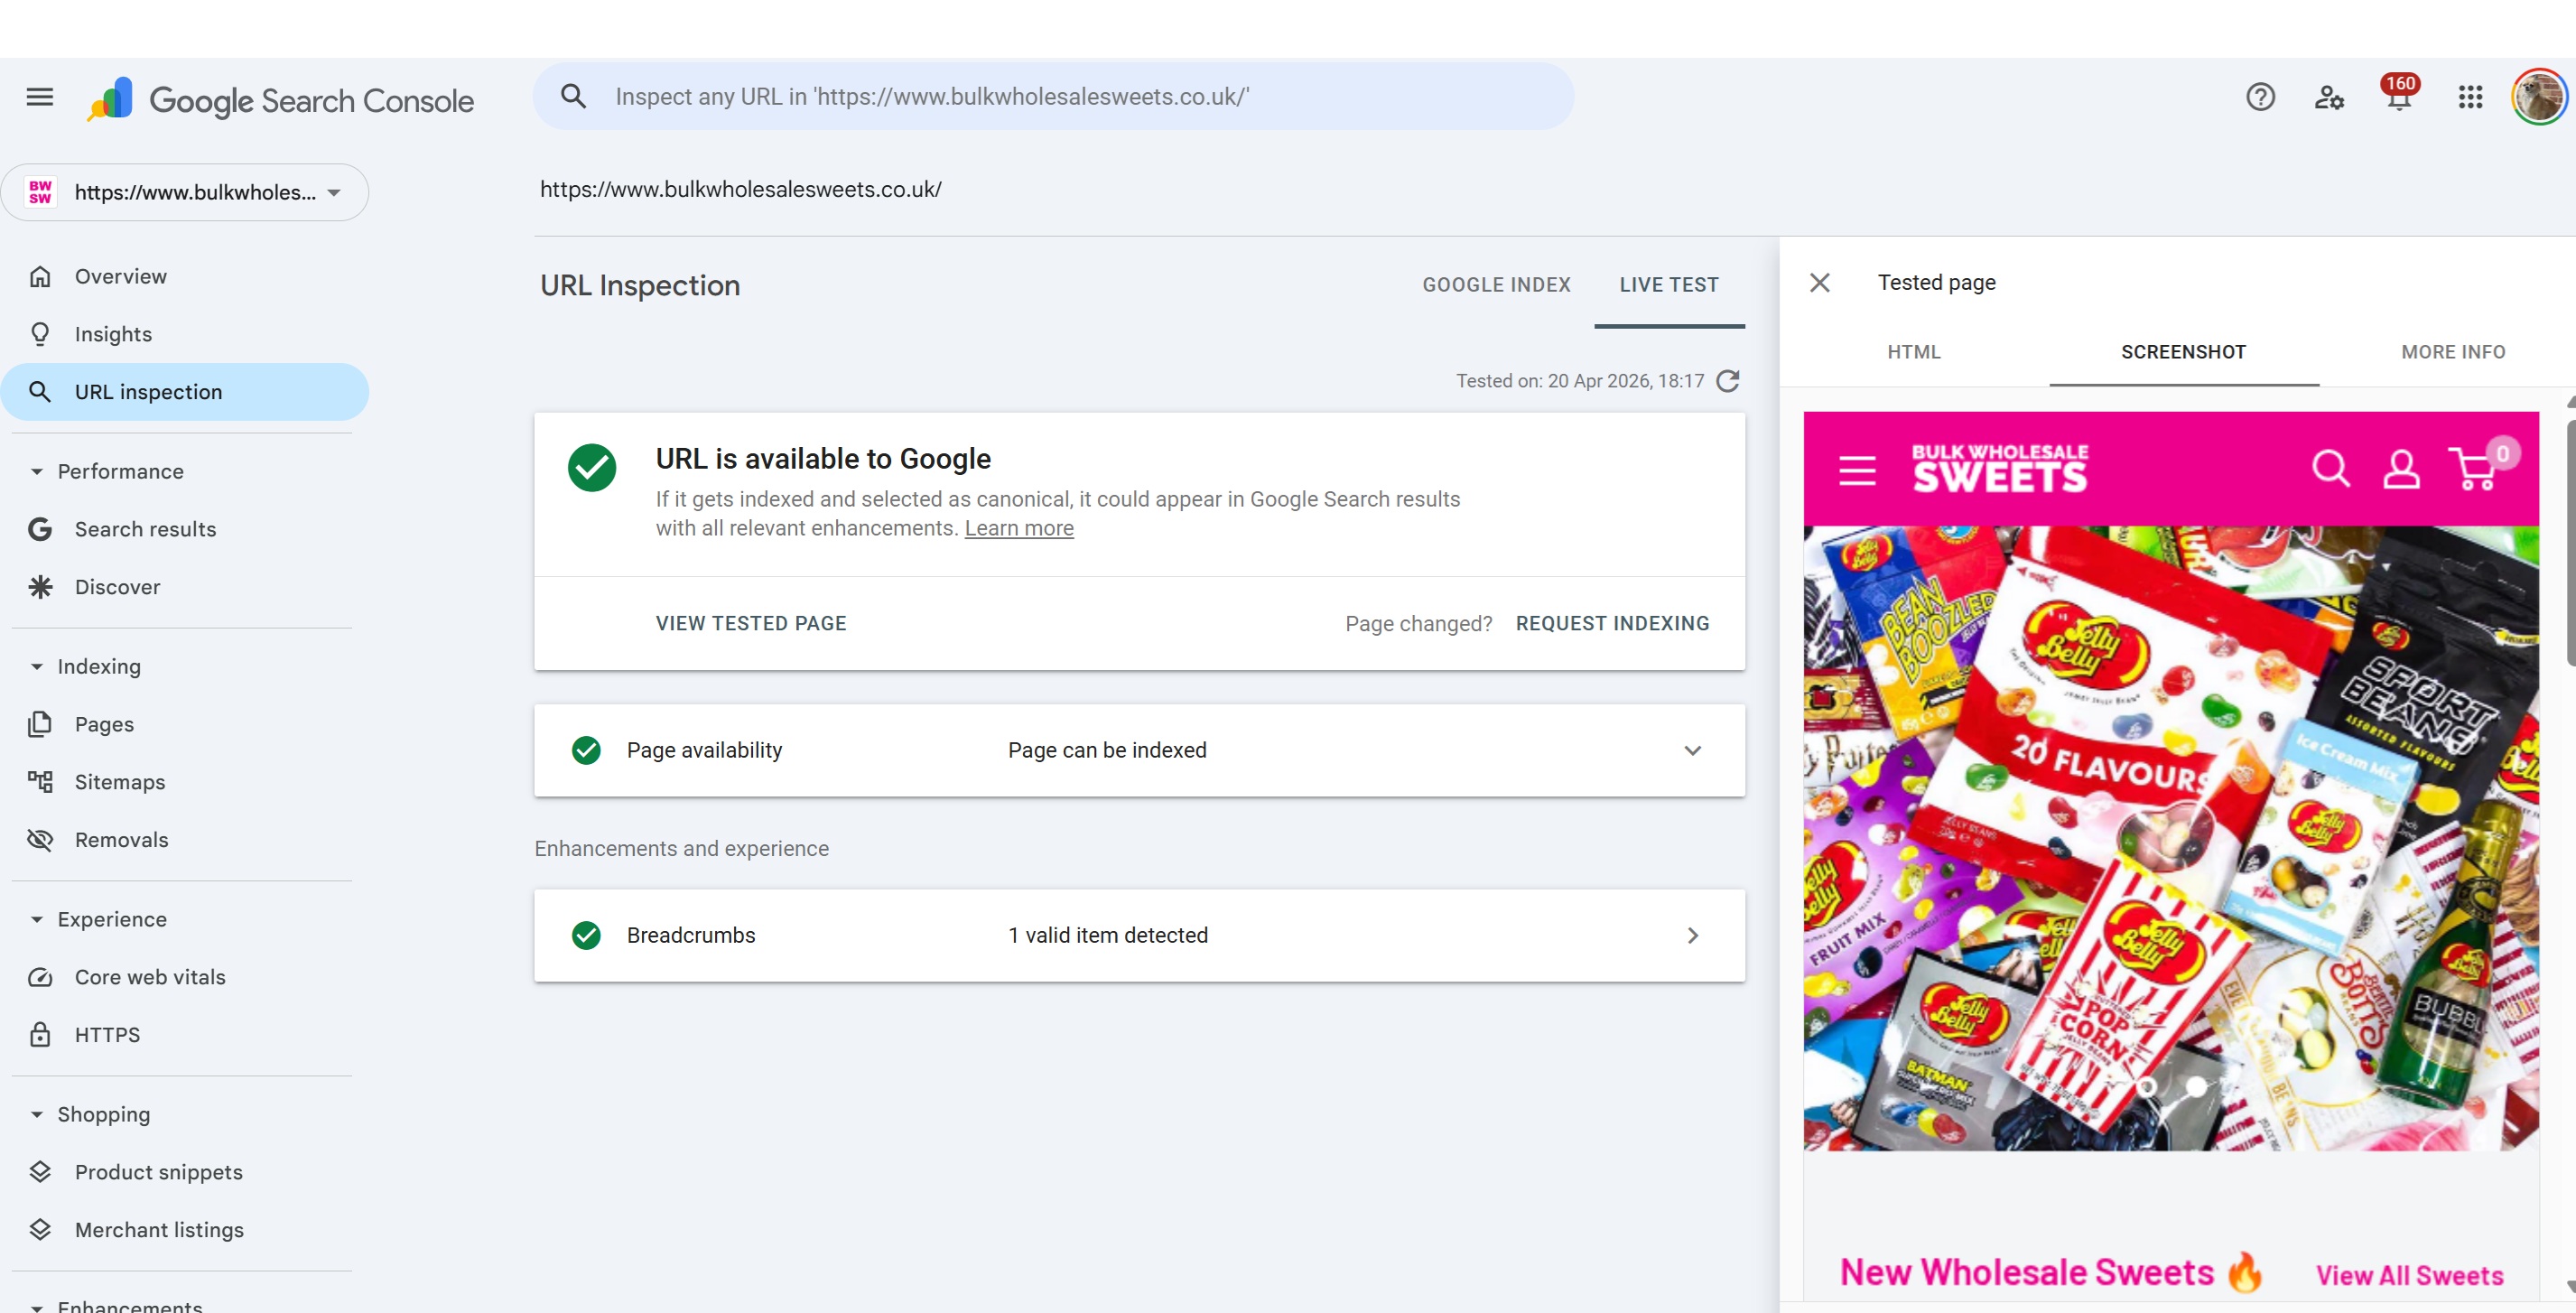
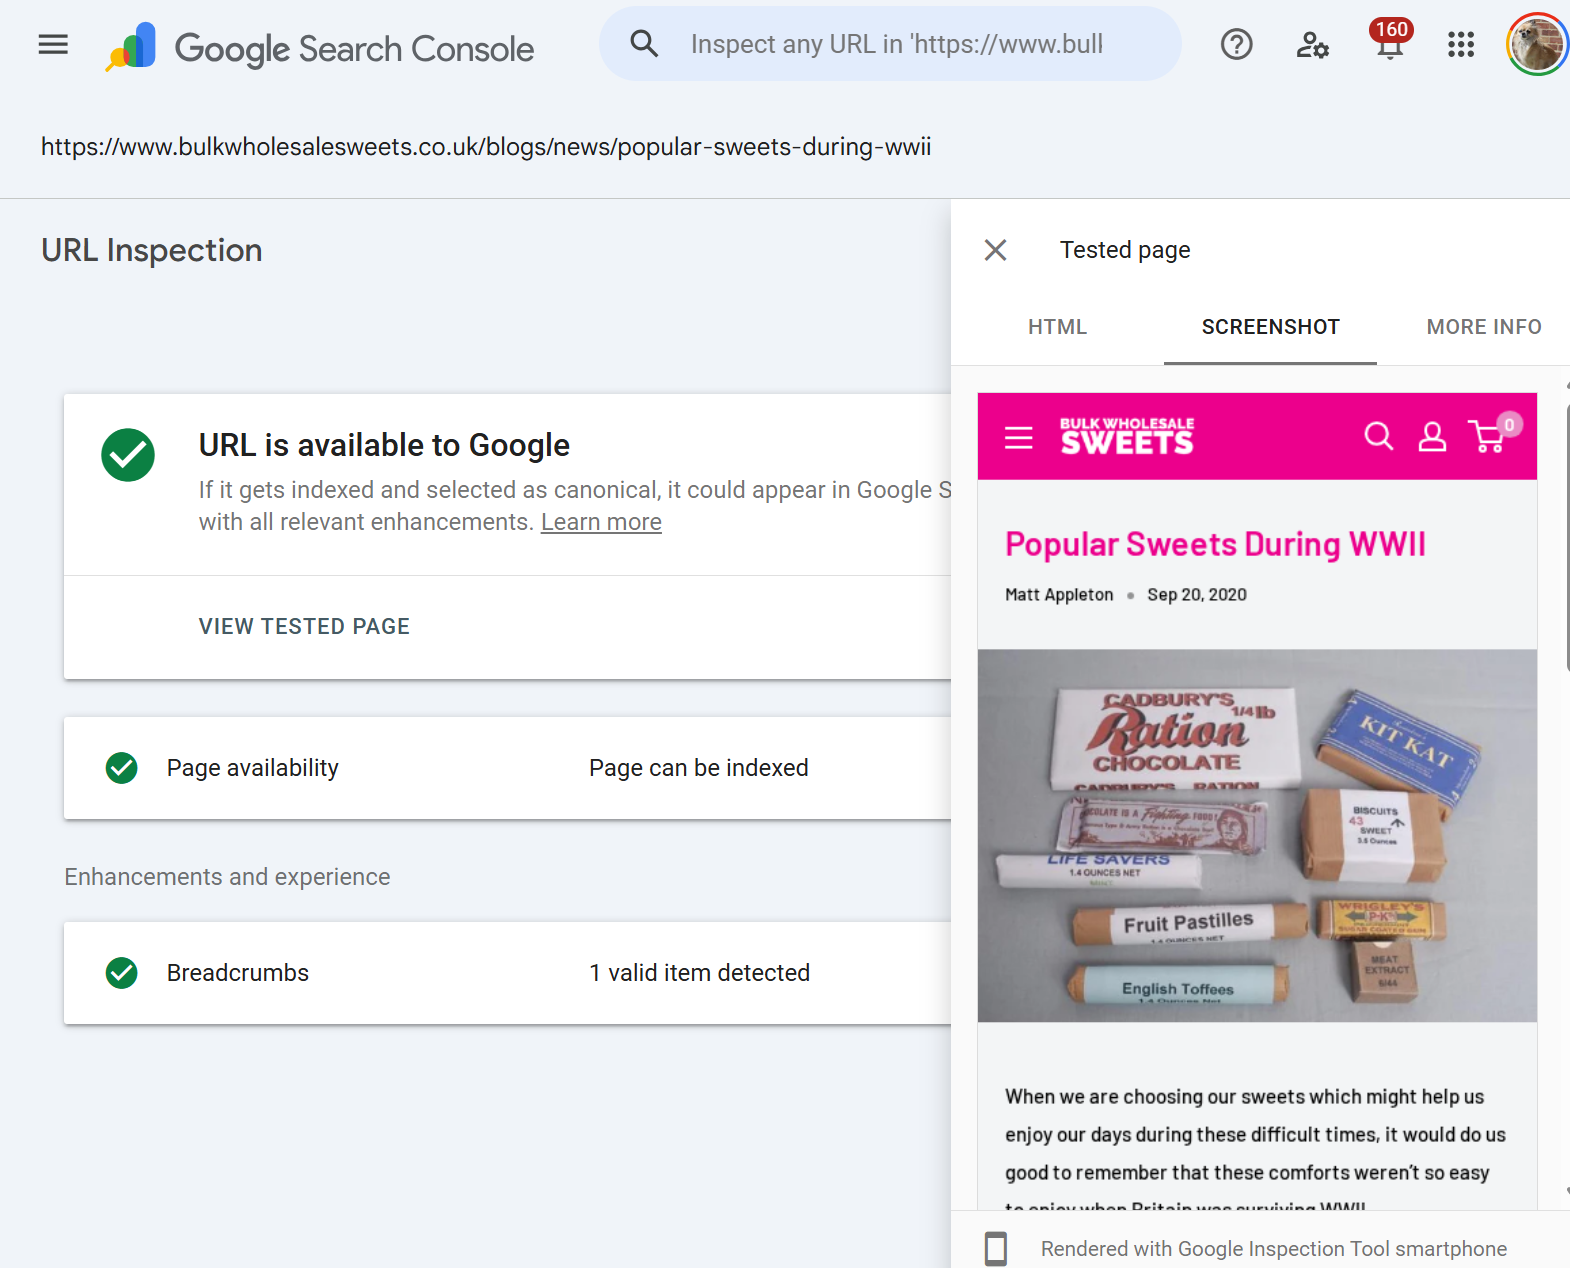
View Tested Page: where the real diagnostic value lives
After any live test (and for cached inspections of indexed URLs), there's a View Tested Page panel on the right. This is where URL Inspection earns its place as the most powerful diagnostic tool in GSC. It contains three tabs: HTML, Screenshot, and More Info.
This is where some SEOs skip or don't always dig into the output or is something that gets ignored. They shouldn't. The View Tested Page data is often an undiagnosed issue may become apparent from finding anomalies in the HTML output, no rendering on the screenshot, blocked resources used for rendering the pages etc.
The HTML tab
The HTML tab shows the fully rendered HTML that is, the DOM after Googlebot executed the page's JavaScript. This is the version of your page Google actually uses for indexing.
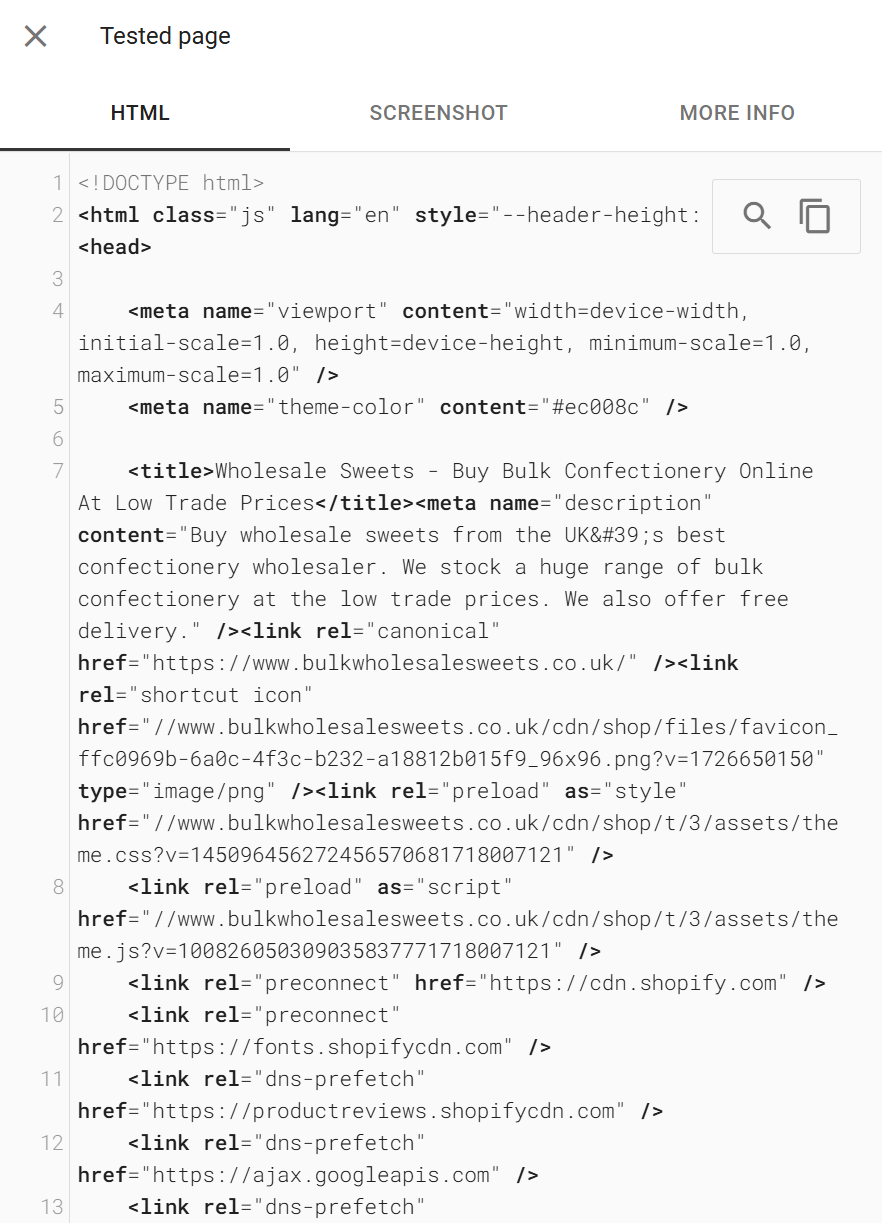
This is not your view-source: HTML. If your site uses client-side rendering, hydration, or any framework that injects content post-load, the HTML tab is the authoritative view of what content actually made it into the rendered DOM.
Uses for the HTML tab:
Confirm JavaScript-injected content is visible
Search for specific product names, article body text, or internal links. If they're missing from the rendered HTML, they're missing from Google's index too. This is the fastest way to diagnose whether your framework is producing content Google can see.Verify the canonical tag is correct in the final rendered HTML
Some CMSes output conflicting canonicals or have plugins that overwrite them late in the render cycle.Check meta robots directives
If you've setnoindexdynamically via JavaScript (which you shouldn't, but happens), it'll show here.Inspect internal linking
Confirm your navigation, footer, and cross-links are all in the rendered HTML, not lazy-loaded into invisibility.Find structured data
Confirm JSON-LD blocks are actually in the rendered output.Diagnose content parity
If your desktop HTML has content that doesn't appear in the mobile rendered HTML (the default for live tests), you have a mobile-first indexing problem.
You can copy the HTML to your clipboard and run it through anything, HTML validators, regex searches, diff tools against your source HTML to see exactly what JavaScript has added or removed.
One caveat: the HTML tab shows the rendered HTML at the moment of testing. If your page has content that loads on user interaction (click-to-expand tabs, "load more" buttons), that content typically won't be in the rendered HTML unless it's in the initial DOM with CSS hiding it.
The Screenshot tab
The Screenshot shows a visual render of the page as Googlebot saw it. It's useful precisely because it's visual anomalies jump out that you might miss scanning HTML.
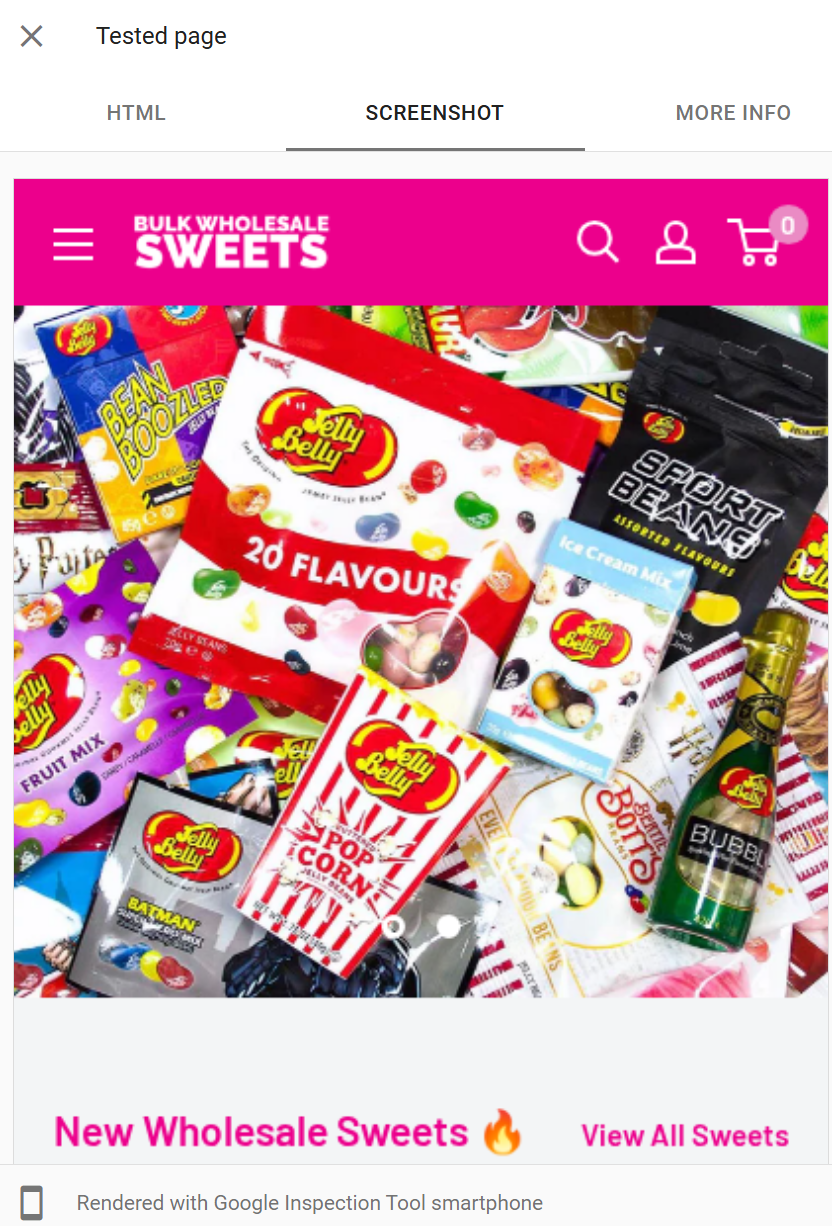
Critical caveat: the screenshot is not a full-page render
It captures only the top portion of the page, typically around the first viewport or so of content, not the entire scrollable page.
Do not assume the absence of something below the visible area means Google didn't see it. The HTML tab is authoritative on content; the screenshot is indicative on visual rendering.
Scenarios where the screenshot is particularly useful:
Completely blank screenshot
This is a rendering failure. Google fetched the page but the render produced nothing. Almost always caused by critical JavaScript failing, a required resource being blocked, or a client-side framework erroring before paint. Pair with the JavaScript Console tab to find the error.Page loads but content area is empty
The shell renders but your main content didn't. Usually means the content is loaded via an XHR/fetch call that failed or was blocked during rendering.Layout is broken, styles missing
CSS files weren't loaded. Check the Page Resources tab, typically a CSS file is blocked by robots.txt, returning 4xx, or hosted on a CDN that's rejecting Googlebot.Text in images instead of HTML
Confirms a potentially significant indexing problem if your content is embedded in images, Google's indexing signal from that content is severely limited.Cookie banners or interstitials covering content
If a full screen modal dominates the viewport in Google's render, Google's mobile interstitial penalty may apply and user-perceived quality is affected.Placeholder content visible
Skeleton loaders, spinners, or "Loading..." text in the screenshot mean Google rendered before your content arrived.Geo-blocked or region-redirected content
If you see content from a different country version of your site, your geo-detection logic is misidentifying Googlebot.
A common mistake is to dismiss a rendering problem because "the page looks fine when I load it." The screenshot is showing you Googlebot's render environment, not yours. Browser rendering and Googlebot rendering differ in JavaScript timeouts, resource limits, and user interaction.
The More Info tab
The More Info tab is where the deep technical detail lives. It contains four sub-sections that together form the most granular view you can get of a Googlebot fetch.
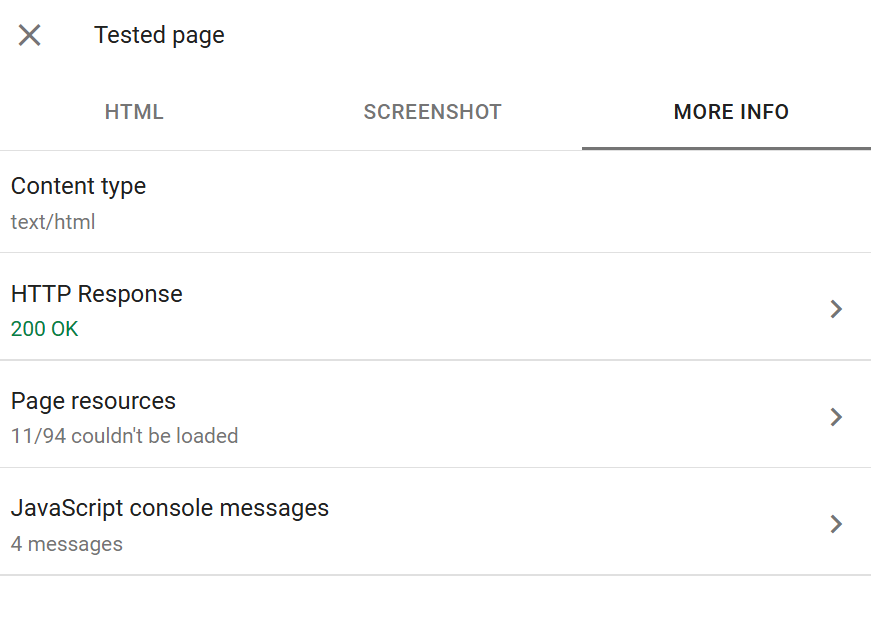
HTTP Response shows the full response headers returned by your server for the initial URL request. Useful for:
Confirming the actual HTTP status code (sometimes redirects or WAF rules mean the status you think you're serving isn't what Googlebot receives).
Checking
X-Robots-Tagheaders - a frequent source of hiddennoindexdirectives that don't appear in the HTML.Verifying
Content-Typeheaders - a page served astext/plaininstead oftext/htmlwon't be indexed correctly.Checking cache headers, CORS headers, and any custom headers your application sets.
Confirming
Vary: User-Agentbehaviour if you're doing dynamic serving.
Page Resources lists every resource Googlebot tried to fetch during rendering, JavaScript files, stylesheets, images, fonts, XHR requests. Each shows a status: fetched, blocked by robots.txt, or "Other error" (usually 4xx/5xx).
This is often the single most valuable tab for diagnosing rendering issues:
A blocked critical JS file is usually the cause of blank screenshots.
A blocked CSS file is usually the cause of unstyled screenshots.
Multiple failed XHR requests can indicate API endpoints that reject Googlebot by user agent or don't allow cross-origin fetches from the rendering context.
Third-party scripts timing out can hold up rendering long enough to hit Googlebot's render timeout.
A rule of thumb: resources blocked by robots.txt are worth reviewing one by one. Blocking analytics, tag management, and third-party scripts is fine. Blocking your own site's CSS and JS almost never is.
JavaScript Console Messages surfaces every console.error, console.warn, and some console.log calls fired during Googlebot's render. If you've ever debugged a JS app in Chrome DevTools' Console panel, this is the equivalent from Googlebot's browser.
What to look for:
Uncaught TypeError,ReferenceError,SyntaxErrorfatal JS errors that likely halted rendering.Failed network requests with descriptive error messages.
Content Security Policy violations sometimes CSP headers block resources from loading in Googlebot's context even if they work in your browser.
Hydration errors from React/Vue/Angular/Svelte usually mean the server-rendered HTML doesn't match what the client-side framework expects, and rendering may have bailed.
An empty console is usually good. A console full of errors is always worth investigating.
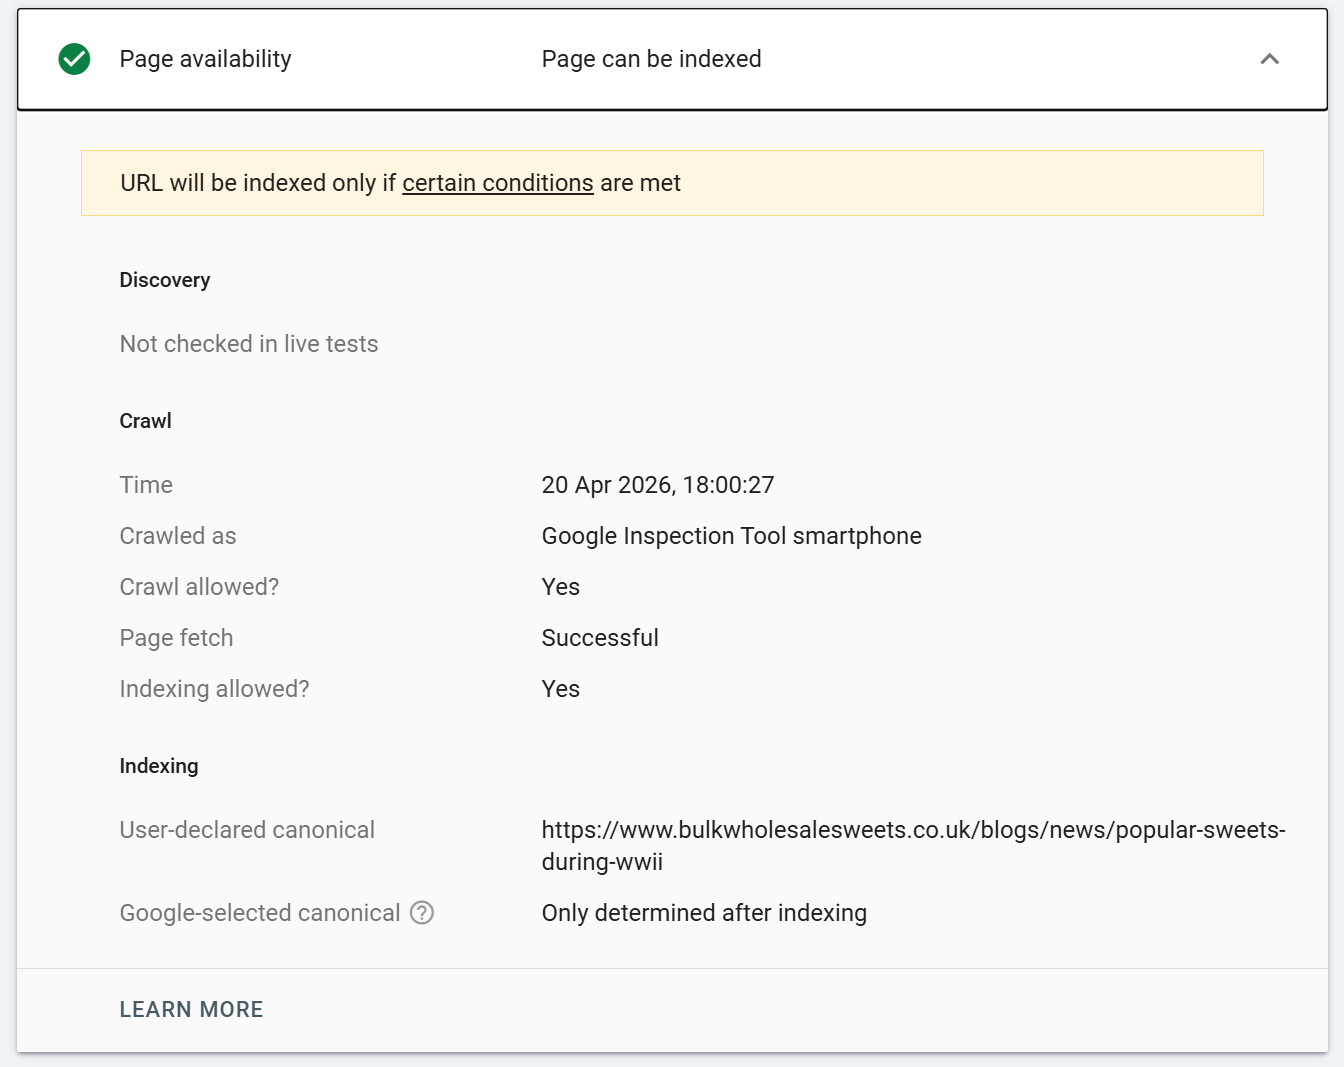
Page Availability (sometimes shown separately, sometimes inside More Info depending on the interface version) surfaces crawl metadata:
Discovery how Google originally found the URL (sitemap, referring page, etc.).
Last crawl timestamp of the most recent successful crawl.
Crawled as Googlebot Smartphone or Desktop (almost always Smartphone post mobile-first indexing).
Crawl allowed? whether robots.txt permits crawling.
Page fetch whether the fetch itself succeeded.
Indexing allowed? whether indexing directives permit indexing.
User-declared canonical the canonical you set.
Google-selected canonical the canonical Google actually used. If these differ, you have a canonical consolidation problem to investigate.
Referring page if discovery was via a link, which URL linked to this one.
The User-declared vs Google-selected canonical comparison is one of the highest-leverage data points in the entire GSC. If they disagree consistently across a site, your canonical signals are conflicting somewhere usually in sitemaps, internal links, or hreflang declarations.
Practical workflow: a diagnostic sequence
When a URL isn't ranking or isn't behaving as expected, this is the sequence I work through:
Run cached inspection. Check the top-level verdict, page indexing state, and last-crawl date. If the last crawl is months old, the cached state is unreliable, proceed to step 2.
Check the canonical. If Google-selected ≠ user-declared, investigate why before anything else.
Run live test. Confirm whether the current live state matches the indexed state.
If the verdicts differ, the index is simply lagging reality. Request indexing and move on.
If the live test fails, read the stated reason and work through the More Info tab:
HTTP response for unexpected status codes or headers.
Page Resources for blocked or failed fetches.
JavaScript Console for fatal errors.
HTML tab to confirm content is rendering.
Screenshot to visually spot anomalies.
Fix, redeploy, re-test live to confirm the fix is visible to Googlebot.
Request Indexing once the live test is clean.
Don't skip step 6. Requesting indexing on an unverified fix is the single most common way SEOs waste their quota and delay their own recrawl.
Caveats and limitations worth knowing
Request Indexing has a daily quota. Roughly 10–12 URLs per day per property. It's a triage tool, not a bulk submission mechanism. For bulk reindexing, sitemaps remain the primary channel.
A successful live test does not guarantee indexing. It confirms the URL is eligible for indexing. Google still makes a quality and duplication judgment before committing to index.
The tool only works on URLs within verified properties. You can't use it to inspect competitor URLs.
Results can differ between live test and actual index behaviour. Googlebot's live-test rendering environment has slightly different timeouts and resource budgets than its indexing crawler. A live test that just barely renders may fail to index in practice.
The HTML tab is rendered HTML, not source HTML. If you want to see what your server returned before JavaScript execution, use
view-source:in Chrome or cURL.The screenshot is partial. Don't judge a page's full rendering quality from the screenshot alone.
Some enhancement reports lag. Structured data changes can take days to reflect even in cached inspections.
Conclusion
URL Inspection is where SEO diagnostics and web engineering meet. Used superficially, it's a "is this indexed?" checker. Used properly, it's the fastest path to understanding exactly why a page isn't ranking, whether a fix has deployed correctly, what Google's rendering pipeline produced, and which resource or directive is standing in your way.
URL inspection is super-useful, it allows SEOs to get a page by page understanding of index state, render, HTML output and more.
Ready to transform your SEO?
Join thousands of SEO professionals using SEO Stack to get better results.
Start Free 30 Day Trial