Why is Data Missing from Google Search Console? Missing Click Query Data & Sampled Data?

Daniel has 25+ years SEO experience & loves everything SEO including testing, ranking & getting clients results
Like me, If you’ve ever looked at the click totals in Google Search Console and thought “something doesn’t add up,” you’re not imagining it. The data genuinely doesn’t add up and that’s by design.
Google Search Console (GSC) is the single most important free tool for understanding your organic search performance. But it has a secret that new SEOs (or junior SEOS) are unaware of: it doesn’t show you all your data. In fact, research from Ahrefs across 887,534 GSC properties found that nearly 47% of all clicks are attributed to anonymised queries meaning almost half of your click data has no associated search term.
Here we break down exactly why your GSC data is incomplete, what’s happening behind the scenes with anonymised queries, data limits, Bloom filters, and sampling and crucially, how to identify and work around these gaps. Whether you’re an in-house SEO, consultant, agency strategist, or site owner trying to make sense of your numbers, this is important reading.
Google Search Console is a FREE tool - it costs Google money to store and process data, so not all data is accessible via the interface - which is why many SEOs default to alternative solutions such as Looker Studio with Google BigQuery, or solutions like SEO Stack, SEO Gets etc.
1. GSC Doesn’t Give You All Your Data
The first thing every SEO needs to understand is that Google Search Console imposes strict limits on the data it exposes to you. These limits exist across the web interface, the API, and even the newer BigQuery bulk export.
Here are some of the common row limits across Google's own platforms:
The Row Limits
Access Method | Row Limit | Notes |
GSC Web Interface | 1,000 rows | Maximum visible or exportable per report view |
Search Analytics API | 50,000 rows per day | Per site, per search type. Default returns 1,000 must use rowLimit and pagination |
Looker Studio Connector | 50,000 rows per day | Same underlying API identical limits apply |
BigQuery Bulk Export | No hard row limit | Most complete dataset, but still subject to privacy filtering. Requires Owner access and SQL knowledge |
For a website with tens of thousands of ranking pages and hundreds of thousands of query/page combinations, the 1,000-row limit in the UI means you’re only seeing the tip of the iceberg when it comes to available data. Even the API’s 50,000-row limit can be hit easily on larger sites when you combine dimensions like query + page + device + country.
Google’s own documentation states: “Due to internal limitations, Search Console stores top data rows and not all data rows.” The data returned is sorted by clicks in descending order, with no secondary sort meaning low-traffic queries and long-tail terms are the first to be dropped.
Some SEO's will argue that "do we really need access to all the data", the reality is yes we do, because ultimately, if we have all the data we can make better decisions when it comes to strategy / execution etc.
What This Means in Practice
Imagine you have a website that ranks for 25,000 unique queries in a given month. In the GSC interface, you’ll see the top 1,000 of those. Through the API, you might retrieve up to 50,000 rows but if you’re pulling query + page combinations across multiple devices and countries, you may still miss a significant chunk of your long-tail data. This missing data isn’t lost at the chart level though it’s still counted in the performance totals. And that’s where the confusion begins.
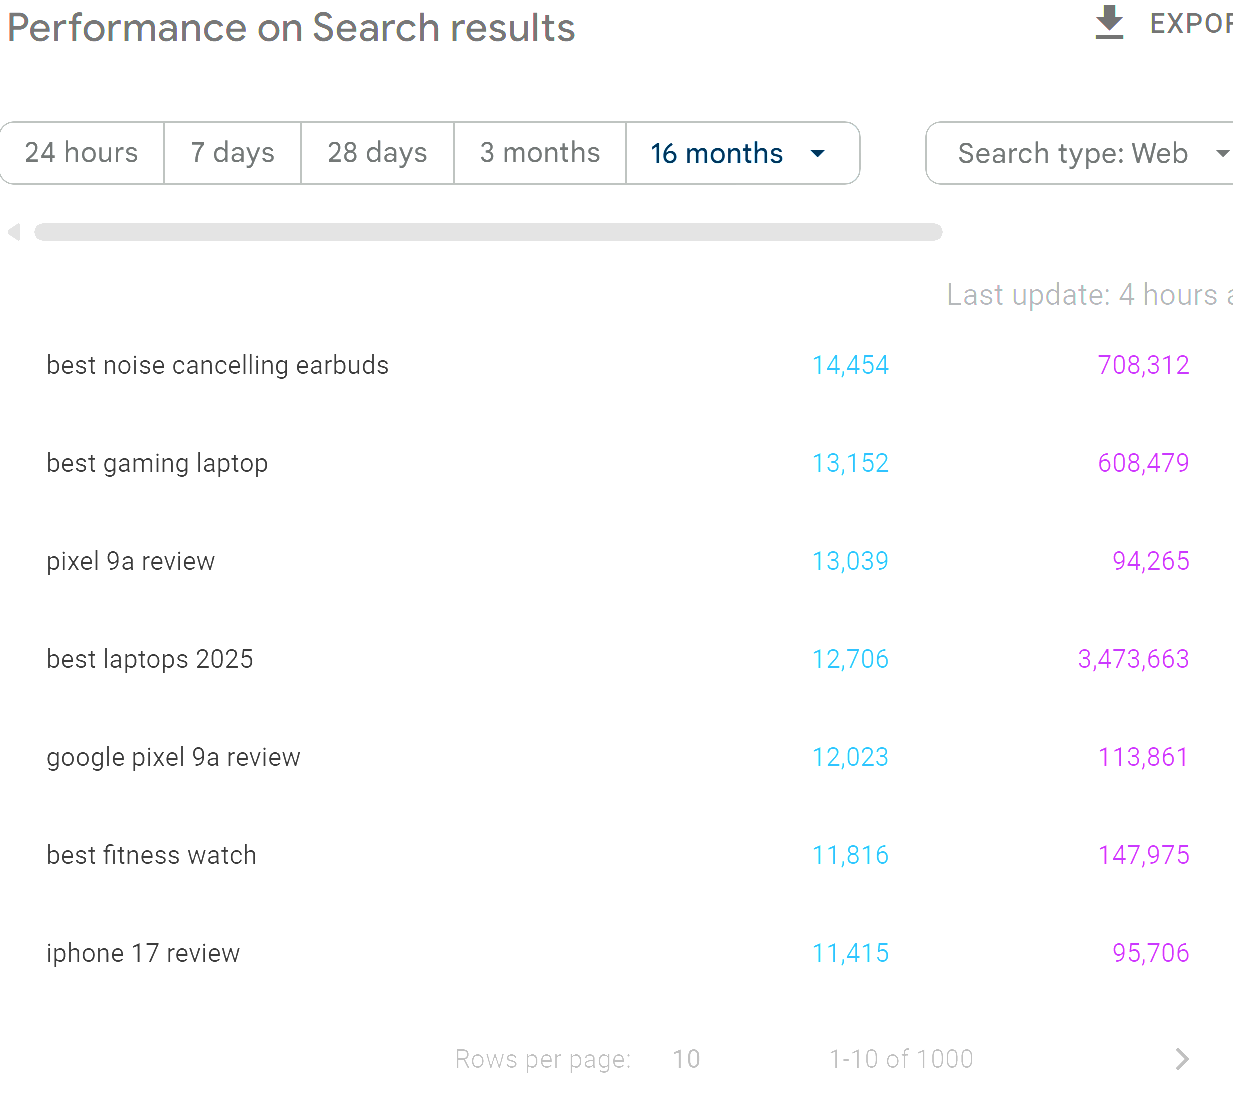
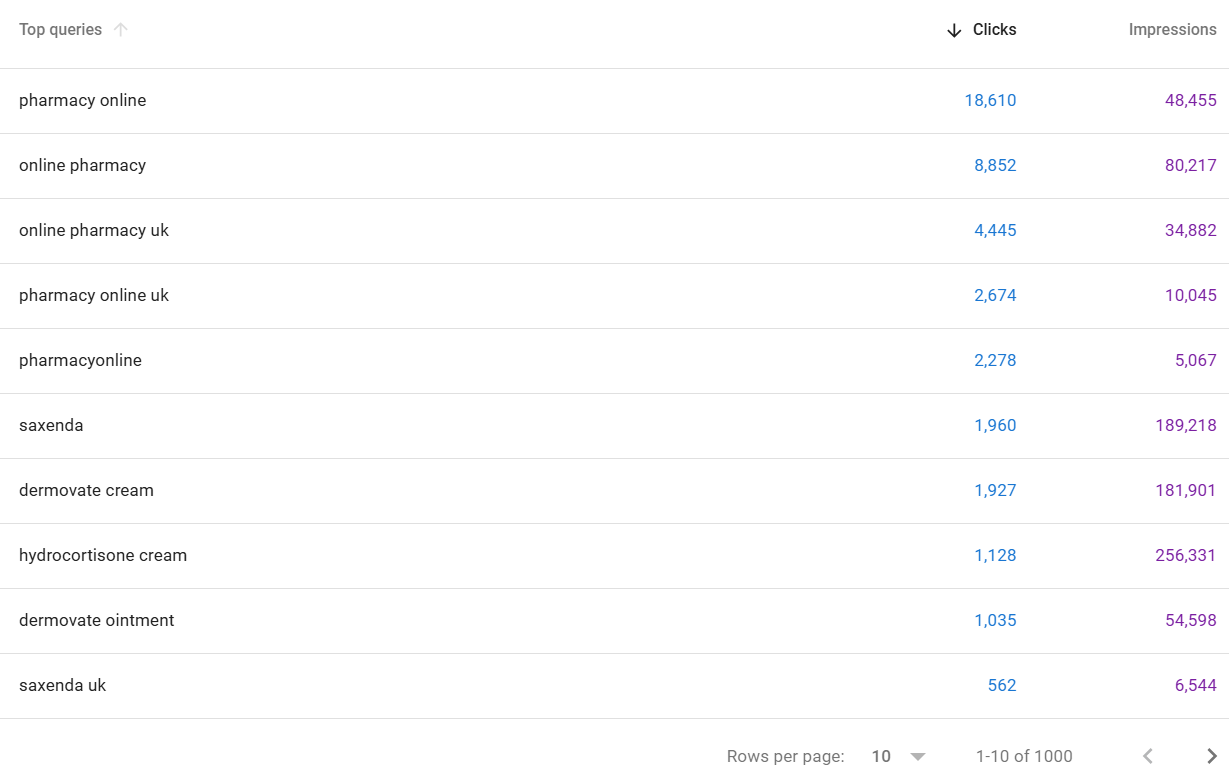
So - using the Google Search Console interface, you'll only ever be able to access the first 1000 queries in relation to any applied filters:
There are a SIGNIFICANT volume of queries that you won't see, even when you filter downwards the data is always limited to a maximum of 1000 rows (unless you are comparing - but usually this remains below 1500 queries).
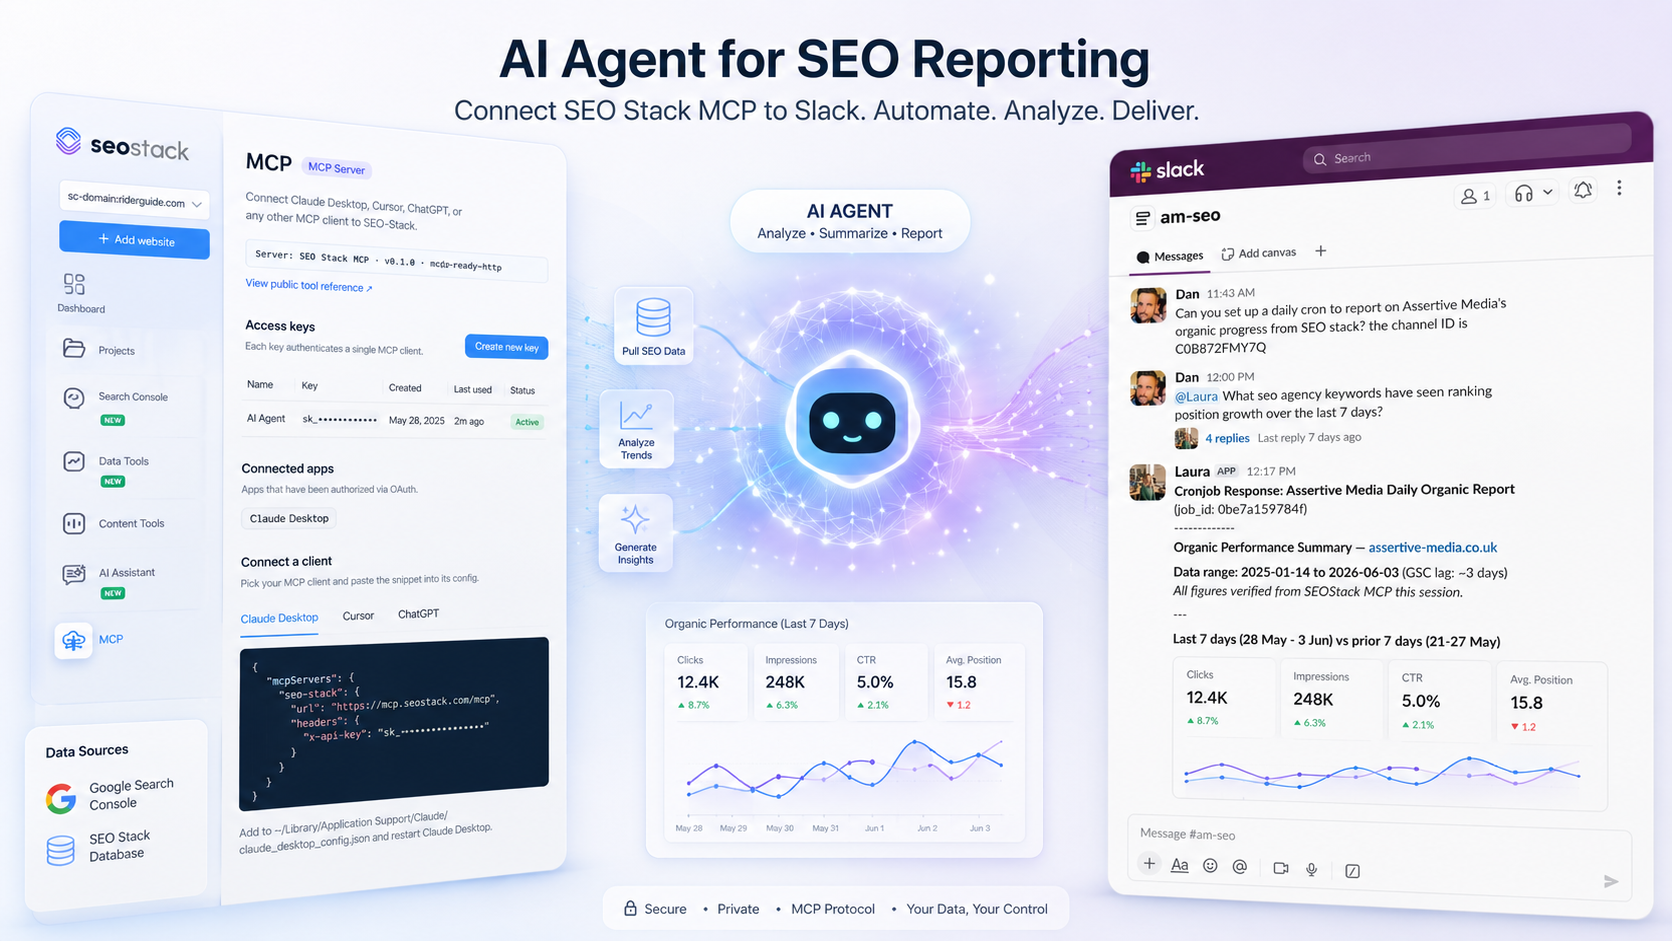
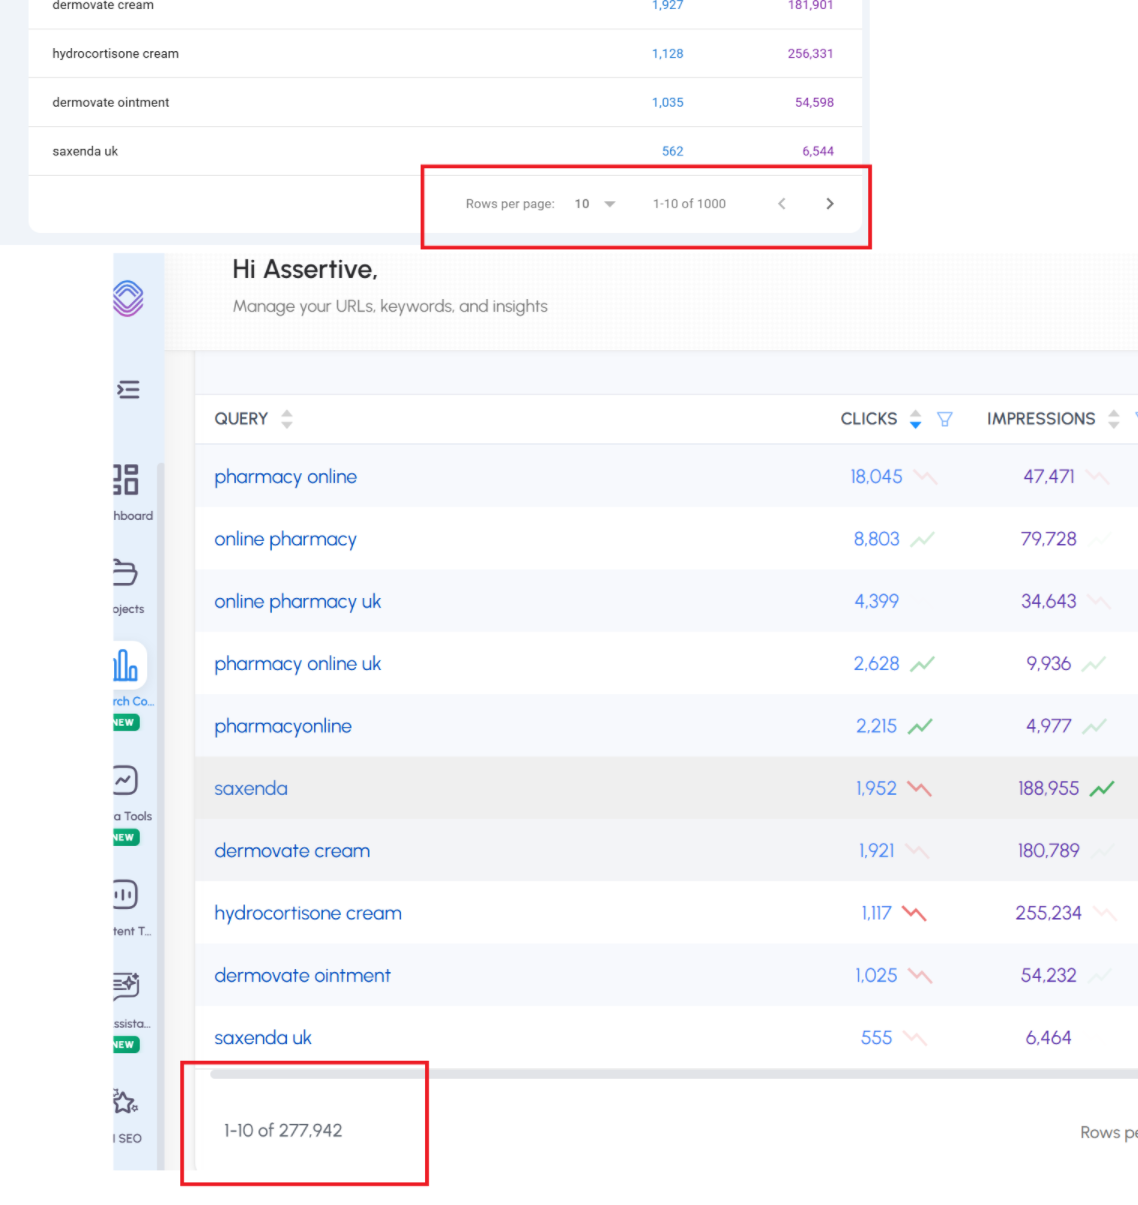
This is why in SEO Stack we took away the limitations when it comes to Google Search Console:
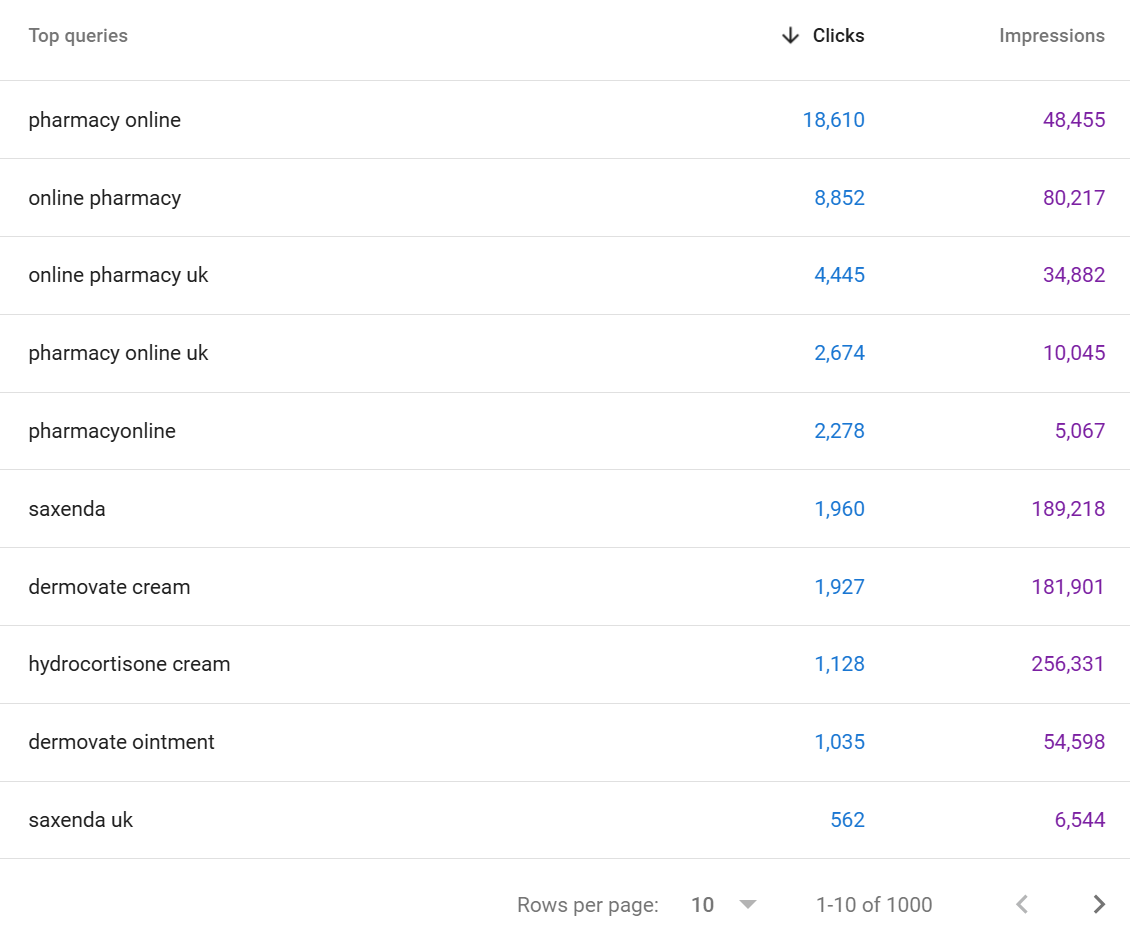
So for our client pharmacyonline.co.uk - we see 1000 queries in GSC, If we look at the same URL property in SEO stack we see >
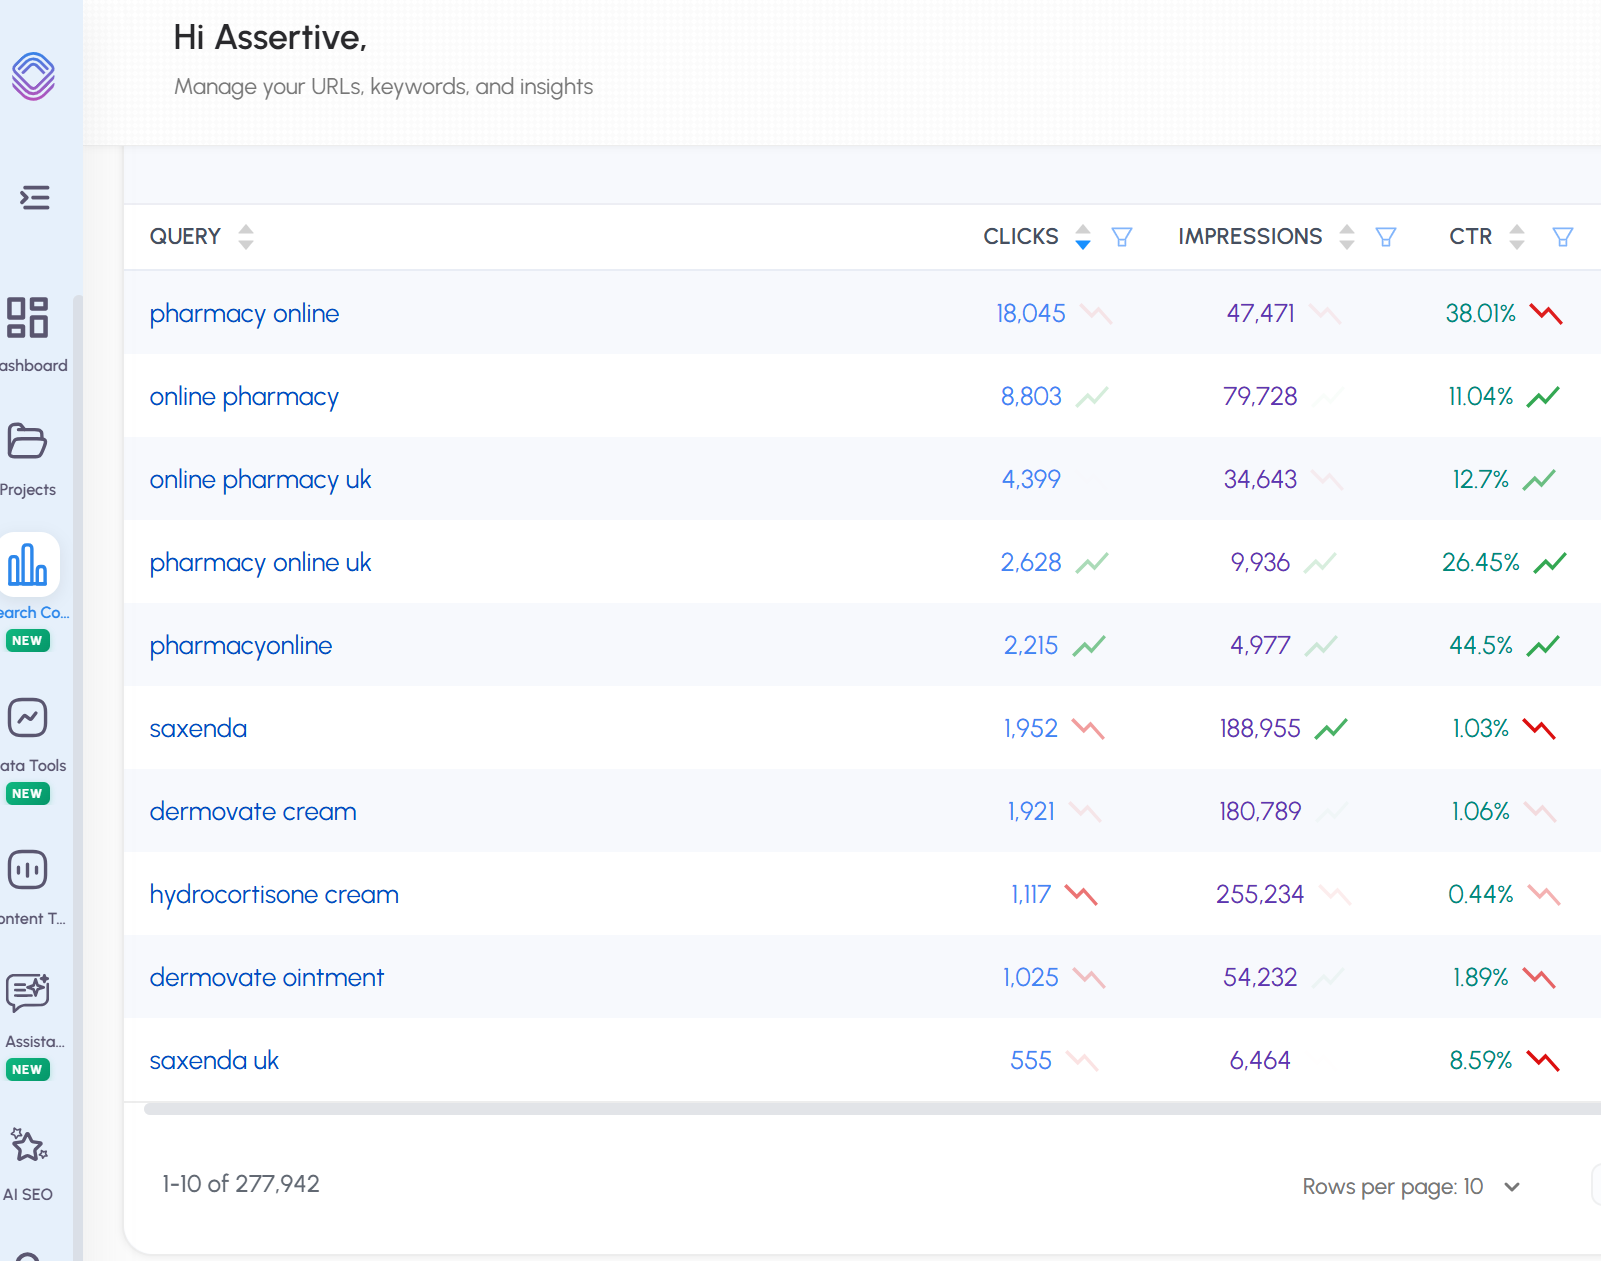
We see 277,942 queries.
In short - SEO Stack unlocks the data from Google Search Console because we warehouse and make the data accessible.
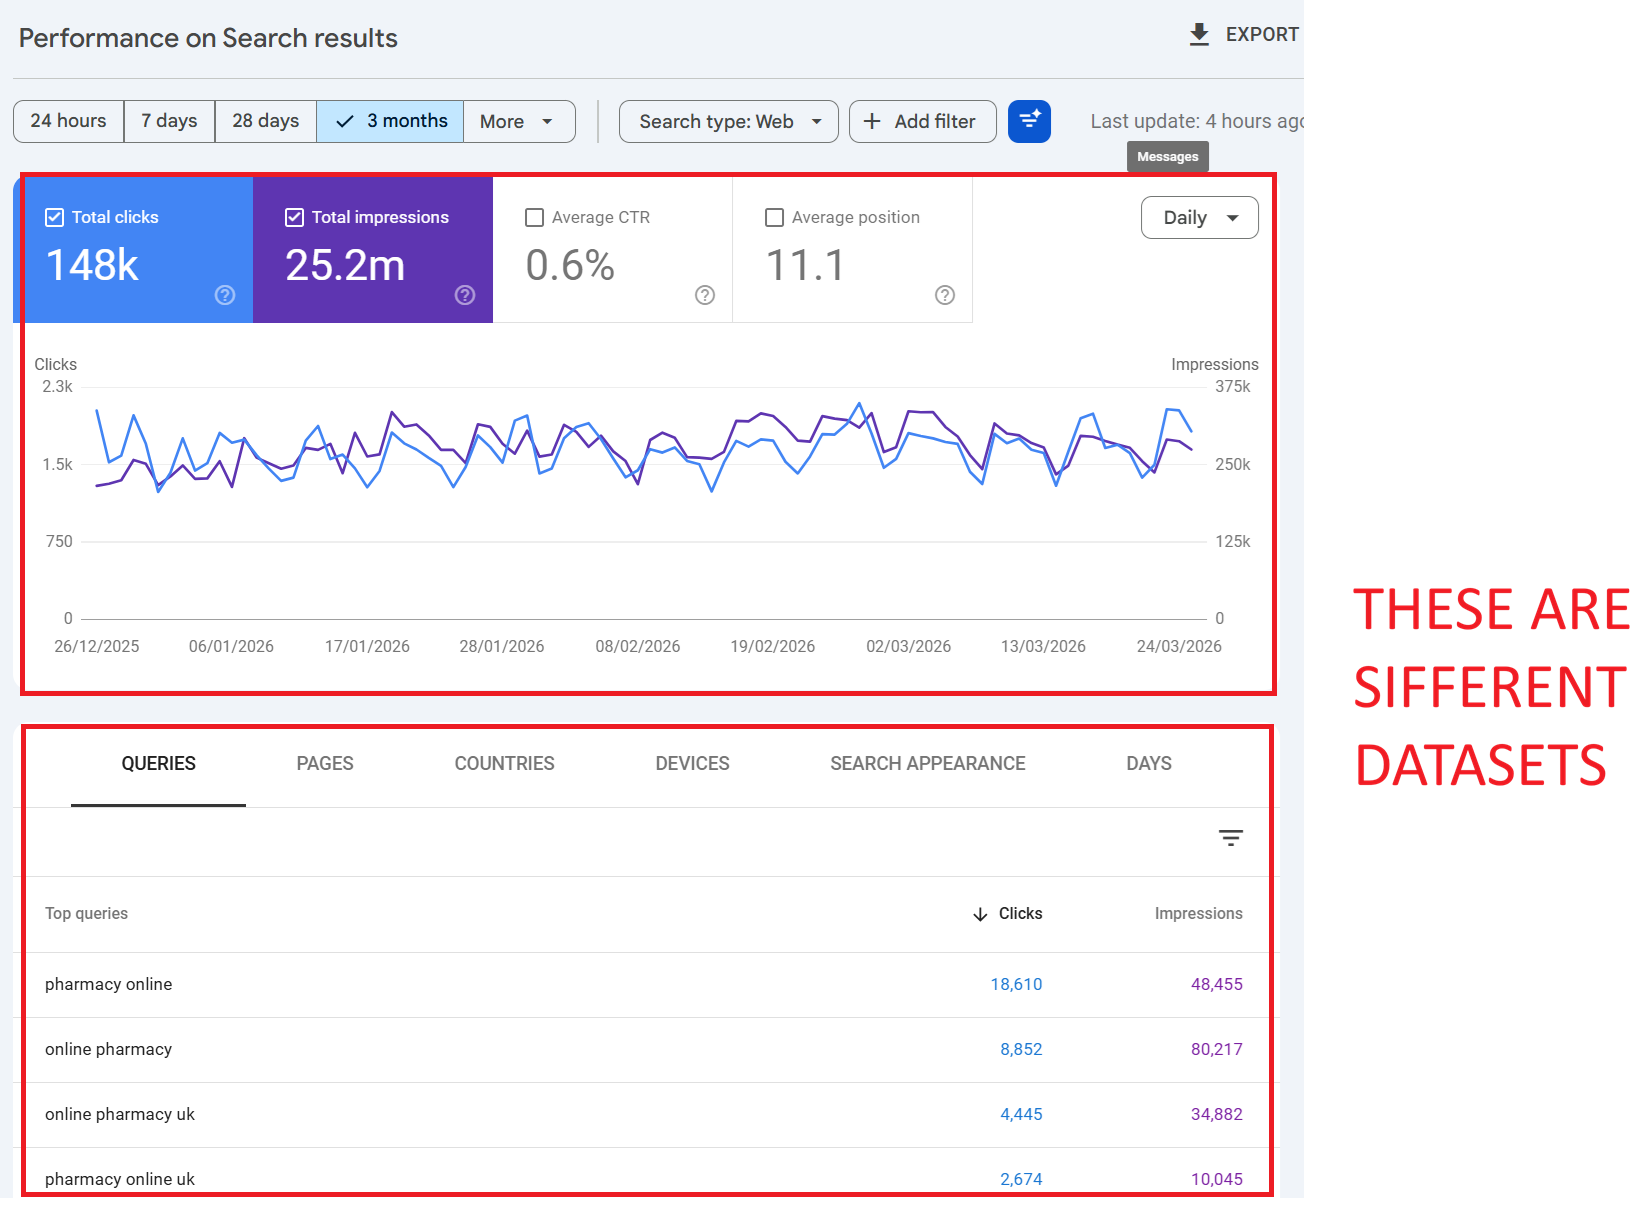
2. The Chart and the Table Are Different Datasets
This is one of the most misunderstood aspects of Google Search Console, and it catches out even experienced SEOs. The performance chart at the top of the report and the data table below it are not showing the same data.
How the Chart Works
The chart shows aggregated totals for your entire property. When no filters are applied, the chart includes all clicks, impressions, CTR, and position data including clicks from anonymised queries. It represents the complete picture of what Google recorded for your site.
How the Table Works
The table below the chart, however, only shows data for identified, non-anonymised queries. If Google can’t attribute clicks to a specific named query (because the query was anonymised for privacy), those clicks simply don’t appear in the table. There’s no “anonymised queries” row the data is just absent.
The Result
If you sum up every row in the query table, your total will almost always be lower than the chart total. The difference is the anonymised query data clicks that happened, that Google recorded, but that have no query string attached for you to see.
💡 Example: Your chart shows 10,000 clicks for the month. You export all query rows and sum the clicks you get 5,400. The remaining 4,600 clicks came from anonymised queries. Google recorded them, but won’t tell you what people searched for.
3. Why Is Query and Click Data Missing?
There are several distinct reasons why your GSC data is incomplete. Understanding each one is critical for interpreting your reports correctly.
Reason 1: Anonymised Queries (Privacy Filtering)
This is the biggest factor. Google defines anonymised queries as those “that aren’t issued by more than a few dozen users over a two-to-three month period.” These queries are stripped from the data tables entirely to protect user privacy.
The scale of this is significant. Ahrefs’ 2025 study across 22 billion clicks found that anonymised queries accounted for 46.77% of all clicks on average. For some websites, the figure exceeded 80%. The distribution varies enormously: sites with lots of long-tail, niche, or proprietary search terms see far more anonymisation than sites dominated by a handful of high-volume head terms.
Key point: this isn’t about query volume to your site it’s about how many unique users across the entire web searched for that term. A query could drive 50 clicks to your site, but if only 20 people globally searched for it over 3 months, Google will anonymise it.
Reason 2: Row Limits and Data Truncation
As covered above, GSC stores and serves only the “top” rows of data. Google prioritises rows with the highest click counts. If your site has thousands of query/page combinations, the ones at the bottom typically long-tail queries with 1–2 clicks simply get dropped. This is separate from anonymisation; these queries may have enough unique searchers to be identified, but they get cut from the dataset due to storage and processing limits.
Reason 3: Data Processing Lag
GSC data is typically delayed by 2–3 days. Data for the most recent days may be incomplete or absent entirely. This is normal processing delay and the data will eventually populate, but it can cause confusion if you’re checking reports in real-time.
Reason 4: Property Type and Aggregation Differences
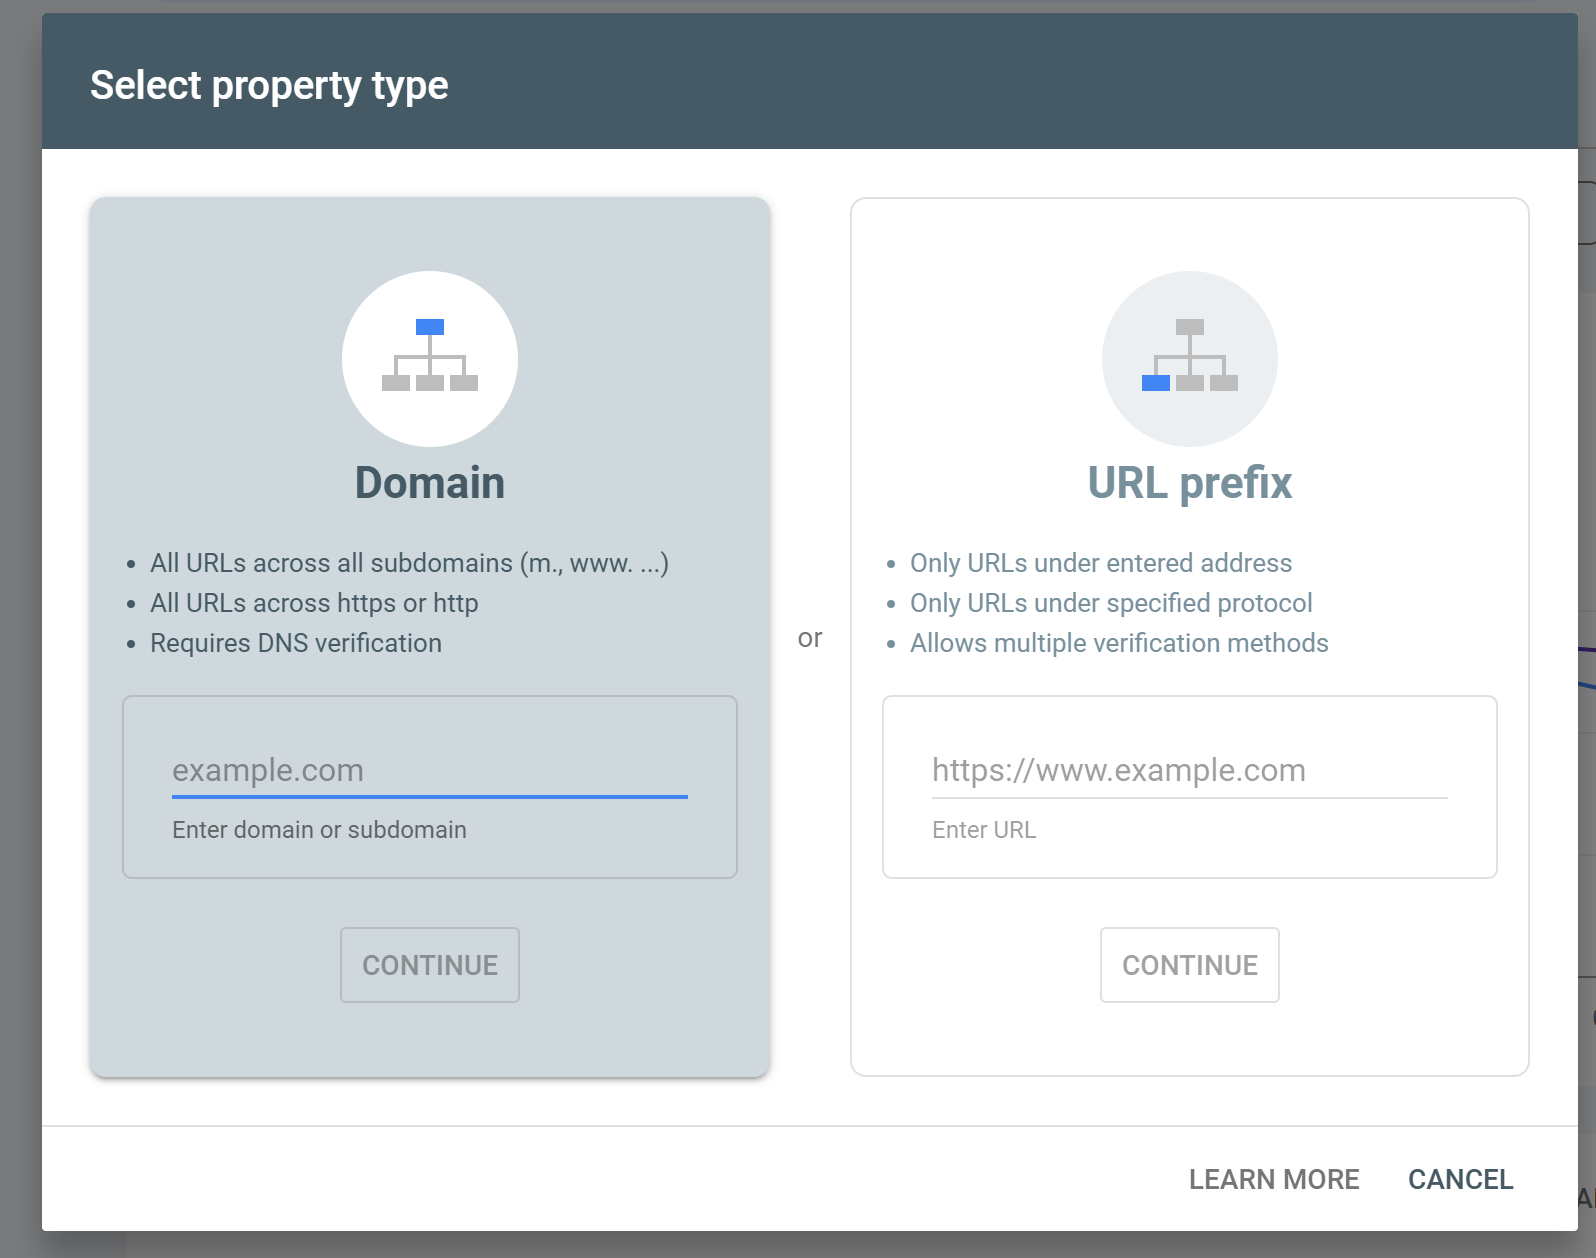
How data is aggregated depends on whether you’re using a Domain property or a URL-prefix property, and whether data is aggregated at the property level or the page level. Switching between these contexts can cause totals to change unexpectedly particularly when the aggregation method changes from property-level to page-level, which can actually increase reported numbers because more granular data points are being surfaced.
Reason 5: Sensitive or Personal Queries
Beyond the volume threshold, Google also strips queries that contain personal or sensitive information. Health queries, financial details, and other personally identifiable search behaviour may be removed regardless of search volume. Google’s documentation explicitly notes it may not track queries that contain “personal or sensitive information.”
4. Does Google Search Console Sample Data?
This is a common question, and the answer is nuanced. GSC does not “sample” data in the way Google Analytics (UA) was known to sample session data for high-traffic reports. Google does not randomly select a subset of clicks and extrapolate.
However, GSC does truncate and filter data in ways that produce a similar effect. The combination of privacy filtering (anonymised queries), row limits (top data rows only), and Bloom filter approximations means that what you see is not a random sample, but it is an incomplete representation of the full dataset.
Google’s own language from their deep-dive documentation is telling: “We believe the remaining data will be large enough to create a representative sample of data.” Note the word “sample” even Google acknowledges that what you’re seeing is a representative subset, not the complete picture.
The practical impact is that for most small to medium sites, the data is reasonably complete. For larger sites with diverse query profiles, the data gaps can be significant. The more dimensions you add (query + page + country + device), the more data gets trimmed.
5. Bloom Filters: The Hidden Reason Your Numbers Don’t Match
In September 2023, Google’s Gary Illyes directly addressed a long-standing mystery: why does filtered data in GSC sometimes show MORE clicks than unfiltered data? The answer: Bloom filters.
What Is a Bloom Filter?
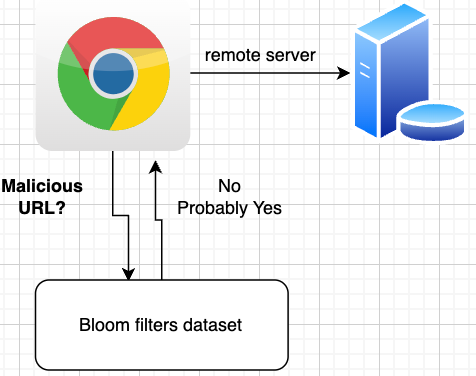
A Bloom filter is a probabilistic data structure invented in 1970 by Burton Howard Bloom. It’s designed to test whether an element is a member of a set extremely quickly and with minimal storage. The trade-off is that it can produce false positives (saying something is in the set when it isn’t) but never false negatives (it won’t say something isn’t there when it is).
How Google Uses Bloom Filters in GSC
Gary Illyes explained that Google processes billions, potentially trillions, of data items for Search Console reporting. Looking up specific items in datasets that large is computationally expensive. Bloom filters solve this by creating a smaller, hashed version of the data that can be consulted first.
In Illyes’ words: “Bloom filters speed up lookups by predicting if something exists in a data set but at the expense of accuracy, and the smaller the data set is, the more accurate the predictions are.”
The hashing process can result in data loss either intentionally or as an unavoidable side-effect of the compression. This is why:
• Applying a page filter can increase your click total because the more specific (smaller) dataset passes through the Bloom filter with greater accuracy, recovering data that was lost in the broader, unfiltered view.
• Removing a filter can decrease your totals because going back to the larger, property-level aggregation reintroduces the Bloom filter’s approximation errors.
• Include + exclude filter totals don’t equal the unfiltered total because each filtered subset passes through the Bloom filter independently, and the approximation errors are different for each pass.
💡 Think of it like this: Google is using a very efficient approximation engine rather than exact counting. It’s fast, but the rounding errors accumulate differently depending on how you slice the data. The smaller the slice, the more accurate it tends to be.
6. Practical Examples: Try This in Your Own GSC Account
The best way to understand these data gaps is to see them for yourself. Here are several exercises you can run right now in Google Search Console.
Exercise 1: The Brand Query Mismatch
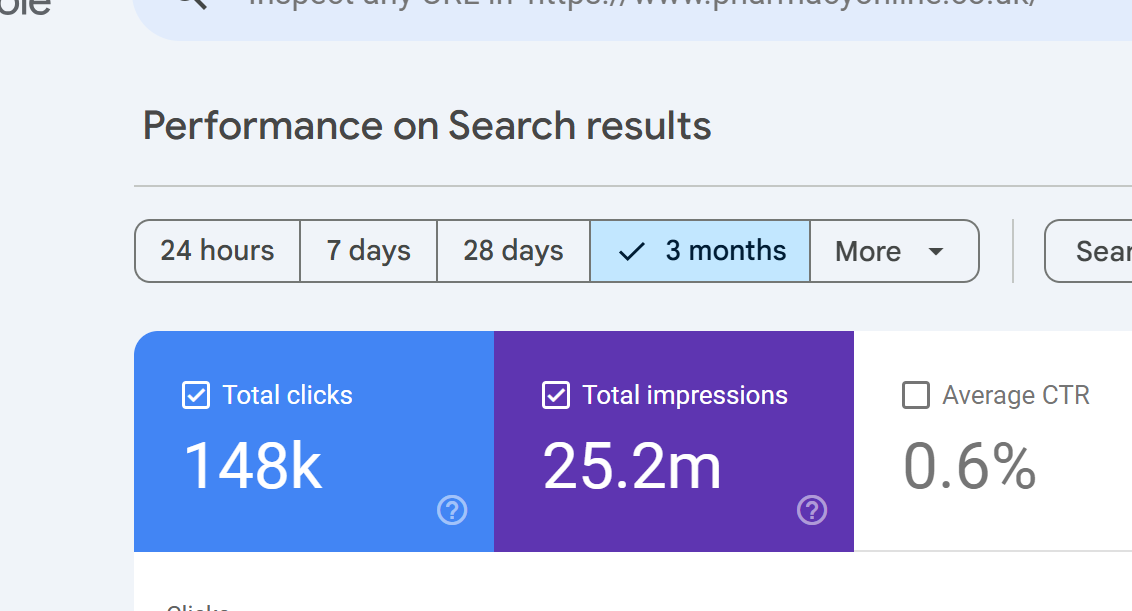
What to do: Open GSC > Performance > set a 3-month date range. Note the total clicks on the chart (let’s say it shows 15,000 clicks).
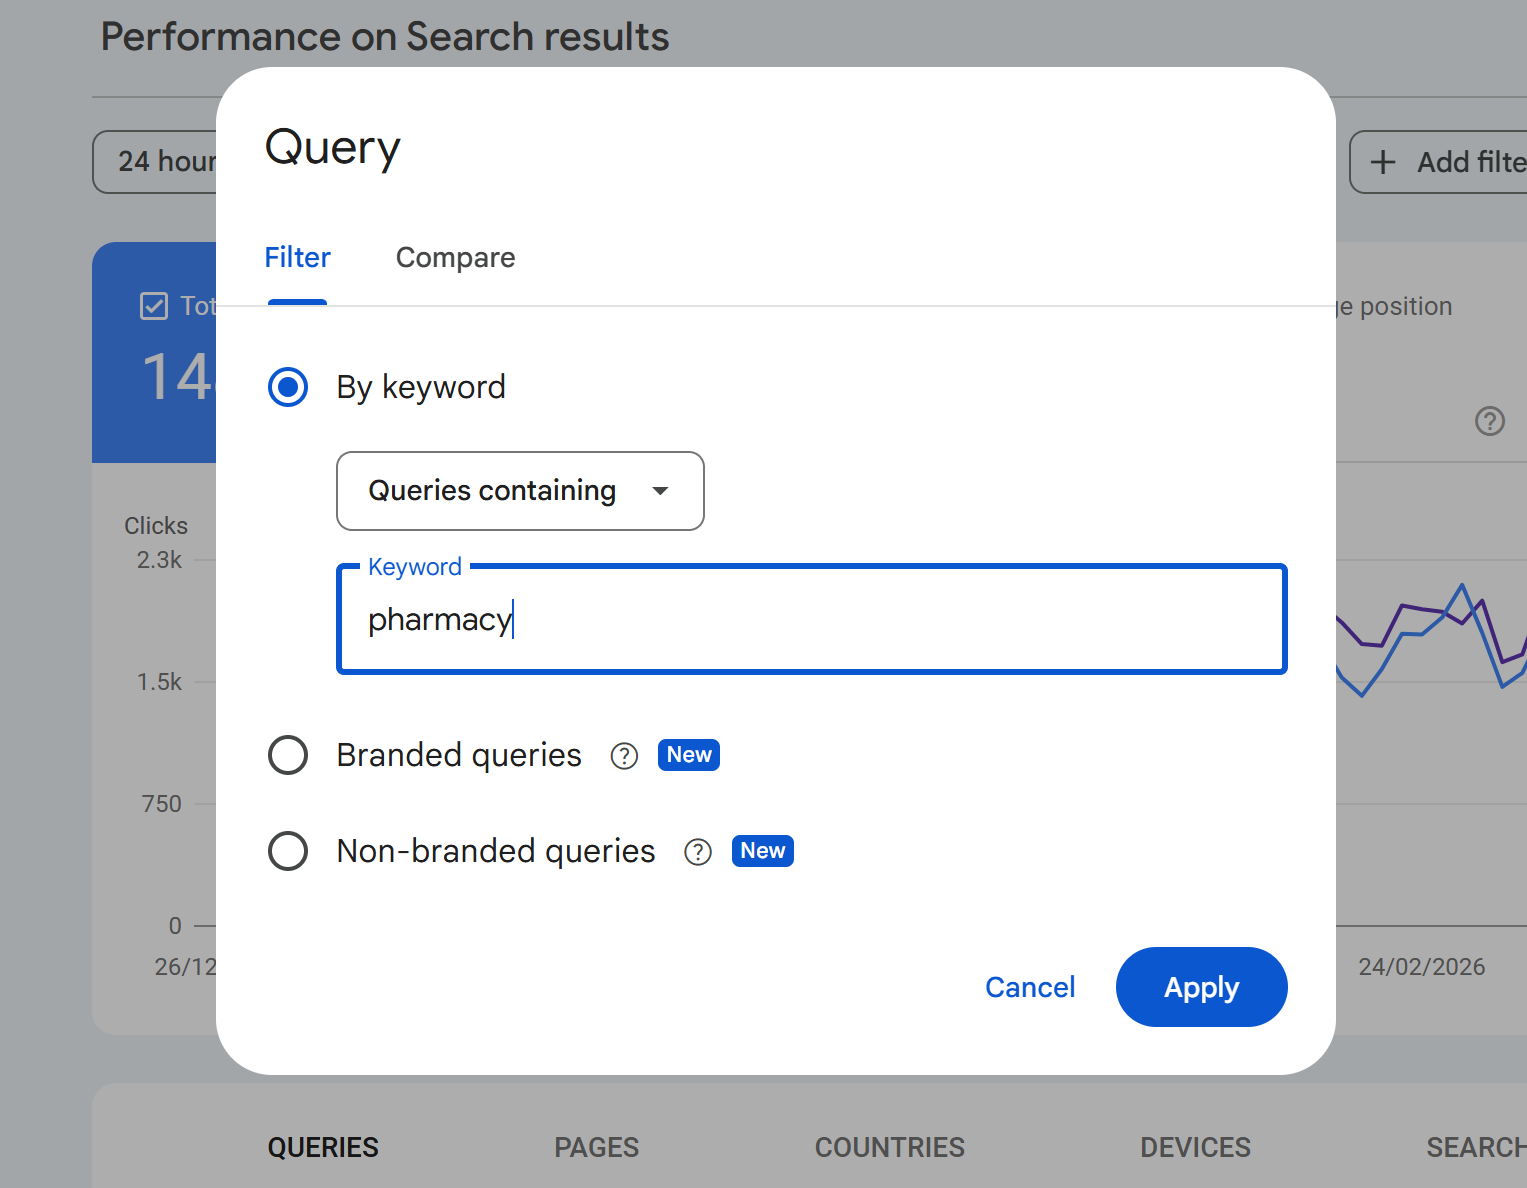
Now add a query filter: Queries containing “yourbrand”. The chart might show 4,200 clicks.
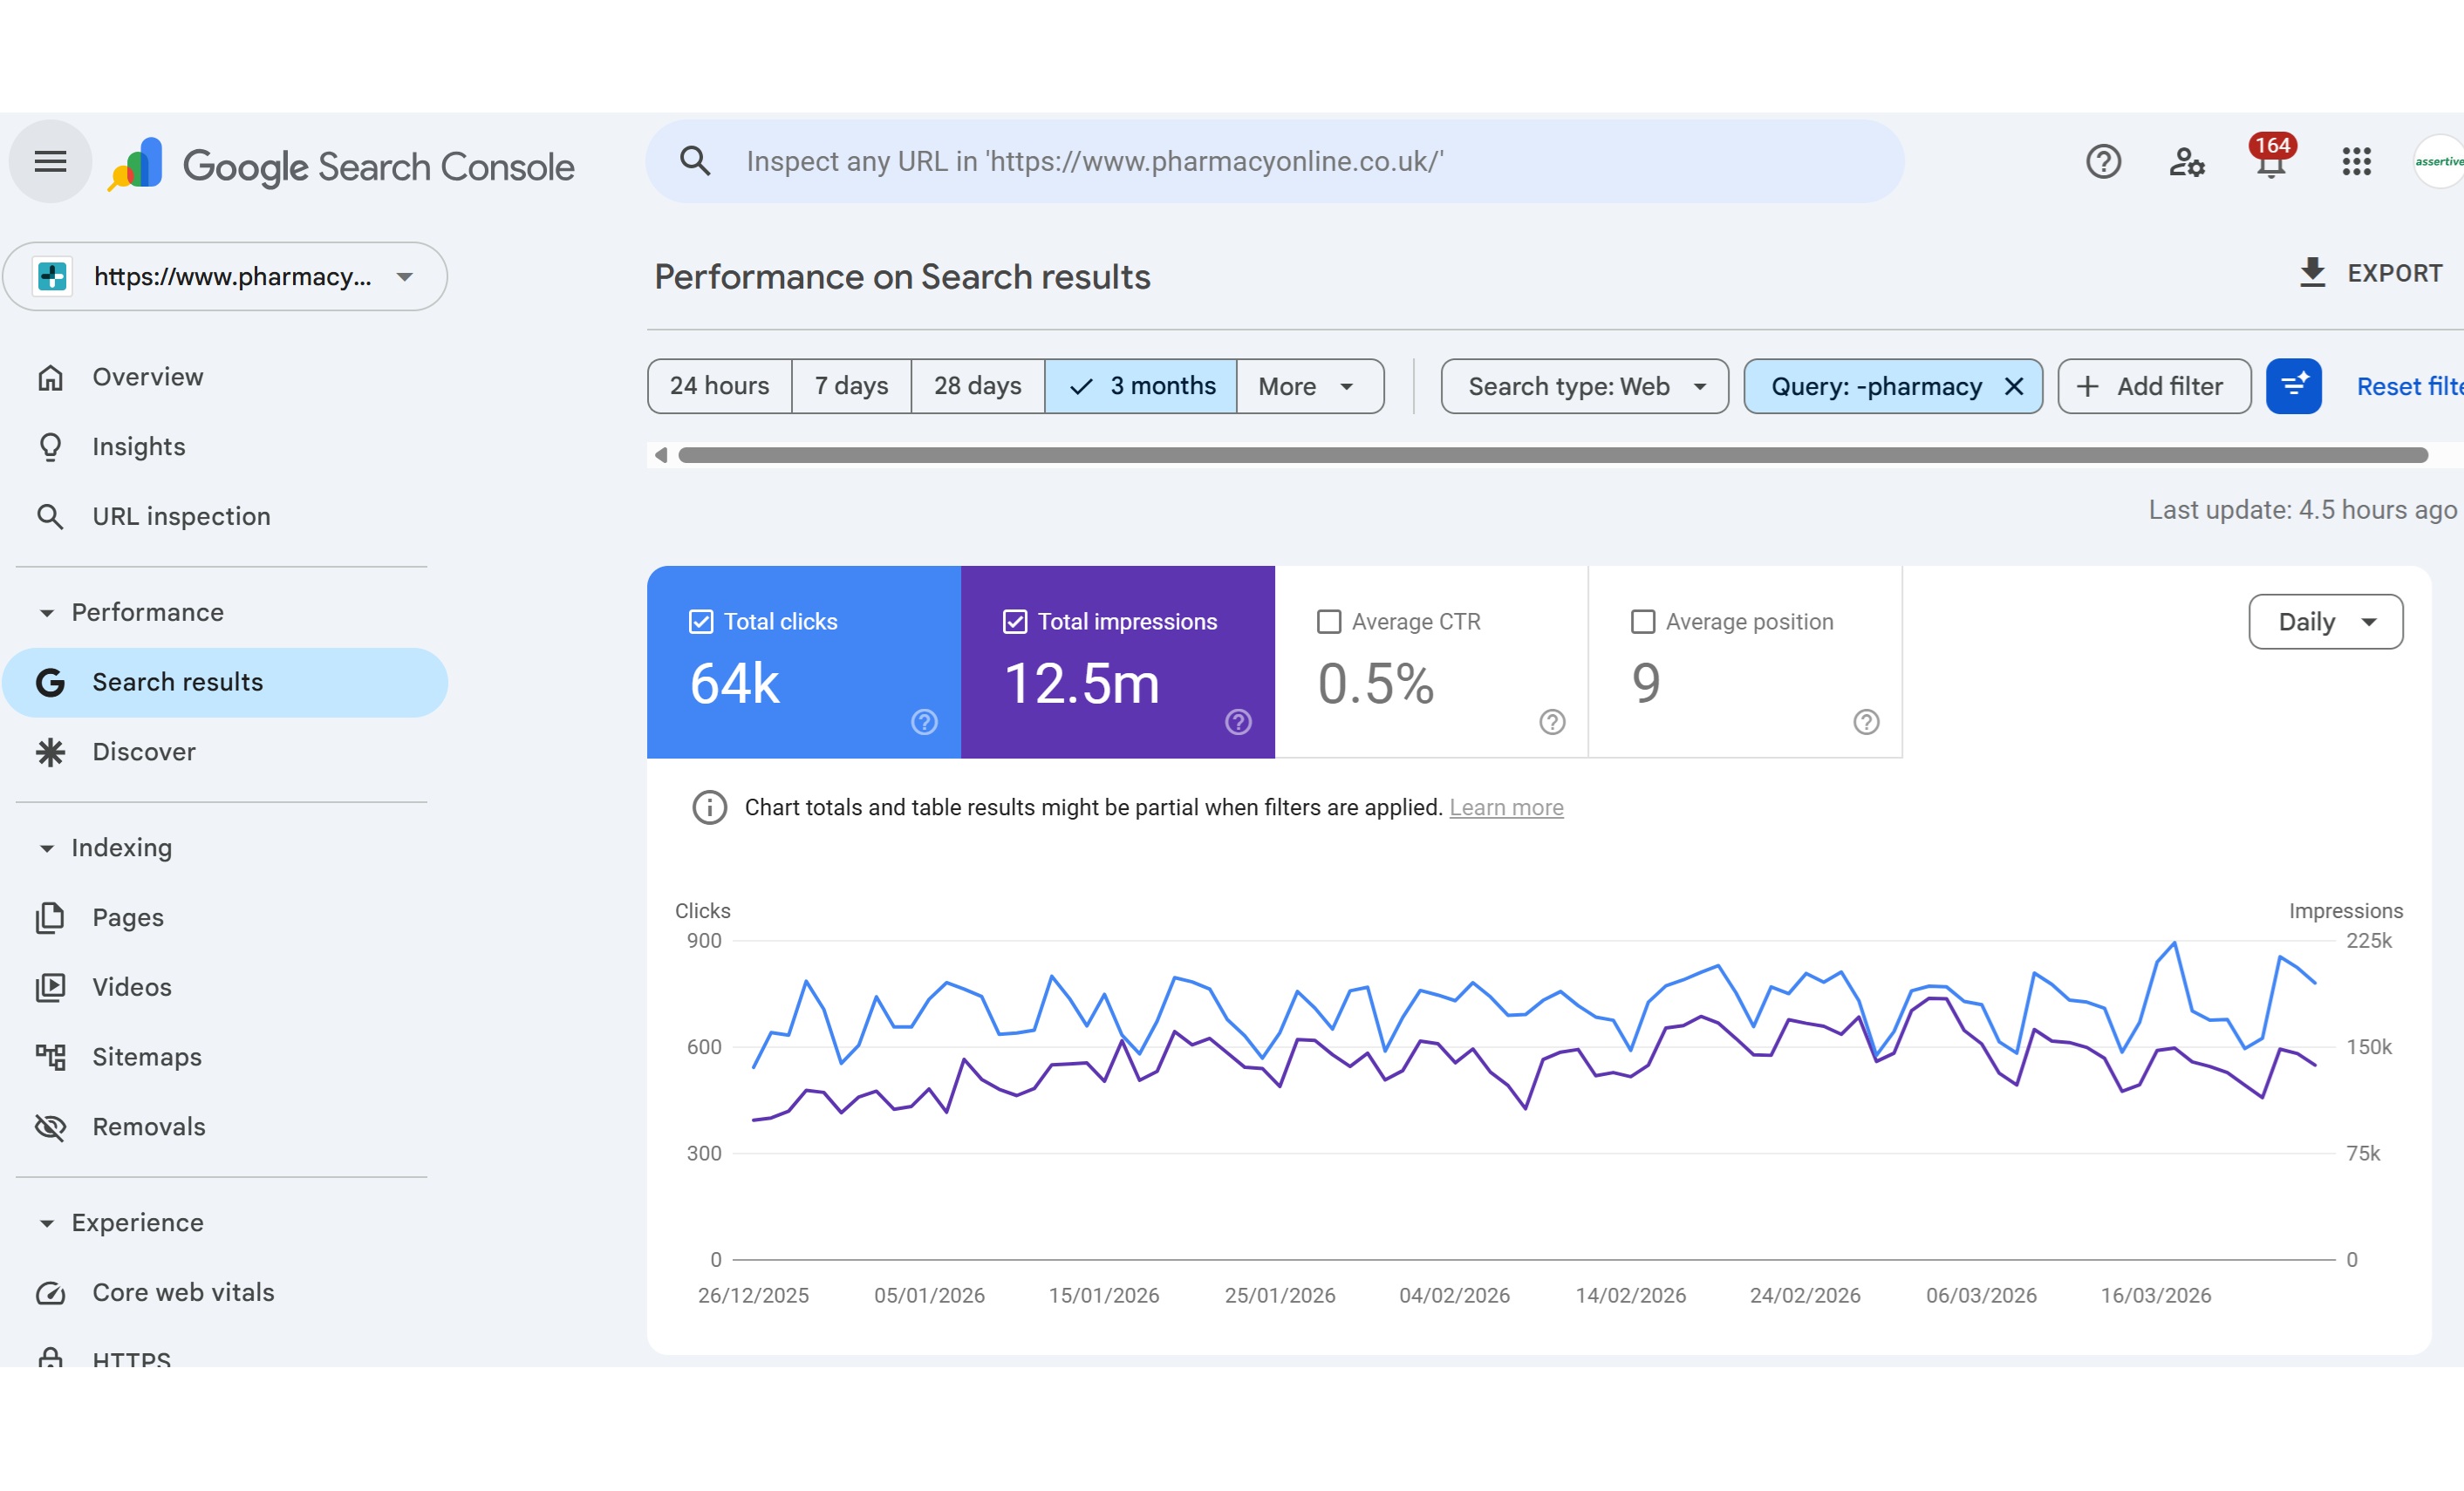
In this example we apply the query containing "pharmacy"
Change the filter to: Queries NOT containing “yourbrand”. The chart might show 6,300 clicks.
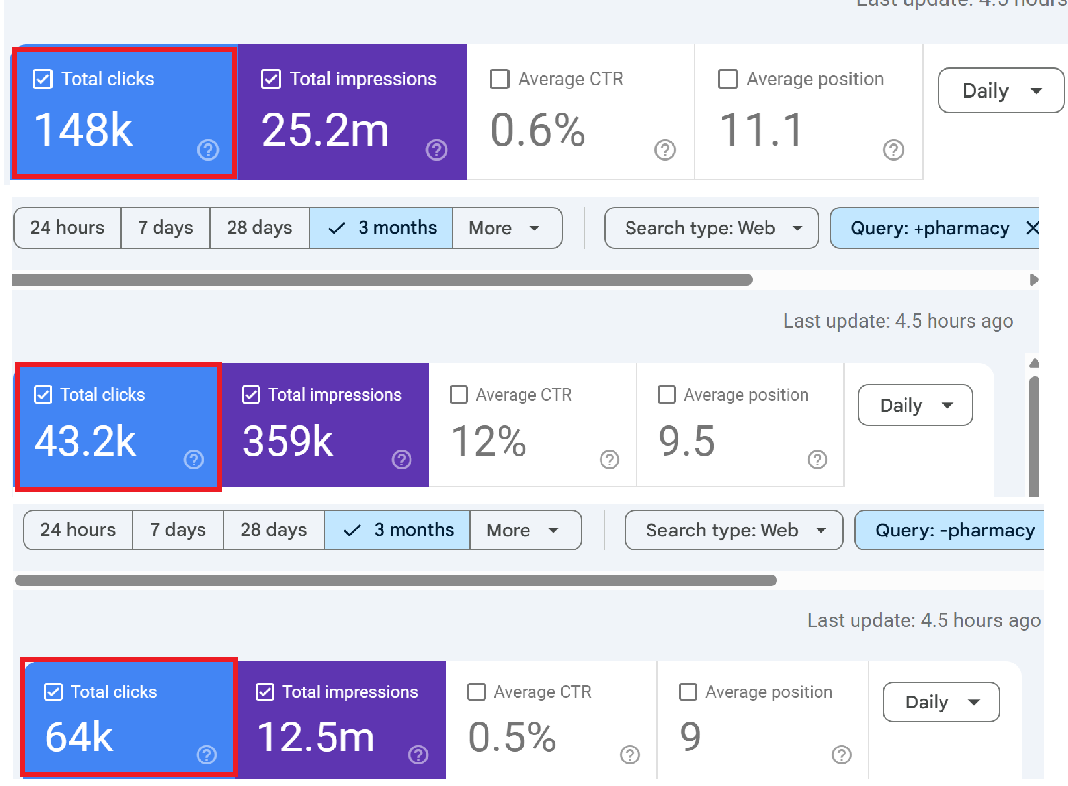
4,200 + 6,300 = 10,500. But the unfiltered total was 15,000. Where are the missing 4,500 clicks?
What’s happening: When you apply any query filter (including or excluding), GSC drops all anonymised queries from the totals. Those 4,500 clicks came from queries that Google anonymised. Without any filter, they’re included in the chart total. With a filter applied, they vanish completely because Google can’t evaluate whether an anonymised query contains or doesn’t contain your brand name.
Exercise 2: Chart Total vs. Table Sum
What to do: In the Performance report with no filters applied, note the total clicks on the chart. Then click into the “Queries” tab below and export all rows to a spreadsheet. Sum the clicks column.
What you’ll find: The sum of clicks in the table will be lower than the chart total. The gap is your anonymised query data. For many sites, this gap will be 30–60% of the total.
Exercise 3: Page Filter Increases Clicks
What to do: Note your unfiltered total clicks. Then add a page filter for your most popular URL (e.g., Pages containing “/your-top-page/”). Look at the total.
What might happen: In some cases, the filtered total for that page will be higher than what the unfiltered report showed for the same page in the table. This is the Bloom filter at work the smaller, more specific dataset is being processed with greater accuracy, surfacing data that was lost in the broader aggregation.
Exercise 4: Country Filtering Gaps
What to do: Look at your total clicks. Then filter by country say, United Kingdom. Note the clicks. Then switch to United States, and note those clicks. Add up all the countries you filter individually.
What you’ll find: The sum of individual country clicks won’t equal the total, because many clicks aren’t attributed to a specific country, and each filter pass introduces its own Bloom filter approximation error.
Exercise 5: Stacking Filters Amplifies the Gap
What to do: Start with a page filter for a specific URL. Note the clicks. Now add a query filter on top. Now add a country filter. With each additional filter, more data disappears.
Why: Each filter compounds the effect. Anonymised queries are dropped with any query filter. Row limits trim more aggressively when multiple dimensions are in play. And Bloom filter approximation errors accumulate with each additional filtering pass. The more specific you get, the less complete your data becomes a frustrating paradox for anyone trying to do granular analysis.
7. Common Questions About GSC Missing Data
Q: Why do my Queries and Pages click totals not match?
The Queries report and Pages report use different aggregation methods. The Queries report counts clicks per query, while the Pages report counts clicks per page. A single click can appear in both a query row and a page row, but anonymised queries are excluded from the Queries report while the corresponding page click is still counted in the Pages report. Additionally, a single page can rank for multiple queries, and a single query can lead to multiple pages so deduplication works differently in each view.
Q: Is this just a problem with the free GSC interface?
No. The API has higher row limits (50,000 vs 1,000) but is subject to the same privacy filtering and Bloom filter behaviour. Even the BigQuery bulk export, which is the most complete data source, still contains anonymised queries marked as NULL values you can see that traffic exists, but you still don’t know what people searched for. However, BigQuery does show a lower anonymisation rate because it captures more borderline-volume queries that the API drops.
Q: My site is small does this affect me?
Yes, often disproportionately. Smaller sites tend to receive traffic from many low-volume, long-tail queries. Because anonymisation is based on how many unique users globally searched for a term, small sites with niche audiences often have a higher percentage of anonymised data. Research from SEO Gets found that small sites had query visibility as low as 0–37%, with an average of just 18.3%.
Q: Can I recover the missing query data?
Not directly from Google. However, you can cross-reference GSC data with third-party tools like Ahrefs, Semrush, or SEO Stack to identify queries that are likely driving traffic but not appearing in GSC. The BigQuery export also preserves anonymised query rows (with NULL query values), so you can at least quantify how much traffic is unattributed. SEO Stack’s extended data retention and AI-powered analytics can help you identify patterns in your long-tail traffic that GSC alone cannot reveal.
Q: Why did Google change its documentation from “very rare” to “some”?
Following the Ahrefs study in 2022 that showed nearly half of all clicks go to hidden terms, Google updated its help documentation to remove the claim that anonymised queries were “very rare.” The updated language now says “some queries” are anonymised. Danny Sullivan from Google acknowledged that long-tail terms that are individually rare can add up to a significant proportion of total traffic.
Q: Why does filtering by a specific page sometimes show more clicks than the unfiltered data?
This is the Bloom filter effect. When you apply a page filter, GSC switches from property-level aggregation to page-level aggregation. The smaller, more specific dataset passes through the Bloom filter with greater accuracy, which can recover data that was lost in the broader aggregation. It sounds counterintuitive, but it’s a direct consequence of how probabilistic data structures trade speed for accuracy.
Q: Is the data worse since AI Overviews launched?
Likely, though Google hasn’t confirmed this explicitly. AI Overviews and conversational search interfaces encourage longer, more natural language queries. Longer queries tend to be more unique, meaning fewer distinct users search for the exact same string. This pushes more queries below Google’s anonymisation threshold. Ahrefs’ 2025 study was conducted before the full rollout of AI Overviews, suggesting the actual current anonymisation rate may be even higher than 46.77%.
Q: Does GSC data match Google Analytics data?
No, and it shouldn’t. GA tracks sessions on your website (requiring JavaScript execution and page load). GSC tracks clicks from search results (recorded on Google’s side). Bot traffic, JavaScript failures, page load timeouts, redirects, and privacy settings all create discrepancies between the two. They’re measuring related but fundamentally different things.
8. What You Can Do About It
1. Use the API, not just the interface. The API gives you 50x more rows than the web UI. Tools like SEO Stack pull API data automatically and store it with extended retention, so you’re always working with the most complete dataset available.
2. Enable BigQuery bulk export. If you have Owner access, this is the most comprehensive data source. Anonymised queries appear as NULL values you can’t see the query text, but you can quantify and segment the unattributed traffic.
3. Don’t trust filter arithmetic. Accept that filtered totals won’t add up to unfiltered totals. Use unfiltered data for topline reporting and filtered data for directional analysis, not precise accounting.
4. Cross-reference with third-party data. Tools like Ahrefs, Semrush, and SEO Stack can surface query data that GSC anonymises. Ahrefs’ Anonymous Queries report specifically cross-references GSC data with their own ranking data to identify likely hidden terms.
5. Analyse at the page level for completeness. Research consistently shows that page-level data in GSC is much more complete than query-level data. Small sites show 97–102% of total clicks at the page level, compared to as low as 18% at the query level. If you need accurate click counts, use page dimensions rather than query dimensions.
6. Focus on trends, not absolutes. GSC data is directionally accurate even when it’s not perfectly complete. A 20% increase in clicks month-over-month is meaningful regardless of whether you can see every individual query. Use the data for trend analysis and strategic decisions, not penny-counting.
7. Use SEO Stack for extended retention and deeper analysis. Google only retains 16 months of performance data. SEO Stack stores your GSC data from the moment you connect, giving you long-term trend analysis that GSC alone cannot provide. Combined with AI-powered analytics, you can identify patterns in your data that manual GSC analysis would miss.
Conclusion
Google Search Console is an indispensable tool, but it’s not the complete truth. Between anonymised queries hiding nearly half your click data, row limits trimming your long-tail visibility, and Bloom filters creating arithmetic that doesn’t add up, there’s a significant gap between what actually happens in search and what GSC shows you.
Understanding these limitations doesn’t make GSC less useful it makes your analysis more honest. The SEOs who outperform their competitors are the ones who know what their data is actually telling them, work around the gaps, and use tools like SEO Stack to extend their visibility beyond what Google’s free interface provides.
The next time your GSC numbers don’t add up, you’ll know why. And more importantly, you’ll know what to do about it.
Sources & Further Reading
• Search Engine Land: Google Removes Language Calling Hidden Query Data ‘Very Rare’ (July 2022)
• SEO Gets: Google’s Dirty Little Secret Anonymous Queries (2024)
• Google Search Console Help Documentation: Search Performance Report
Ready to transform your SEO?
Join thousands of SEO professionals using SEO Stack to get better results.
Start Free 30 Day Trial