NavBoost Unpacked: What the Google Content Warehouse Leak Actually Tells Us About Click-Based Ranking

Daniel has 25+ years SEO experience & loves everything SEO including testing, ranking & getting clients results

Google spent years telling the SEO industry that clicks didn't matter. That dwell time was irrelevant. That CTR was noise. In fact, for many years I shouted about this on LinkedIn, many called me a conspiracy theorist.
“Dan, Google does not use behavioural data for rankings” or “what happens if a site doesn’t have GSC or google analytics setup”.
But, the reality is, I knew that Google was using this data, I ran so many SEO tests - I brought a couple of domains and tested out click manipulation using CTR Booster + residential proxies with randomised user agents and different page / interaction behaviour.
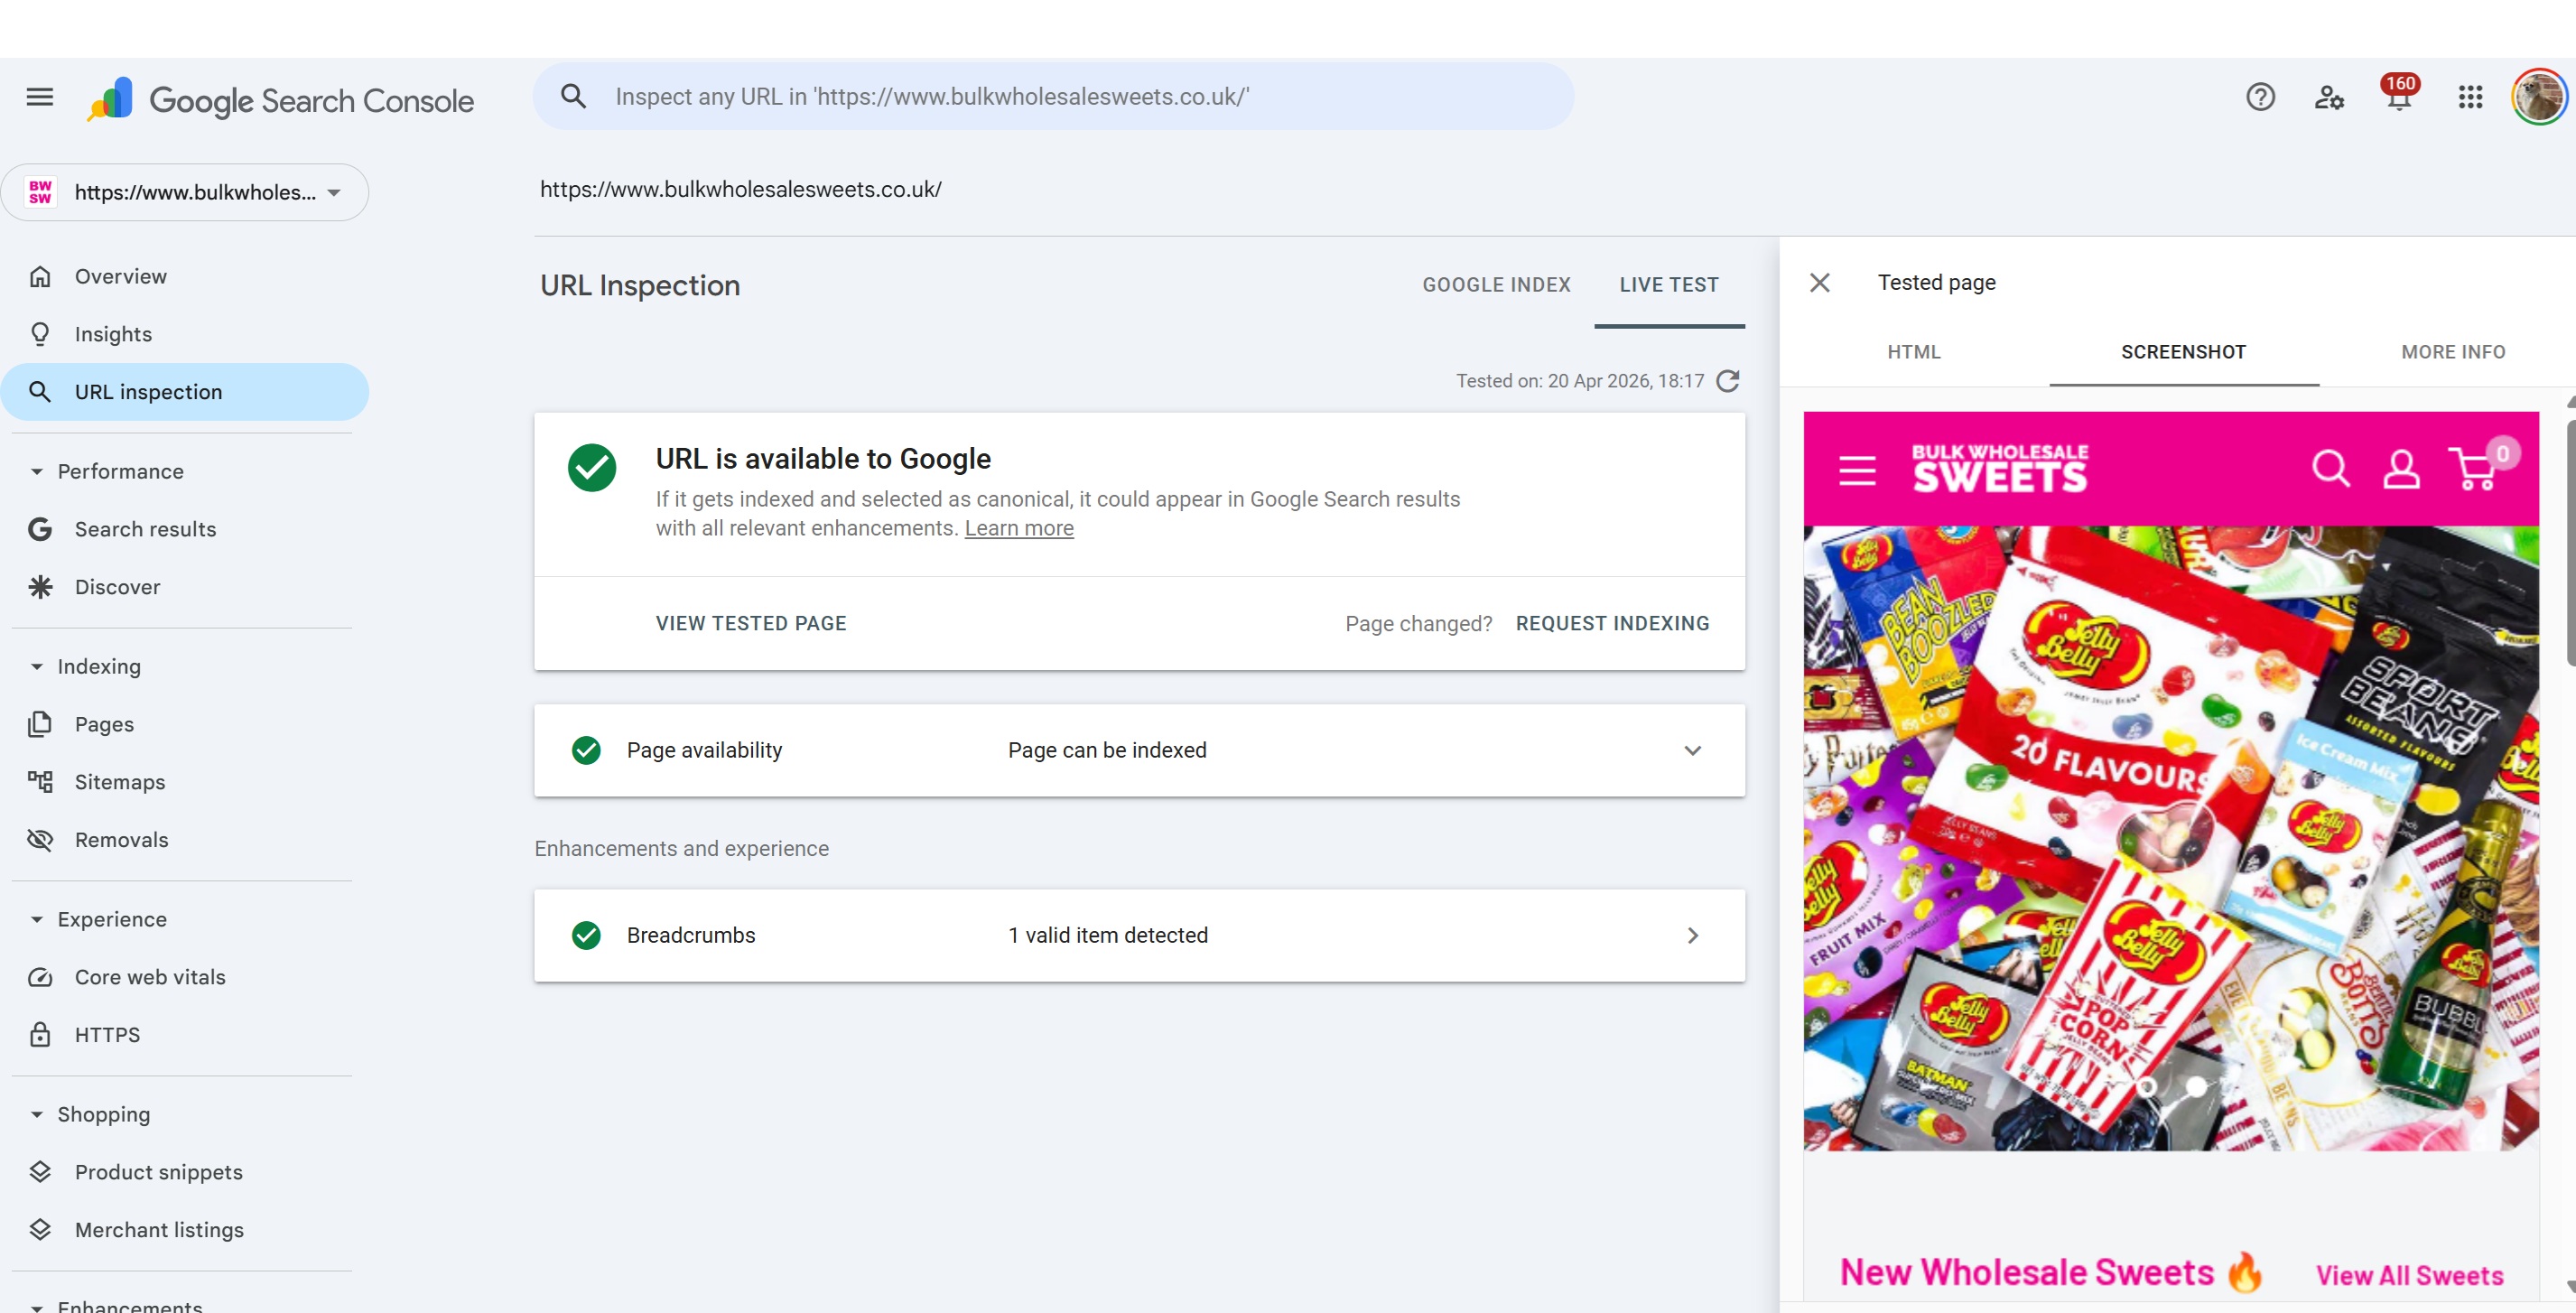
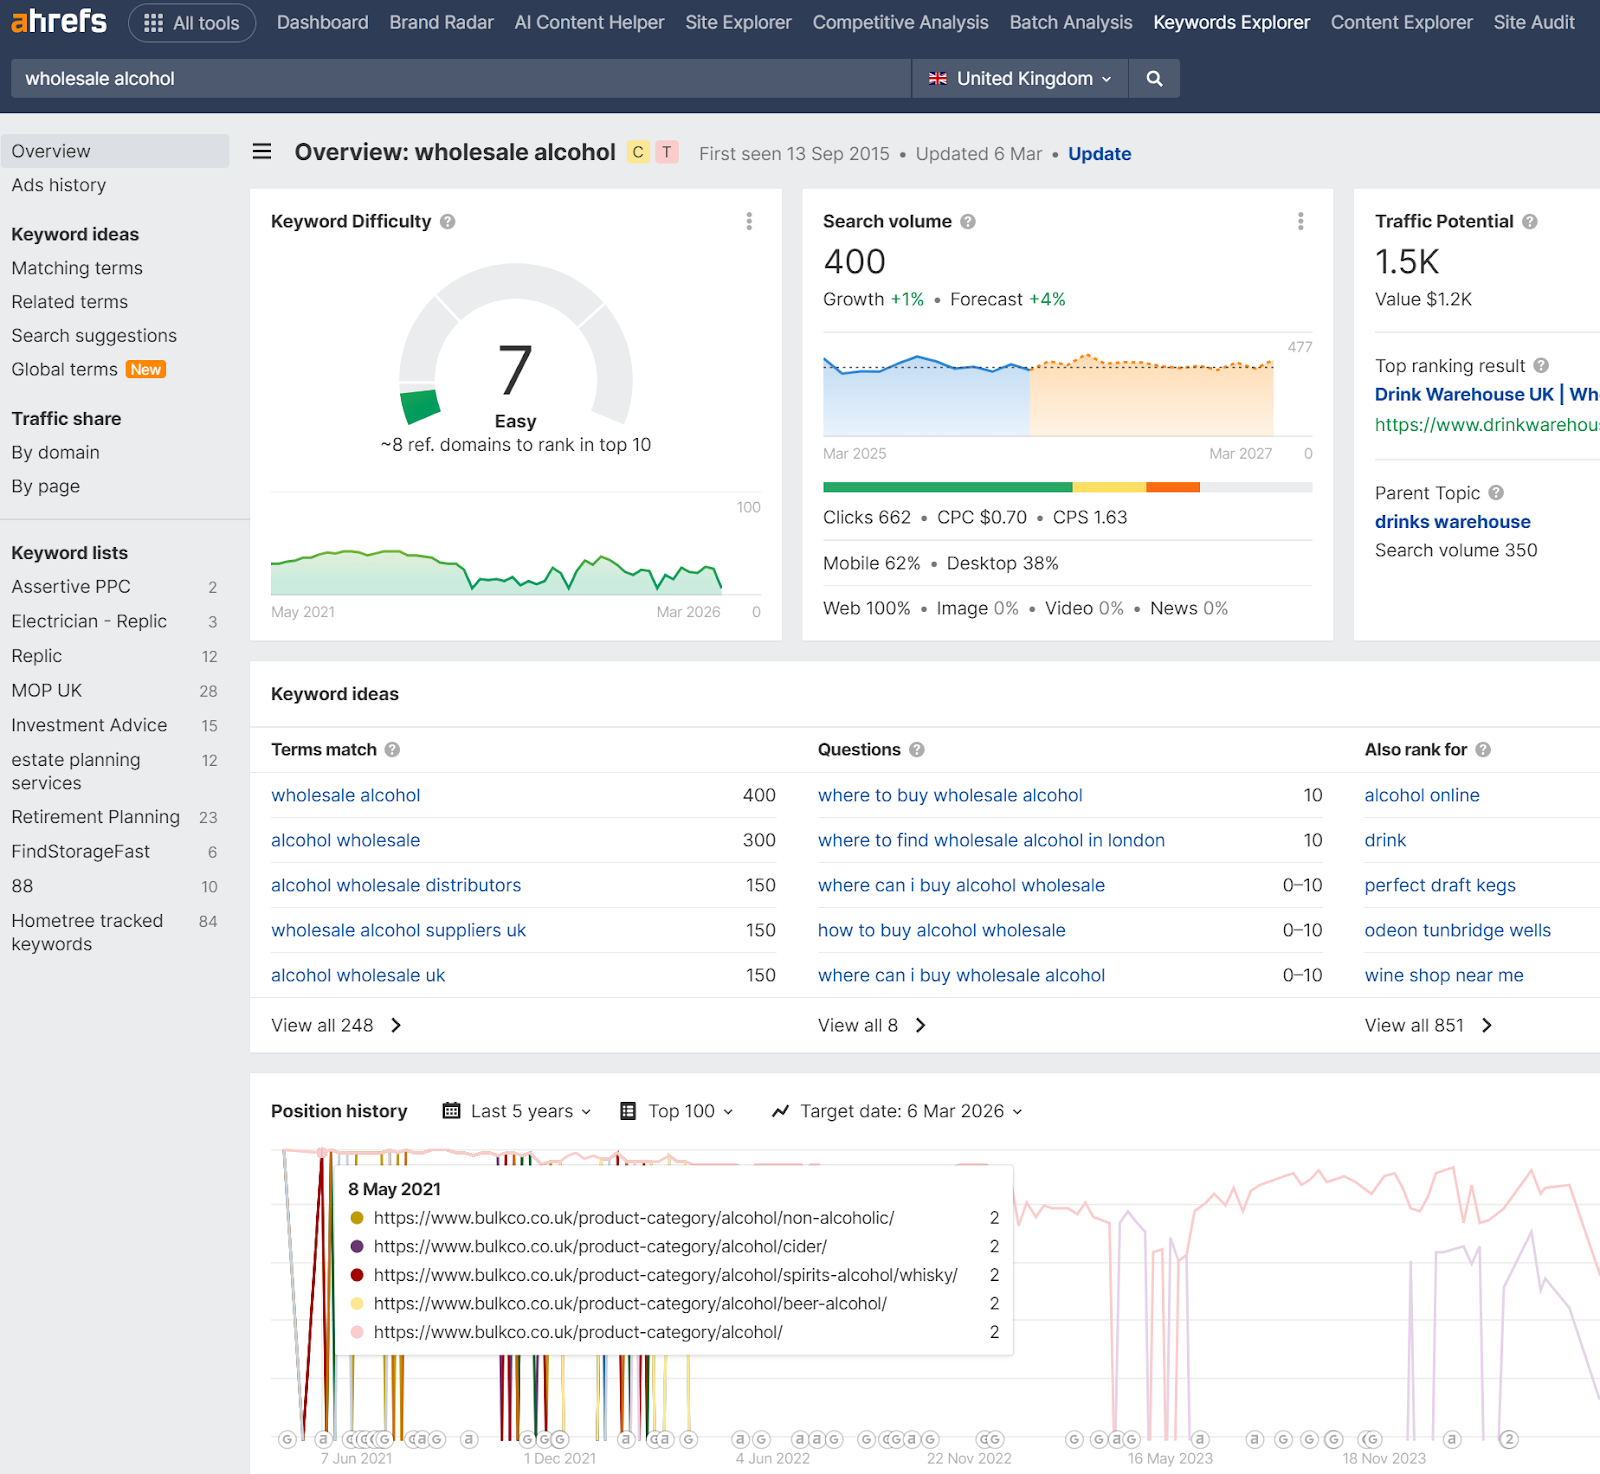
I once ranked a dummy eCommerce website www.bulkco.co.uk from such tests - ranking for 3+ years for thousands of keywords with a weak domain.
I knew something was up, and, thanks to a leak and subsequent DOJ trials, we now know Google does use behaviour, as such, we have Navboost.

So the Content Warehouse API documentation leaked in May 2024, and sitting right there in the schema referenced 84 times across six dedicated models was NavBoost. A system that tracks good clicks, bad clicks, long clicks, impressions, device types, geographic slicing, IP based fraud scores, and voter tokens representing individual users - it didn’t take long to start piecing things together.
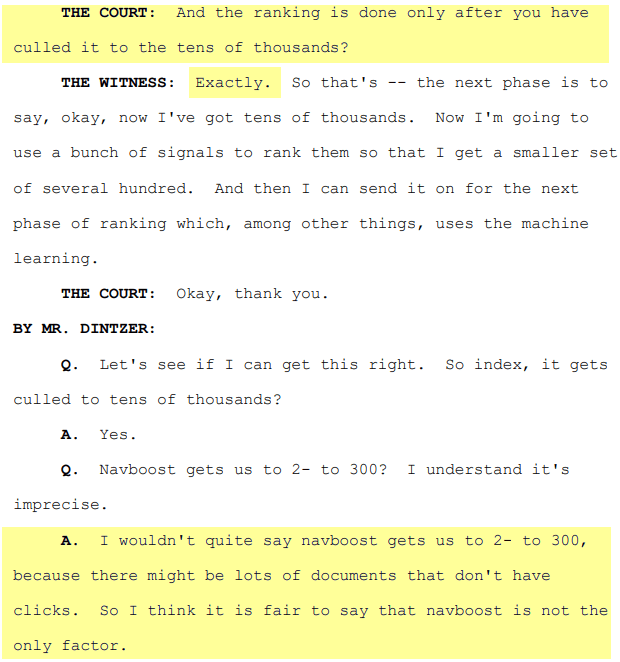
Months earlier, during the US DOJ antitrust trial, Google VP Pandu Nayak had already confirmed under oath that NavBoost was "one of the important signals" Google uses. Internal emails presented as evidence went further. Google VP Alexander Grushetsky wrote in 2019 that NavBoost alone was likely more powerful than the rest of ranking combined on click and precision metrics and that engineers outside the NavBoost team were unhappy about how much influence it had.
Learn more by reading the actual PDF hosted by DOJ here
This article goes through every model in the NavBoost category from the leaked Content Warehouse documentation. Where the schema tells us something concrete, we'll state it plainly. Where the field names and structures suggest a probable interpretation but leave room for ambiguity, we'll say so and offer a reasoned theory. The goal is to give you a genuine technical understanding of what was leaked, not a repackaged summary with the unknowns papered over.
I have to make it clear - as an SEO, it is my job to always provide useful insights and factually correct information where I can - I do not know HOW these models are applied and to what degree, no one does, BUT, we can infer / speculate - it's likely very obvious in some cases how this data is collected / used, but to which degree?
No one knows.
OK so here goes..........

The Six NavBoost Models
The leak exposed six protocol buffer models under the QualityNavboost namespace. Each one rated 10/10 for SEO impact by analysts who catalogued the leak. They are:
QualityNavboostCrapsCrapsClickSignals The core click signal container (10 attributes)
QualityNavboostCrapsCrapsData The master data record tying clicks to URLs, queries, devices, and locations (22 attributes)
QualityNavboostCrapsCrapsDevice Device and browser classification (3 attributes)
QualityNavboostCrapsFeatureCrapsData Locale and feature-level signal slicing (6 attributes)
QualityNavboostCrapsStatsWithWeightsProto Statistical distribution data for pattern-level aggregation (15 attributes)
QualityNavboostGlueVoterTokenBitmapMessage User de-duplication and privacy filtering (2 attributes)
Before we dig into each one, the name deserves a note. "CRAPS" appears to be an internal Google acronym likely standing for something along the lines of Click and Results Prediction System, though this hasn't been officially confirmed. Whether it's also a sly nod to the dice game (given the probabilistic nature of predicting user satisfaction from click patterns) or to the years of Google publicly calling click-based theories "made up crap" is left as an exercise for the reader.
And no, let's not mistake Craps for any toilet humour or casino game:

Model 1: CrapsClickSignals The Core Click Taxonomy
This is the foundational model. It contains ten float attributes, and its description in the leaked documentation is brief but telling: "Click / impression signals for craps."
Every float here represents a count or a ratio. These aren't binary flags they're continuous values, which means Google is almost certainly working with weighted, normalised numbers rather than raw integers - but again, it's speculative and NOT confirmed (just wanted to make that clear).
The Attributes
clicks The total click count for a given document against a given query (or query cluster). This is the baseline. Everything else in this model is a refinement of, or a subset of, this number. Fundamentally a click has to occur for determination to be made.
So, clearly, there are going to be clicks that either result in a satisfied or unsatisfied user. Let's use pain harold (who doesn't love him for a meme).

goodClicks Clicks that Google considers to represent a successful user outcome. The leak doesn't define the precise criteria, but based on the antitrust testimony and years of pogo-stick analysis within the SEO community, a good click almost certainly involves the user clicking a result, staying on that page for a meaningful period, and not returning to the SERP to click something else. In other words: the click resolved the query.
Hide the pain harold after visiting a website that mislead him or didn't provide a good user experience:

badClicks The inverse. Clicks where the user returned to the search results quickly. This is the pogo-stick signal that Google spent years claiming didn't exist as a ranking factor. The leaked schema confirms it's a named, stored, float-valued attribute sitting inside a 10/10 SEO impact model.
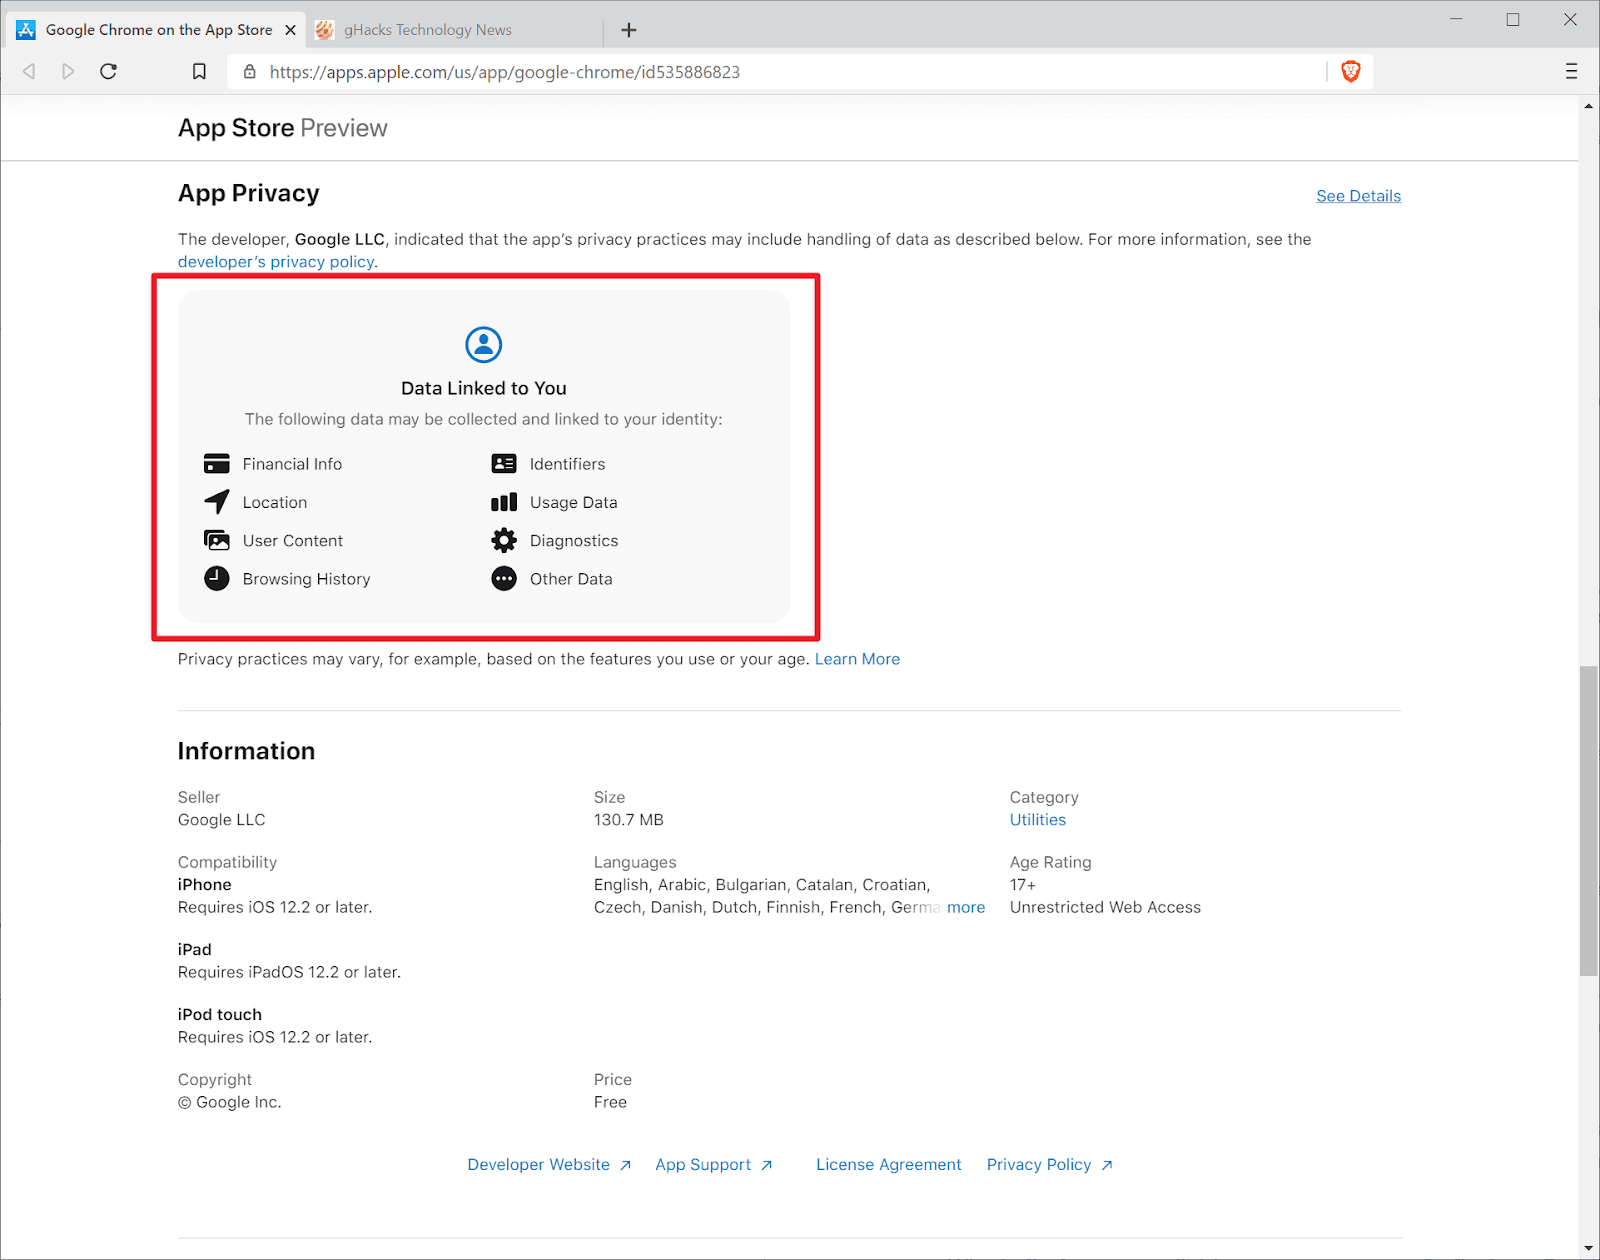
If you are wondering what pogo is - it relates to "pogo sticking" where you go from one state to another quickly - i.e. you visit a website and quickly leave. FYI Google doesn't need analytics present to know how long engagement lasted - remember that little browser called Chrome? Yeah, well, it's a trojan horse for behavioural data too!
Take a look at this article on the dark side of google chrome how your browser betrays you
lastLongestClicks This is where it gets interesting. The documentation on the parent CrapsData model describes this as "the number of clicks that were last and longest in related user queries." This isn't just about how long someone stayed on your page in isolation. It's about whether your result was the one the user settled on the final click in their search session, and the one they spent the most time on. If a user clicks Result A, bounces, clicks Result B, bounces, then clicks Result C and stays for four minutes before closing the tab, Result C gets the lastLongestClick credit.
This is why I believe that Google mixes up SERPS, especially where intent in the search query becomes more "vague" - i.e. if you were to search for "car" you aren't specifying what you want? do you want to know what a car is? do you want to buy one? do you want to know what car brands exist?
VARIED SERPS gives Google a wider pool for evaluation - SERVE different intents in a SERP, accrue the click data over time, the aggregated behavior over time helps google to better understand what "the majority wants".
I believe this is why Google would often MIX different results up, this is also why, for many years we would find sites that just didn;t fit the profile of a site that deserves to rank that ranked anyway!
I mean for years, vatcalculator.co.uk which was an EMD ranked number 1 for vat calculator, in fact, it ranked from 2009 and still ranks #1 to this day. It was an unoptimised EMD that was non HTTPS, non mobile friendly, it was the very definition of a site that was just built, deployed and left!
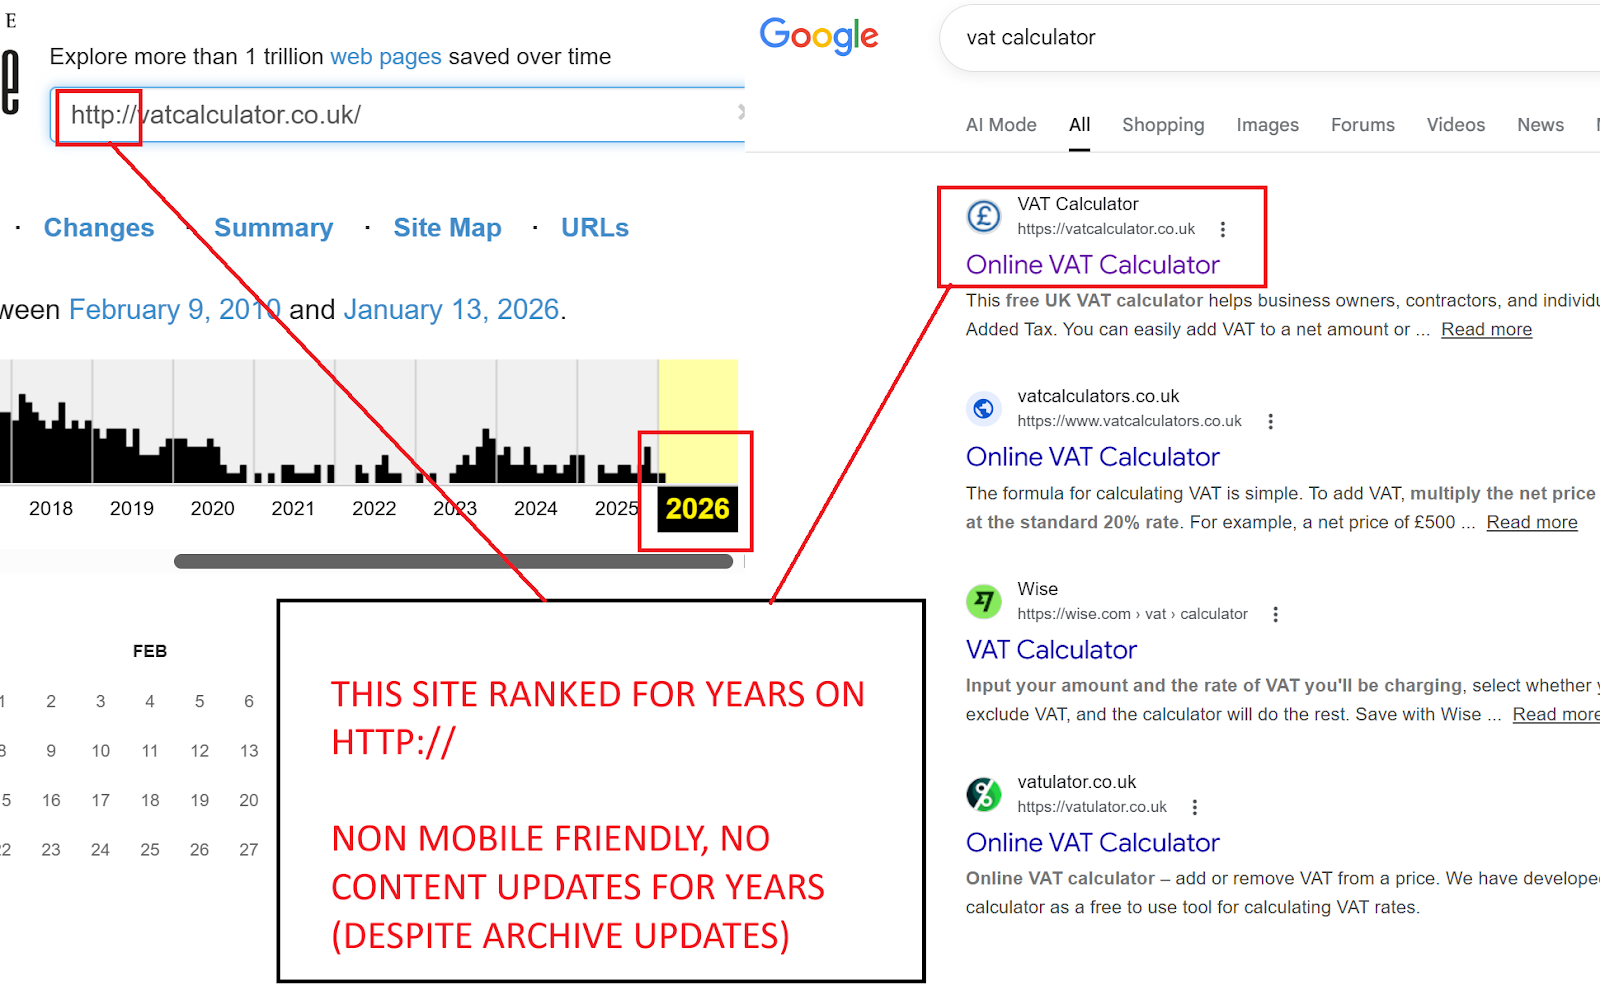
Why did it hold rank for SOOOOOO many years?
Because it did one thing and one thing well - it gave the users EXACTLY what they wanted, a no nonsense easy to use VAT calculator:
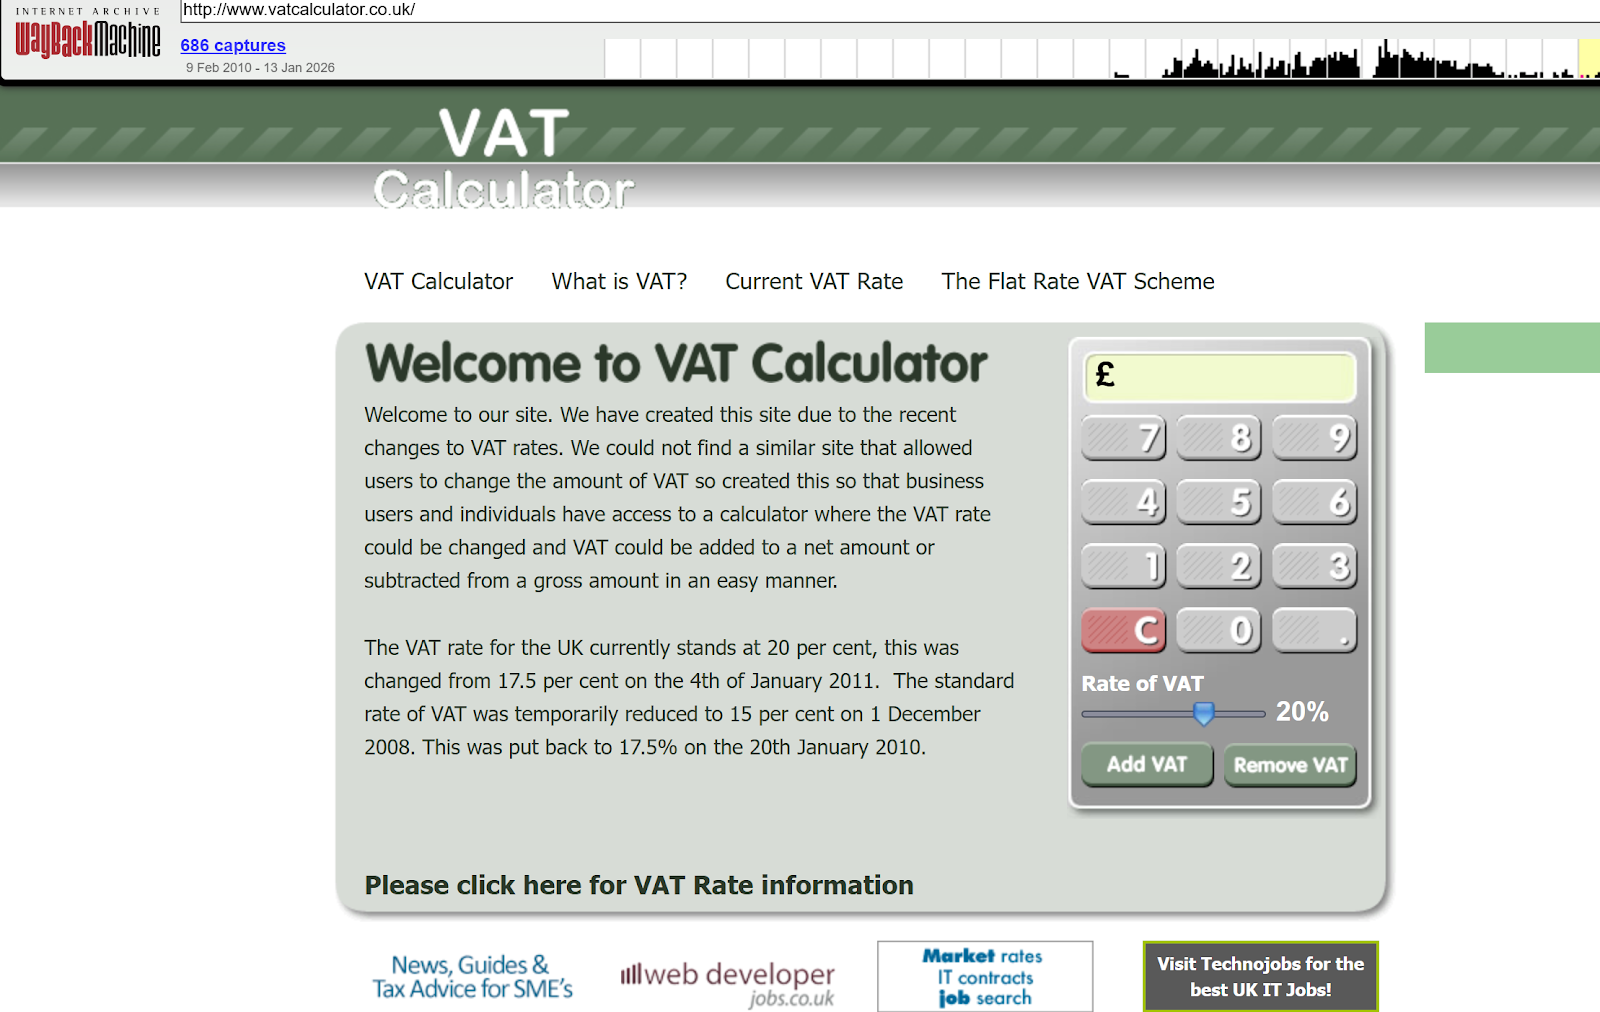
It ranked because users USED the calculator and ended the session.
Good clicks.
Now, let's continue looking at other click types:
Speculative interpretation: This is likely the single most valuable signal in the entire model. It captures both satisfaction (long dwell) and finality (last click). A page that consistently earns lastLongestClicks across many sessions is one that demonstrably resolves the query. If Google were weighting these signals, this one probably carries the heaviest load.
impressions The number of times a document was shown in search results for a query. This is the denominator for any CTR-like calculation. Without impressions, click counts are meaningless a page with 10 clicks from 10 impressions is performing very differently from one with 10 clicks from 10,000 impressions.
This itself has another layer behind it - I'll save this for another article, but impressions and CTR are key here, Google itself uses CTR data, but as we know, AI overviews have significantly eaten into click through rates even for sites that consistently ranked - displacement with AIOs has skewed CTR significantly.
absoluteImpressions The documentation is specific about this one: "Thus far this field is only used for host level unsquashed impressions." Two things matter here. First, this operates at the host level, not the URL level. Google is measuring how often your entire domain appears in results, not just a single page. Second, it's explicitly unsquashed more on what that means below.
unicornClicks The documentation says: "The subset of clicks that are associated with an event from a Unicorn user." This is one of the more cryptic attributes in the leak. There's no further definition of what constitutes a "Unicorn user" in the publicly leaked documentation - so again, I'm not going to speculate here.
Speculative interpretation: In my personal view, the most likely explanation is that Unicorn refers to authenticated, logged-in Google users people whose identity and browsing history Google can verify with high confidence. Their clicks would carry more weight because Google can validate that these are real, distinct humans with established browsing patterns, not bots, click farms, or VPN-masked manipulation attempts. An alternative theory is that Unicorn users are Chrome users specifically, given Chrome's deep integration with Google's data collection infrastructure. Either way, the implication is clear: not all clicks are equal, and clicks from users Google can identify with confidence appear to be tracked and valued separately.
No doubt there are lots of mechanics under Chrome along with user-agent spoofing and click farming / click manipulation tools that are designed to influence rank by mimicing a real-user session, however in most cases, click manipulation tends to be from non-signed in browsers.
unsquashedClicks, unsquashedImpressions, unsquashedLastLongestClicks The documentation notes that these fields are being migrated to a new format where the data will be stored in separate squashed and unsquashed instances of CrapsClickSignals. The existence of both versions tells us something critical about how Google processes this data.
Squashed vs Unsquashed: How Google Normalises Click Data
This is one of the most important architectural details in the entire leak.
"Squashing" is a normalisation function. A Google patent on scoring local search results (US8046371B2) describes squashing as a function that prevents one large signal from dominating the others. In practical terms, a squashing function compresses the range of values typically using a logarithmic curve, a sigmoid, or a hard ceiling so that the difference between 10 clicks and 100 clicks is significant, but the difference between 10,000 clicks and 100,000 clicks is dampened.
Why this matters: Without squashing, high-traffic pages would have an insurmountable advantage. A BBC article with 50,000 clicks would drown out a specialist blog with 500 clicks, even if the specialist blog had a far higher ratio of good clicks to bad clicks. Squashing levels the field by compressing the absolute numbers and letting the ratios speak.
The unsquashed values, then, are the raw numbers before this normalisation is applied. Google keeps both versions because they serve different purposes:
Squashed data feeds into the ranking algorithm, where proportional quality matters more than absolute volume
Unsquashed data likely feeds into anti-spam detection, where absolute volume and anomalous spikes are precisely what you're looking for
Practical scenario: Imagine a local solicitor's website in Bedford that normally gets 30 impressions and 8 clicks per month for "family solicitor Bedford." One week, it suddenly receives 400 clicks from 500 impressions. The squashed data dampens this anomaly so it doesn't catapult the site up the rankings. The unsquashed data preserves the raw spike so that a spam detection system (potentially the IP prior or voter token systems described elsewhere in the leak) can flag it for investigation.

Model 2: CrapsData The Master Record
If CrapsClickSignals is the vocabulary, CrapsData is the sentence. This 22-attribute model ties all the click signals together with context the query, the URL, the country, the device, the language, and several layers of aggregation and slicing.
Query and URL Binding
query (string) The actual search query this data relates to. NavBoost doesn't just track "this page got X clicks." It tracks "this page got X clicks for this specific query." This is query-document pair data, which means NavBoost can differentiate between a page that performs well for one query and poorly for another.
url (string) The specific URL being tracked.
patternLevel (integer) This reveals that Google doesn't just track individual URLs. It aggregates click data at multiple levels of URL abstraction:
Level 0: The exact URL (e.g., https://example.com/services/seo-audit)
Level 1: The host pattern (e.g., p://example.com)
Level 2: The domain pattern (e.g., p://example.com stripped to root)
The documentation gives a concrete example: for http://abc.def.ghi/xyz.html, level 0 is the full URL, level 1 is p://abc.def.ghi, and level 2 is p://def.ghi.
Why this matters: This confirms that NavBoost operates at subdomain, root domain, and URL levels simultaneously. Your individual page might have weak click data, but if your domain as a whole consistently earns good clicks across hundreds of URLs, that pattern-level signal likely provides a lift. Conversely, a domain with consistently high badClicks ratios probably gets a pattern-level penalty even on new pages that haven't yet accumulated their own click history.
Speculative scenario: So, my thoughts are here that a new blog post on a well-established site with strong domain-level NavBoost patterns might inherit a baseline "trust" from the parent domain's click history, giving it a warmer start in the rankings than an identical post on a new domain with no click history. This would explain why established sites often rank new content faster it's not just domain authority in the link sense, it's accumulated click quality at the pattern level.
Geographic and Language Slicing
country (string) Two-letter uppercase country code. Examples given: "US", "FR", "BR".
language (string) Language code. Examples: "en", "fr", "pt-BR".
This means Google stores and evaluates click signals per-country and per-language. A page that earns excellent click metrics in Germany might have terrible metrics in France. NavBoost can distinguish between the two and adjust rankings accordingly.
Practical implication: If you run a multilingual site, your English pages and your French pages are building separate NavBoost profiles. A poorly translated French version of a well-performing English page isn't going to ride the coattails of the English click data. Each language variant earns (or loses) its own click signals.
sliceTag (string) A flexible field described as allowing the CRAPS pipeline to "slice up signals by various attributes such as device type, country, locale etc." This is essentially a catch-all segmentation key. The slice tag can be an arbitrary string, and signals are aggregated separately for each tag alongside the default empty tag.
Speculative interpretation: In my view this suggests Google can create ad-hoc signal segments beyond the standard country/language/device splits. During major events (elections, pandemics, natural disasters), they could potentially create temporary slice tags that adjust how click signals are weighted for specific query categories. This is consistent with the antitrust evidence showing Google deployed whitelists during COVID-19 and elections.
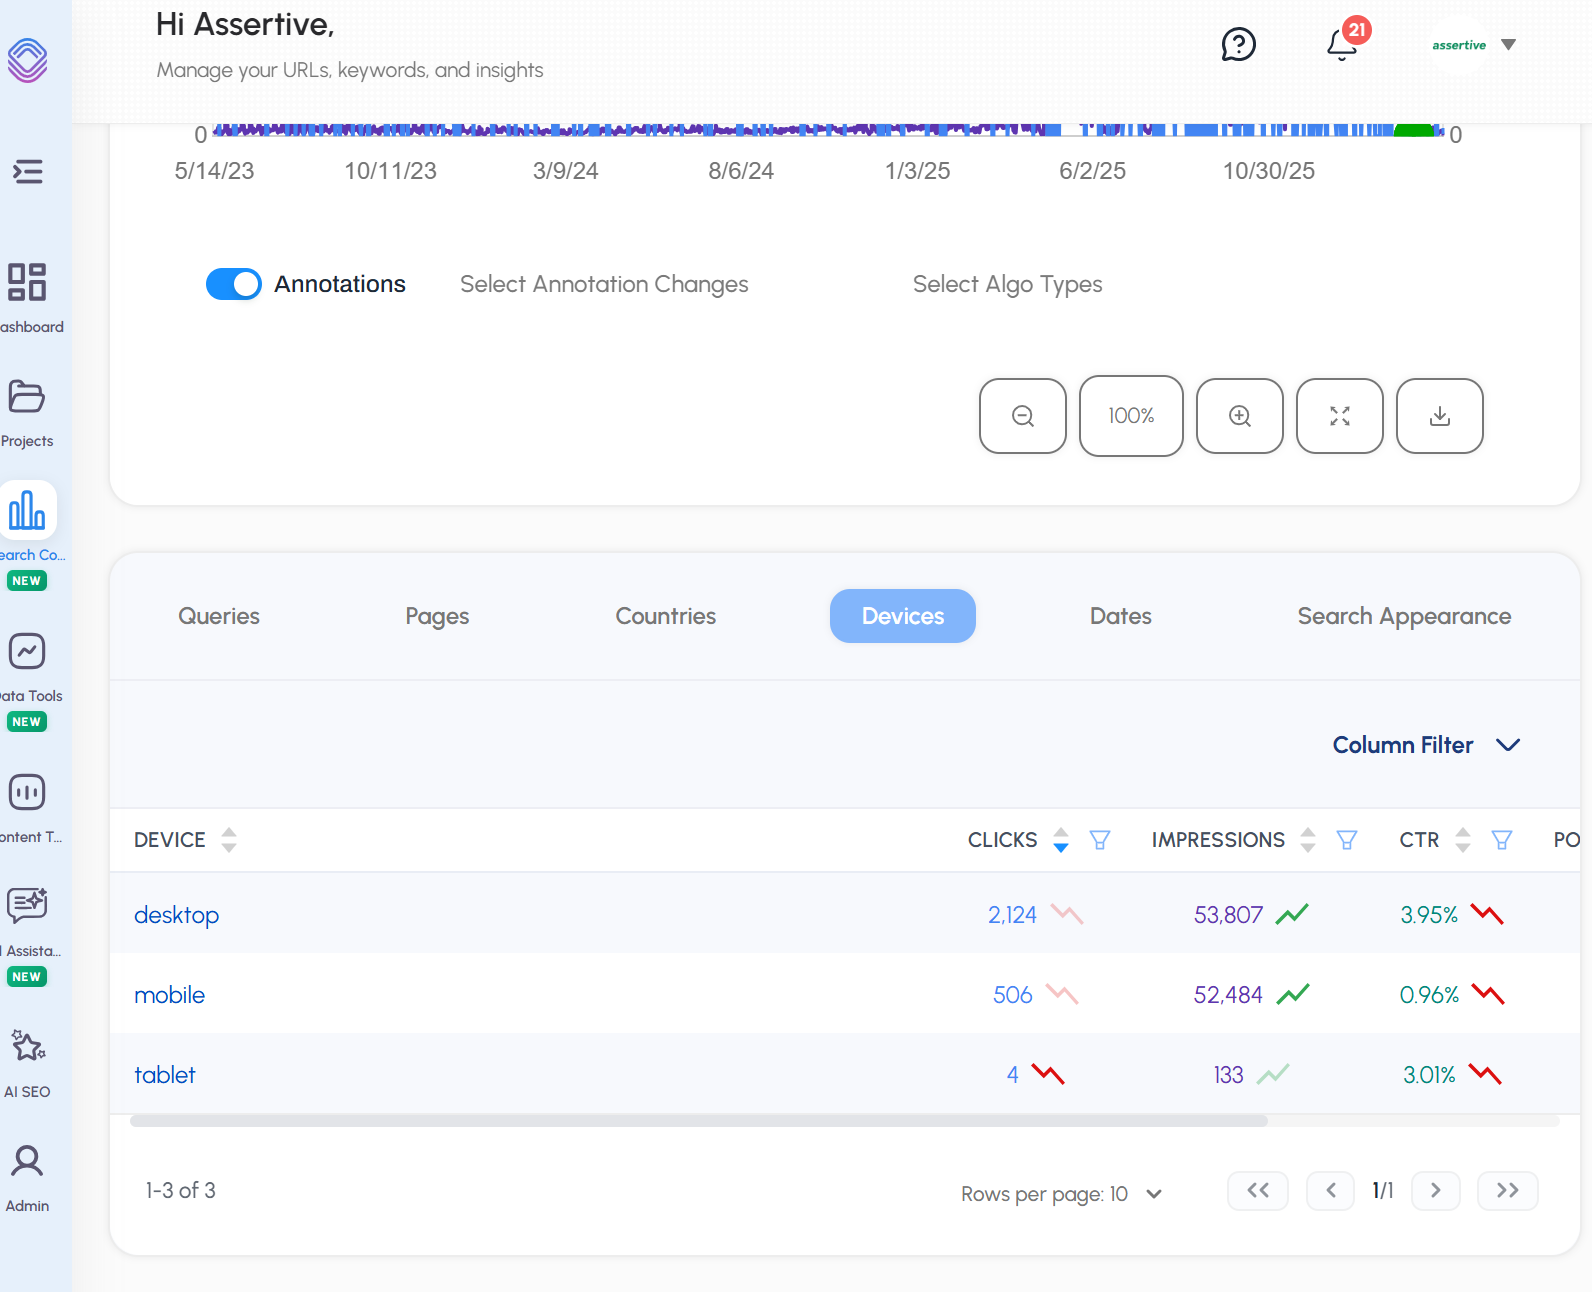
Device Segmentation
device Links to the CrapsDevice model (covered below).
mobileSignals A dedicated CrapsClickSignals instance aggregated specifically from "tier 1/2 mobile interfaces in QSessions." Google maintains entirely separate click signal profiles for mobile users.
mobileData Marked as legacy ("DO NOT USE"), replaced by mobileSignals. The fact that Google has deprecated and replaced this field tells us the mobile signal architecture has been actively reworked, likely to support more granular mobile device classification.
Squashed and Unsquashed Instances
squashed A full CrapsClickSignals instance containing the normalised click data. The documentation notes this will eventually replace the top-level goodClicks/badClicks/impressions fields.
unsquashed The raw, unnormalised instance. Described as being prepared for "the retuning rollout," suggesting Google was actively recalibrating how these two data streams interact at the time the documentation was generated.
unsquashedMobileSignals Raw mobile click data before normalisation.
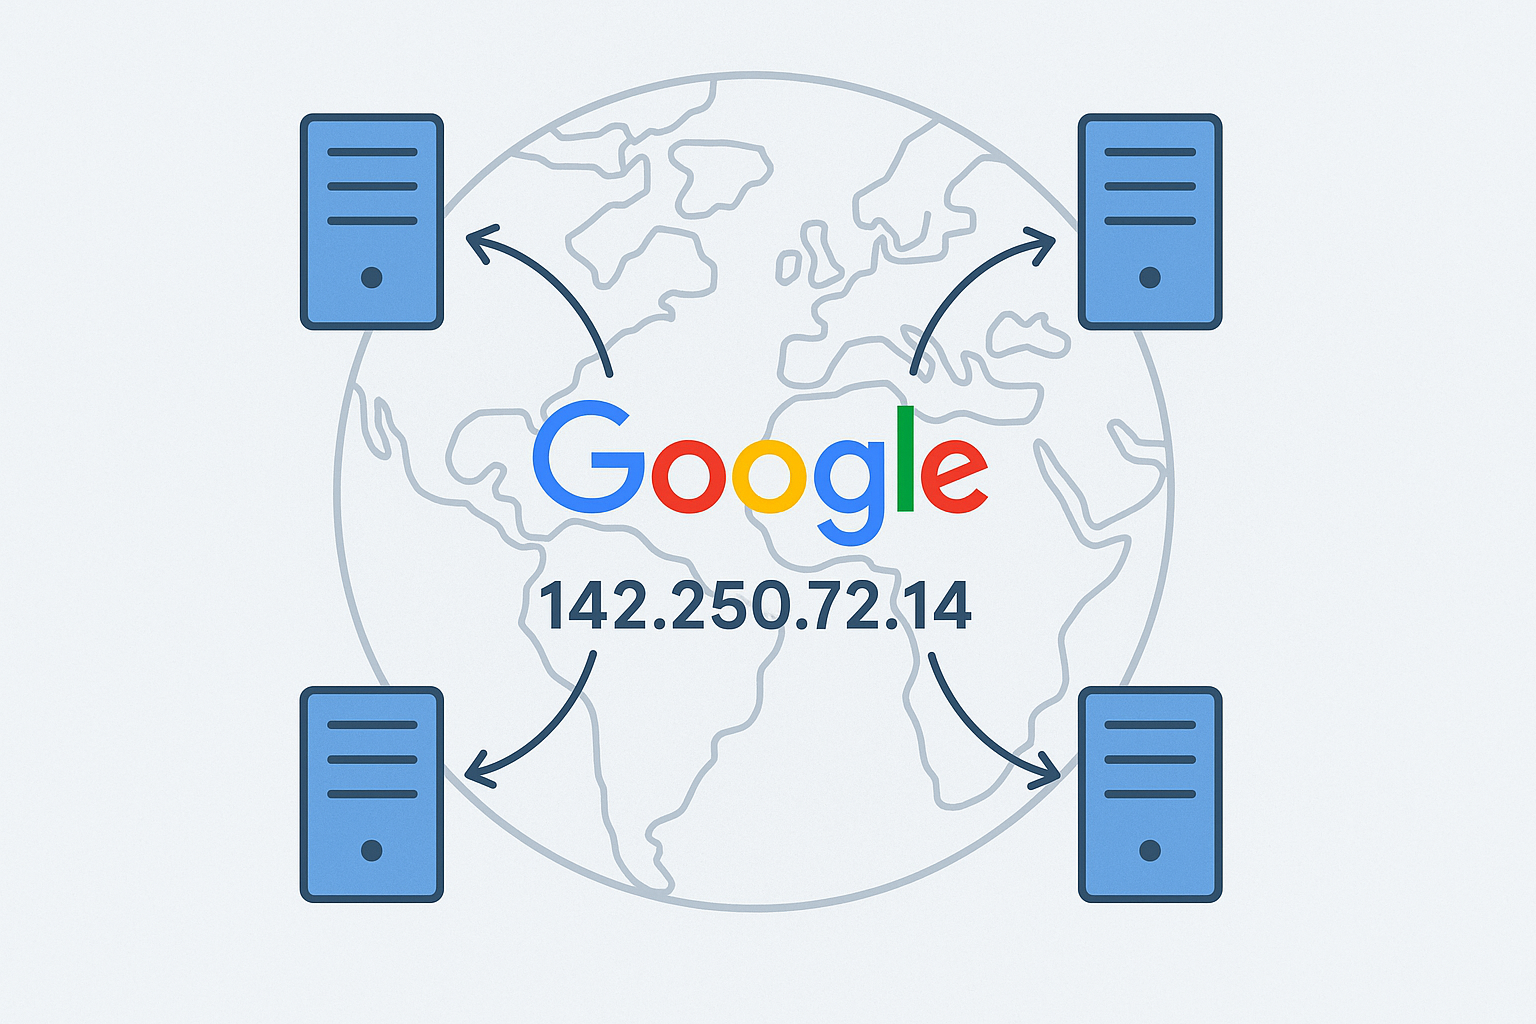
Anti-Spam and IP Analysis
packedIpAddress (string) A packed network byte order string used by a system called CrapsIpPrior. Only populated when Google looked up the IP prior bad fraction at retrieval time.
unscaledIpPriorBadFraction (float) Used to assign a prior based on IP address. The documentation explicitly references two internal files: quality/navboost/craps/craps-ip-prior.h and craps-penalty.cc. The value stored here is pre-transformation before a linear scaling, offset, min/max operation is applied.
What this tells us: Google maintains an IP-level reputation score. Every IP address has a "bad fraction" essentially, a measure of how often clicks originating from that IP have historically been classified as spam, bot traffic, or manipulation attempts. When evaluating click signals from a particular IP, this prior adjusts the weight of those clicks.
This ALSO may tie in with why previous studies have shown that SHARED HOSTING can be WORSE for SEO where an IP block could be associated with bad actors / mass spam etc.
In fact, a few years ago, a long-running competitor (and very good friend of mine Shai Aharony) and one of his SEO's "Oliver Sissons" ran an experiment on a "long term shared hosting experiment" which also seemed to suggest that this is true:
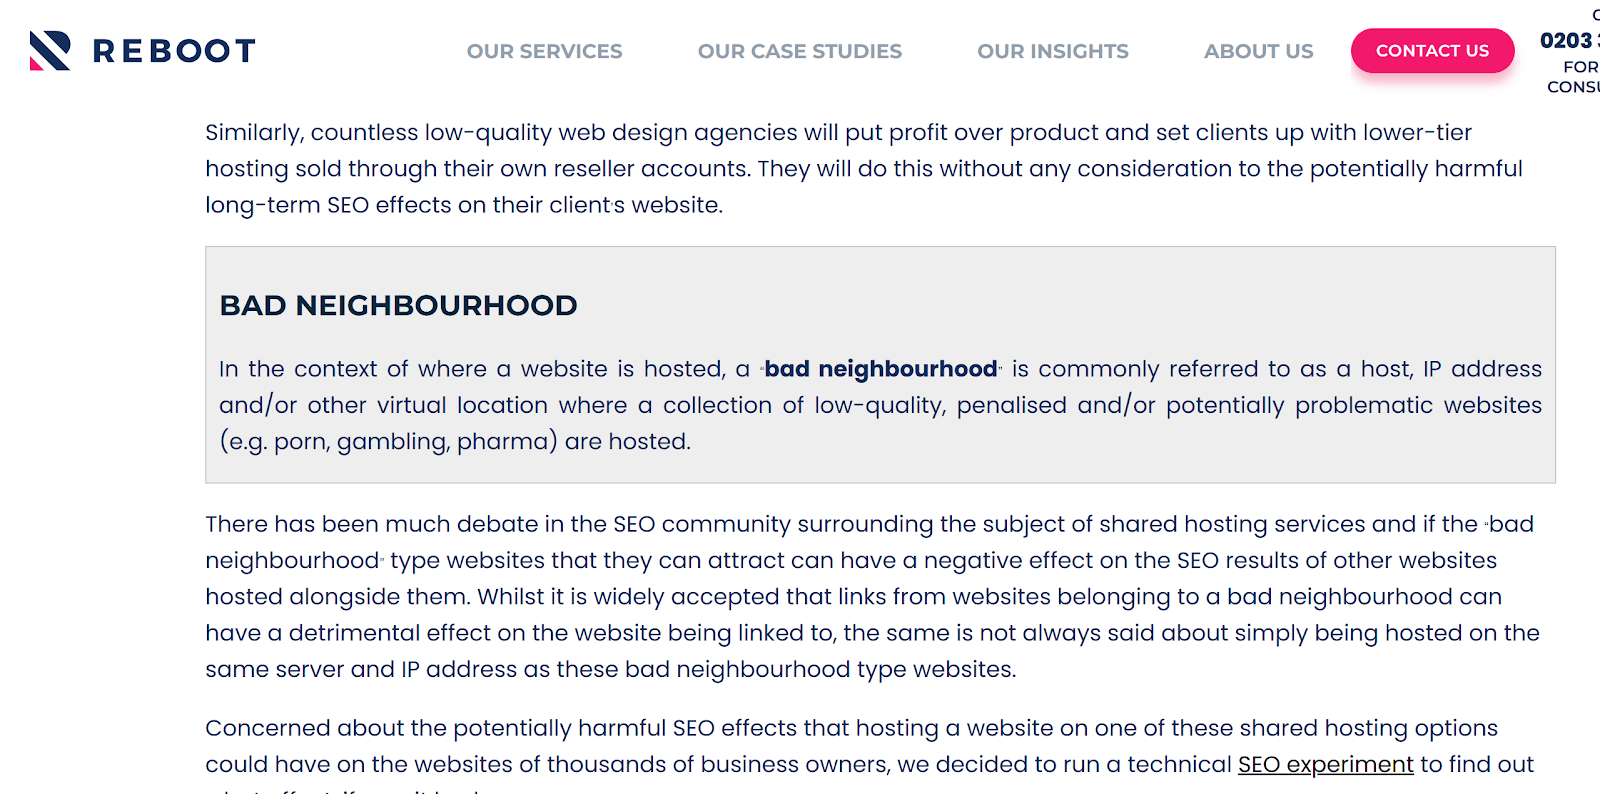
This may explain:
Why some sites can see ranking gains after transitioning away from shared hosting
Some domains appear to be "toxic" when in reality it's the IP block they are mapped to that's been known for spam/abuse and subsequently anything served on it may suffer.
Practical scenario: A CTR manipulation service running clicks through a VPN endpoint in London might initially see results. But as clicks from that IP accumulate and none of them exhibit natural browsing patterns (varied dwell times, natural follow-up queries, diverse URLs clicked), the bad fraction climbs. Eventually, clicks from that IP range are either heavily discounted or ignored entirely. The "scaling / offset / min / max" transformation mentioned in the documentation suggests there's a threshold system below a certain bad fraction, clicks are accepted normally; above it, they're progressively devalued; above a hard ceiling, they may be discarded.
I've tested this over the years using tools such as CTR Booster + Trusted Proxies which tunneled requests via residential proxy IP's with spoofed user-agents.
CTR Booster worked, however, it's very probable that these sessions have become more obvious as Google's detection capabilities have improved over time.
Voter Tokens and Privacy Filtering
voterTokenCount (integer) "The number of distinct voter tokens (a lower bound on the number of distinct users that contributed to the entry, used for privacy-related filtering)."
This is crucial. Google isn't just counting clicks it's counting unique humans. The voter token system provides a lower bound on the number of distinct users whose clicks contributed to a URL's NavBoost profile. If a URL has 500 clicks but only 3 voter tokens, that's a massive red flag. If it has 500 clicks from 480 voter tokens, that's a healthy, organic signal.
The "lower bound" language is deliberate voter tokens aren't unique per user (as confirmed in the FeatureCrapsData model), so the count is a conservative estimate. Google would rather undercount distinct users than overcount them, which means the privacy filtering threshold is calibrated to protect against false positives.
Speculative interpretation: IMO there's almost certainly a minimum voter token threshold below which NavBoost data for a URL/query pair is suppressed entirely. If only two or three users have contributed clicks, the sample is too small to be meaningful and too easy to manipulate. This would explain why new pages with very low traffic don't see NavBoost-driven ranking changes until they've accumulated a critical mass of distinct users.
Pattern-Level Statistics
patternSccStats Links to the StatsWithWeightsProto model (covered below). For pattern-level data, this contains statistics about the strongly connected components of individual URLs contributing to the pattern. In other words, when Google aggregates click data up to the domain level, it doesn't just sum the numbers it analyses the distribution. How consistent is the click quality across individual URLs? Is the domain's strong NavBoost profile driven by one viral page, or is it consistent across hundreds of pages?

Model 3: CrapsDevice What Google Knows About Your Visitor's Device
Three attributes. Simple, but revealing.
os (string) The operating system. This confirms Google tracks and stores the OS of every user whose clicks feed into NavBoost.
uxInterface (integer) An enum from GWSLogEntryProto indicating device type:
1 = Desktop
2 = Mobile
3 = Tablet
The reference to "gwslog(608)" tells us this data comes directly from the Google Web Server log the same infrastructure that serves every Google search request.
uxTier (integer) Browser capability tier:
1 = Modern browsers
2 = Everything in between
3 = Very old browsers
Why this matters beyond basic segmentation: If Google is slicing click signals by browser tier, it means the system can potentially weight clicks from modern browsers differently than clicks from old browsers. A click from Chrome 120 on a flagship Android device is probably treated as a higher-confidence signal than a click from an outdated browser that might be associated with bot traffic or outdated crawling infrastructure.
Speculative scenario: This tiering system could also serve as an anti-manipulation vector. Automated click tools often use headless browsers or older user agents that might fall into tier 2 or tier 3. If Google observes that a disproportionate share of a URL's clicks are coming from low-tier browsers compared to the norm for that query, it's a potential spam signal.
Model 4: FeatureCrapsData Granular Locale Slicing
This model enables extremely fine-grained geographic and device segmentation of click signals.
country (string) Same format as CrapsData, lowercase (e.g., "us"). The documentation notes: "If not present, it's an aggregation for all countries."
language (string) e.g., "en". Again, absence means aggregate across all languages.
device (string) Simplified device indicator: "m" for mobile, "d" for desktop. If not present, aggregated across all devices.
locationId (integer) "Location id for metro and city. If not present, it's an aggregation for all locations within current country."
This is the field that confirms NavBoost operates at the metro/city level. Google doesn't just know you're searching from the UK it knows you're searching from Birmingham or Edinburgh, and it can slice click signals accordingly.
Practical implication: If you're an SEO consultant working on local SEO for a business in Manchester, your client's click signals from Manchester users are being tracked separately from their click signals from London users. A restaurant that earns excellent clicks from users in its home city but poor clicks from users elsewhere may rank well locally and poorly nationally and NavBoost is the mechanism enabling that differential.
signals A full CrapsClickSignals instance containing the click data for this specific locale slice.
voterTokenBitmap Links to the GlueVoterTokenBitmapMessage model. This provides per-locale voter token tracking, meaning Google can assess the diversity of users contributing to click signals at the metro level. If a London-based business suddenly gets a burst of "good clicks" from users in a single metro area, but the voter token bitmap shows they all came from a handful of tokens, the signal gets filtered.
Model 5: StatsWithWeightsProto Distribution Analysis
This is a statistician's model. Fifteen attributes, thirteen of which are floats, all describing the statistical distribution of click data across the URLs that contribute to a pattern-level aggregation.
n (integer) Sample size. The number of individual data points (likely individual URLs) contributing to the pattern.
weightedN (float) Weighted sample size. Not all URLs contribute equally some are weighted more heavily, possibly by traffic volume or voter token count.
mean, median Central tendency of the click metric being measured.
stddev, variance, varOfMean, stdError Dispersion metrics. How spread out are the click signals across URLs within this pattern?
hi, lo The extremes of the distribution.
pc10, pc25, pc75, pc90 Percentile breakpoints. This gives Google a complete picture of the distribution shape.
kind (integer) An enum indicating what type of statistic this is. The leak doesn't enumerate the possible values, but it likely distinguishes between different metrics (good click ratios, bad click ratios, lastLongestClick ratios, etc.).
Why this level of statistical detail matters: Google isn't just looking at whether your domain has good aggregate click signals. It's looking at the distribution of click quality across your pages. A domain where the median good click ratio is 0.6 with a tight standard deviation is a consistently strong domain. A domain where the mean is 0.6 but the standard deviation is massive meaning some pages are excellent and others are terrible presents a different quality profile.
Speculative interpretation: From my point of view this is very likely the mechanism behind site-wide quality assessments. If Google's internal systems (like Google's HCU (helpful content update or system) apply site-level modifiers, the statistical distribution of NavBoost signals across a domain's URL pattern is probably a key input. It's not enough to have a few great pages if your pc10 (the 10th percentile) shows that your worst pages are generating overwhelmingly bad clicks, that drags the pattern-level assessment down.
Practical scenario: A content farm publishes 1,000 articles. Fifty of them accidentally perform well and earn good clicks. The other 950 generate pogo-sticking and bad clicks. The mean might look middling, but the median is terrible, the pc10 is near zero, and the standard deviation is enormous. Google's pattern-level stats would capture this profile precisely and likely inform a site-wide demotion.
Model 6: GlueVoterTokenBitmapMessage The Anti-Manipulation Layer
Two string attributes, but the model description reveals the underlying mechanism.
The documentation states this model is "used for aggregating query unique voter_token during merging" and employs "4 uint64(s) as a 256-bit bitmap to aggregate distinct voter_tokens in Glue model pipeline."
voterToken (string) A single voter token. As an optimisation, if only one user contributed, the token is stored as a single uint64 rather than a full bitmap.
subRange (string list) The bitmap components when multiple tokens are present.
How this probably works: Each user who contributes a click gets assigned a voter token (which is not unique per user it's a hashed, privacy-preserving identifier that serves as a lower bound on distinct users). These tokens are aggregated into a 256-bit bitmap. The bitmap allows Google to efficiently merge token sets across queries and time periods during the Glue pipeline processing.
The "Glue" reference is significant. As confirmed during the antitrust trial, Glue is essentially NavBoost expanded to cover all SERP features not just the ten blue links but also Knowledge Panels, video carousels, image packs, People Also Ask boxes, and AI Overviews. The voter token bitmap ensures that the user diversity check applies across all these feature types.
Why 256 bits? A 256-bit bitmap can represent up to 256 distinct voter token hash buckets. This means the system is designed for efficient approximate counting of distinct users, not exact counting. For NavBoost's purposes, knowing that "roughly 180 distinct users" contributed is sufficient the exact count doesn't matter as much as the confidence that the click data comes from a diverse, organic user base.
Where Does Google Get This Data?
The leaked models reference several data sources either explicitly or by strong implication:
Google Web Server (GWS) Logs The CrapsDevice model explicitly references gwslog entries (608 and 609). Every search query, every click on a result, every return to the SERP is logged by Google's web server infrastructure. This is the primary data source.
QSessions Referenced in the mobileSignals description and the CrapsDevice description. QSessions appear to be Google's internal session model a structured record of everything a user does during a search session, from the initial query through all clicks, reformulations, and eventual session termination.
Chrome Data Not explicitly named in these six models, but the antitrust evidence and the broader leak contain multiple references to Chrome-sourced data feeding into NavBoost. The "unsquashed" click concept has been linked to Chrome's ability to provide higher-confidence user identification.
Cookie History Referenced in Rand Fishkin's reporting on the source who provided the leaked documents. Cookies provide session continuity and, for logged-in users, identity persistence across sessions.
IP Address Data Explicitly present in CrapsData via packedIpAddress and unscaledIpPriorBadFraction. Google maintains IP-level reputation scoring that feeds directly into click signal evaluation.
Speculative but probable: Android and Google app data Google Search on Android and the Google app on iOS provide the same GWS log entries as desktop Chrome. With mobile now accounting for the majority of search traffic, these are likely significant contributors to the mobileSignals and uxInterface data.
The 13-Month Rolling Window
Confirmed during the antitrust trial: NavBoost operates on a 13-month rolling window of click data. Prior to approximately 2017, this was an 18-month window - I find this odd, not sure why they didn't align it with GSC's 16 months of data.
This has direct practical implications:
New content has no NavBoost signal. It must earn its initial rankings through other signals (topicality, links, freshness) before it can begin accumulating click data.
Declining content doesn't lose its NavBoost signal overnight. A page that was strong six months ago still has that data in the window. But as months pass and newer click data shows declining engagement, the signal weakens.
Seasonal content benefits from the 13-month window. A Christmas gift guide published in November will still have its strong December click data in the window the following November, giving it a head start the next year.
Recovered content if you fix a terrible page and users start engaging positively, the old bad click data doesn't vanish immediately. You're essentially diluting 10 months of bad data with 3 months of good data. The turnaround is gradual, not instant.
NavBoost as a Re-Ranking System, Not a Retrieval System
Pandu Nayak stated during the trial: "Remember, you get Navboost only after they're retrieved in the first place."

This is an essential distinction. NavBoost does not decide which pages get into the candidate set for a query. That's handled by earlier systems like Mustang (the primary retrieval engine). NavBoost operates downstream, adjusting the order of pages that have already been deemed relevant by other signals.
In Google's architecture, NavBoost functions as a "Twiddler" a system that re-ranks an already-filtered set of candidate documents. Other confirmed Twiddlers include freshness adjustments and quality boost systems.
A good friend of mine in the SEO space "Mark Williams Cook" has a 500 unsolicited SEO tips page - in here TIP 143 onward he covers Twiddlers.
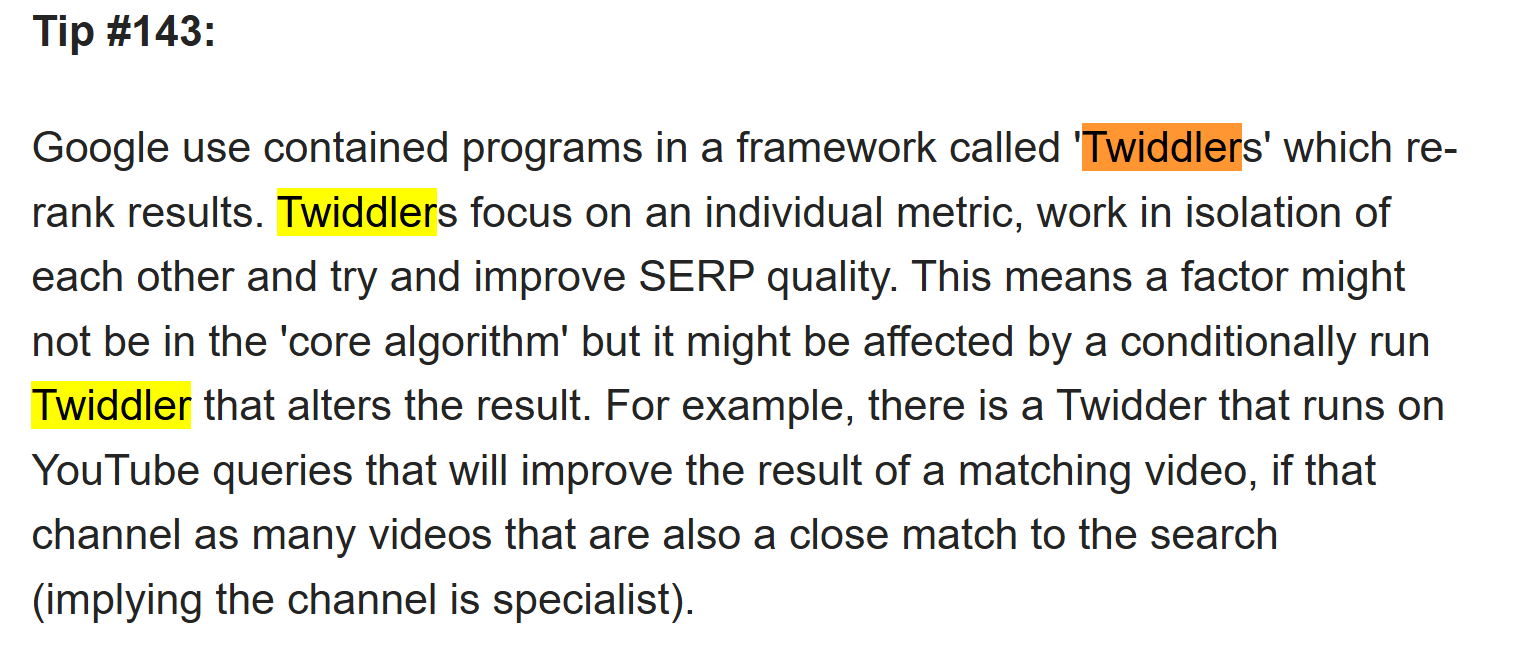
What this means practically: You cannot rank purely on click signals. If your page has no topical relevance, no links, and no other quality signals, it won't enter the candidate set in the first place, and NavBoost will never see it. But once you're in the candidate set once you're on page one or page two NavBoost becomes arguably the most powerful force determining whether you stay there, move up, or get pushed down.
Edge Cases and Scenarios
The Brand Query Advantage
Consider a query like "Sage accounting software." Sage.com almost certainly has an overwhelmingly positive NavBoost profile for this query nearly every user who searches this is looking for Sage and clicks through to sage.com. The lastLongestClicks ratio is probably close to 1.0. The badClicks ratio is probably near zero.
Now consider a competitor trying to rank for this query. Even with perfect on-page SEO and strong links, they're fighting an uphill battle against NavBoost data that shows users overwhelmingly prefer clicking Sage's own result. This is the NavBoost brand moat and it's almost impossible to overcome for branded queries without significant brand awareness of your own.
The Local Restaurant Problem
A new restaurant opens in Nottingham. It has zero NavBoost data. It ranks based on freshness, local signals, and whatever review platforms have picked it up. Users start clicking it out of curiosity, but the food is disappointing. Visitors pogo-stick back to the results. Bad clicks accumulate at the URL level and at the metro-specific locale level (the FeatureCrapsData locationId for Nottingham).
Six months later, the restaurant changes ownership and becomes excellent. But the NavBoost window still contains five months of bad click data against one month of improving data. The recovery is slow, potentially taking the full 13 months for the old data to roll out of the window unless the improvement is dramatic enough that the squashed ratios shift meaningfully.
The Thin Content Site with Brilliant Titles
A site produces hundreds of pages with exceptional, curiosity-driving title tags and meta descriptions. Clicks are high. But the content is thin. Users land, realise there's nothing of substance, and bounce. Clicks are high, but goodClicks are low. badClicks are high. lastLongestClicks are near zero because users always end up clicking a different result.
NavBoost doesn't just reward clicks it rewards resolution. This site would accumulate a devastating NavBoost profile: high impressions, decent clicks, terrible good-to-bad ratio, virtually no lastLongestClicks. The patternLevel aggregation would spread this negative signal across the entire domain.
The Low-Traffic Expert Page
A highly specialist technical page gets 50 impressions per month. Of those, 15 click, and 14 of those are good clicks with long dwell times. The voterTokenCount shows 14 distinct users. The good click ratio is exceptional, but the absolute numbers are tiny.
This is where squashing works in the page's favour. The squashed data normalises the absolute volumes, letting the ratio shine. But the low voter token count might trigger privacy filtering, potentially suppressing the NavBoost signal entirely until more users contribute data. It's a genuine tension in the system low-traffic expert content might need to reach a minimum user threshold before NavBoost helps it.
Cross-Device Inconsistency
A page renders beautifully on desktop but is broken on mobile. Desktop users (uxInterface: 1) generate strong good click signals. Mobile users (uxInterface: 2) pogo-stick constantly, generating bad clicks. Because NavBoost maintains separate mobile signals via mobileSignals and the device slicing in FeatureCrapsData, the page could rank well on desktop and poorly on mobile simultaneously for the same query.
This isn't theoretical. Many SEOs have observed different rankings on mobile versus desktop for the same page and query, and NavBoost's device-level signal slicing is very likely a contributing mechanism.
What NavBoost Means for Your SEO Strategy
The leak doesn't tell us the weights. It doesn't tell us the thresholds. But it tells us the architecture, and the architecture reveals what Google values:
Satisfaction over attraction: This means Good clicks and lastLongestClicks are tracked separately from raw clicks. Getting the click is only half the equation. Keeping the user being the result that terminates the search session is what NavBoost actually rewards.
Consistency over spikes: This means The StatsWithWeightsProto model with its percentile distributions and standard deviation calculations tells us Google cares about how consistent your click quality is across your site, not just your best-performing pages.
Diversity over volume This Means: The voterTokenCount and voter token bitmap systems confirm that a thousand clicks from five users is worth less than a hundred clicks from ninety users. Organic, diverse engagement is the signal. Manufactured volume is the red flag.
Context over aggregation: This Means Country slicing, language slicing, metro-level locationId, device segmentation, browser tier classification NavBoost doesn't evaluate your page in a vacuum. It evaluates it per-query, per-locale, per-device, per-browser-tier. Your rankings are the product of dozens of overlapping NavBoost evaluations, each drawing from a different slice of your click data.
The system that Google spent years denying existed is, by Google's own internal assessment, one of the most powerful ranking signals they've ever built. The Content Warehouse leak gives us the schema. The antitrust trial gives us the confirmation. What we do with that understanding is up to us.
One thing we can do as SEOs is speculate, argue and test, ever since the content warehouse was leaked I was fascinated by just how much was in it - I cloned from a copy of the original GITHUB repo that had been published before it was taken down - in it, you can see lots of other factors, in this article we covered NAVBOOST because it plays such an intrinsic part in SEO, but, there's so much more to unpack from quality rich snippets to SpamBrain.
Check out the SEO Datawarehouse here - it's listed all 14,027 attributes (not all are SEO related) but I've made it so you can see what items have a HIGHER PROBABILITY of being used in rank weighting.
Other parting thoughts:
BUT DANIEL, HOW CAN USER BEHAVIOUR BE A RANKING FACTOR IF YOU DON'T RANK PROMINENTLY ENOUGH TO GET CLICKS FOR EVALUATION?
Well, ranking in Google is dictated by multiple algorithms, quite often, sites that are not YET impacted by NAVBOOST get the opportunity to be evaluated once other criteria are met.
Generally - if websites are good from a technical perspective as in Google can crawl, render, access and index the content - as long as the content is good / topically aligned and as long as there are other signals to indicate trust and quality - Google will allow new or sites with limited / less data to rank, NAVBOOST doesn't need to be applied to everything, only to sites where clicks become viable based on position.
It's my opinion that sites get an opportunity to prove themselves - which is why core updates shift SERPS, it allows for other content to have an opportunity to rank, only content that REALLY demonstrates positive user interaction at a sustained level tends to hold rank across core updates.
But, as we know, nothing in Google is ever truly consistent.
All model names, attribute names, and documentation excerpts referenced in this article are drawn from the Google Content Warehouse API documentation leaked in May 2024, as catalogued at seo-datawarehouse.com. Antitrust trial testimony is drawn from public court records in United States of America v. Google LLC. Where interpretations are speculative, they are clearly marked as such.
I love SEO and I love speculations, arguements and SEO testing, but NOTHING in this article is what I would say is definitive, I have added my own speculative thoughts - although I know with certainty that!
Chrome is a trojan horse for data and click behaviour is one of the best ways to ascertain whether something is good or bad! click behaviours really do matter.
Ready to transform your SEO?
Join thousands of SEO professionals using SEO Stack to get better results.
Start Free 30 Day Trial