Visual Keyword
Cloud Analysis
Transform Search Console queries into a visual query counting where size represents serve frequency. Instantly see what Google considers most relevant for any URL.
Assess URL weighting and trajectory by analyzing how many queries your pages rank for. Distinguish between ranking slippage and content devaluation to make data-driven optimization decisions.
Trusted by teams at:


Track the number of queries your pages rank for over time to understand true page weighting. Reveal whether performance changes are caused by ranking slippage or content devaluation - two very different problems requiring different solutions.
Get started in less than 1 minute and understand whether your content is gaining or losing value in Google's eyes.
SEO Stack's query counting tool transforms every Search Console query for a page into a visual prominence map. Go through query groups filtered by intent or serve rate. Understand how Google perceives any URL in minutes.
Quickly identify when irrelevant or off-topic queries appear prominently in your query counting. Use impression data to understand query demand and use serve rate to spot where content dilution is harming topical relevance.
Color-code keywords by search intent to quickly identify informational, commercial, transactional, and navigational queries. Understand the intent profile of any page at a glance.
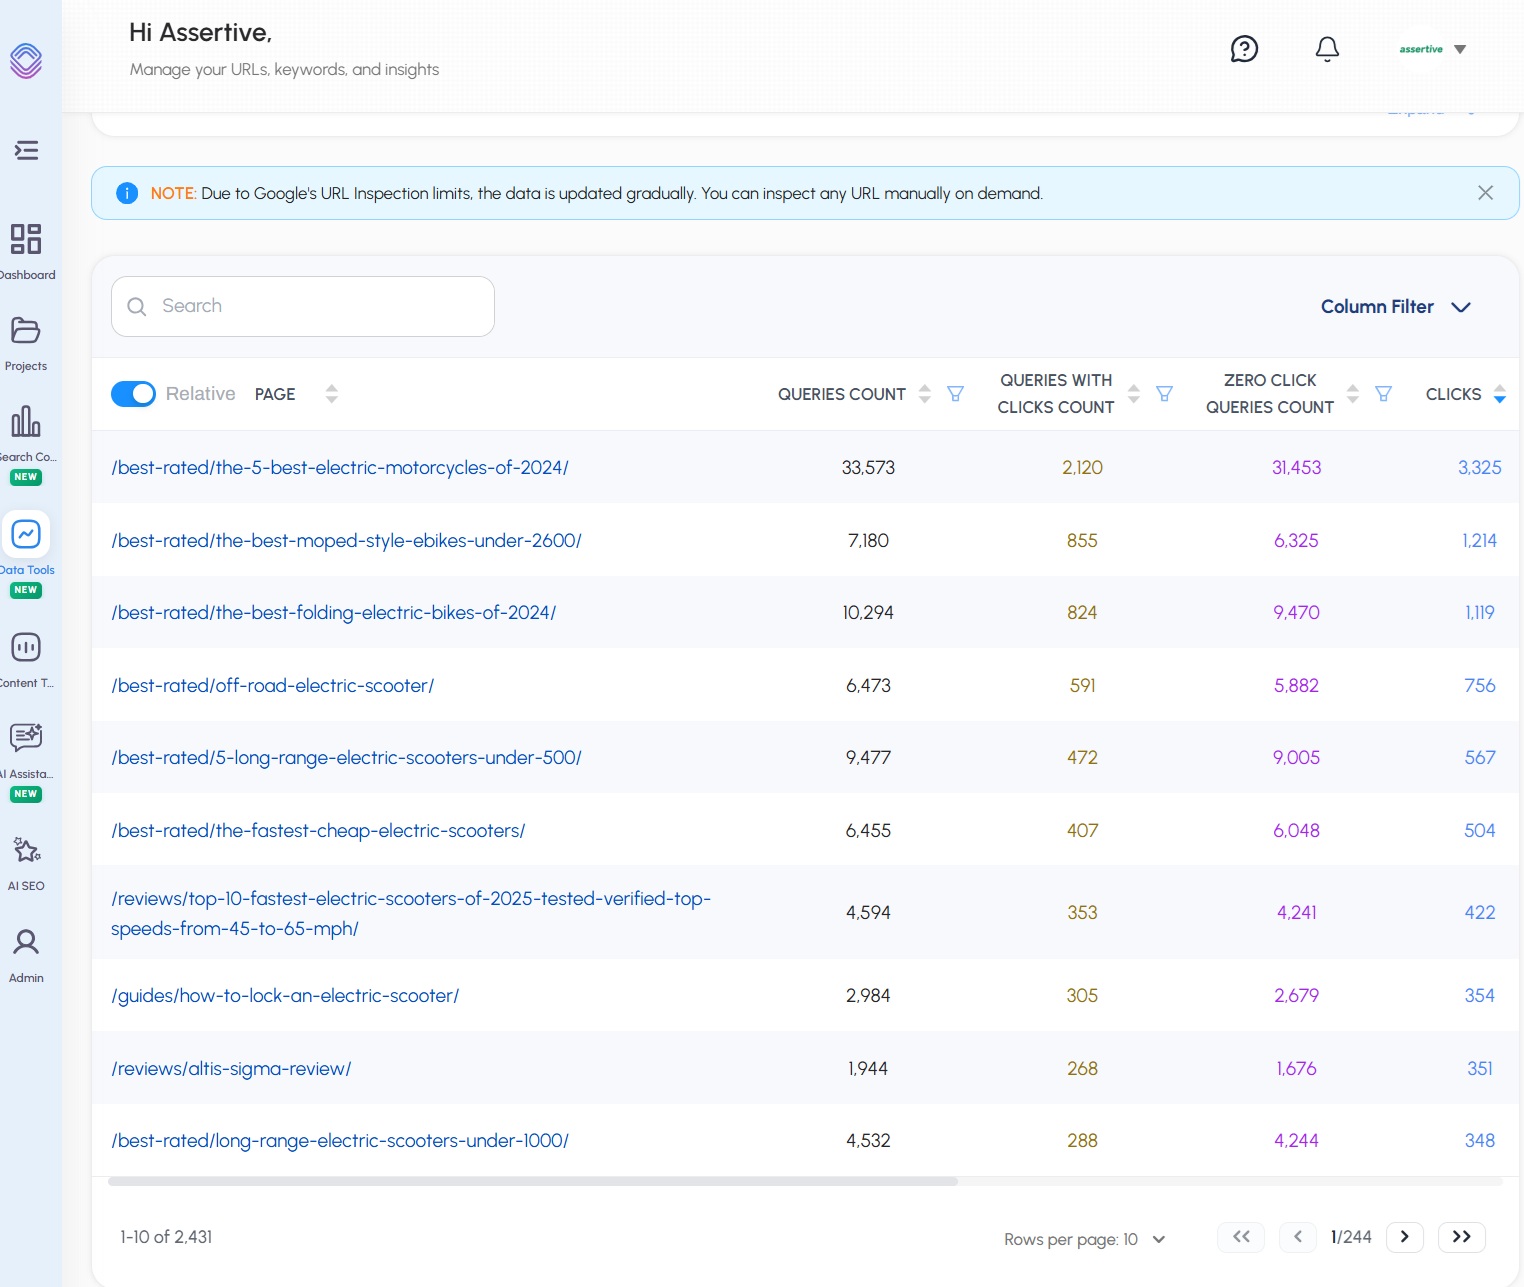
SEO Stack counts queries for every URL on your domain, so it's quick and easy to find pages that are dead, weak or struggling, equally, it makes it easy to see which pages have opportunity based on the number of served queries vs those that generated clicks. You can see how many queries each URL was served for over time, how many of those queries yielded clicks along with clicks, impressions, age of page index + more.
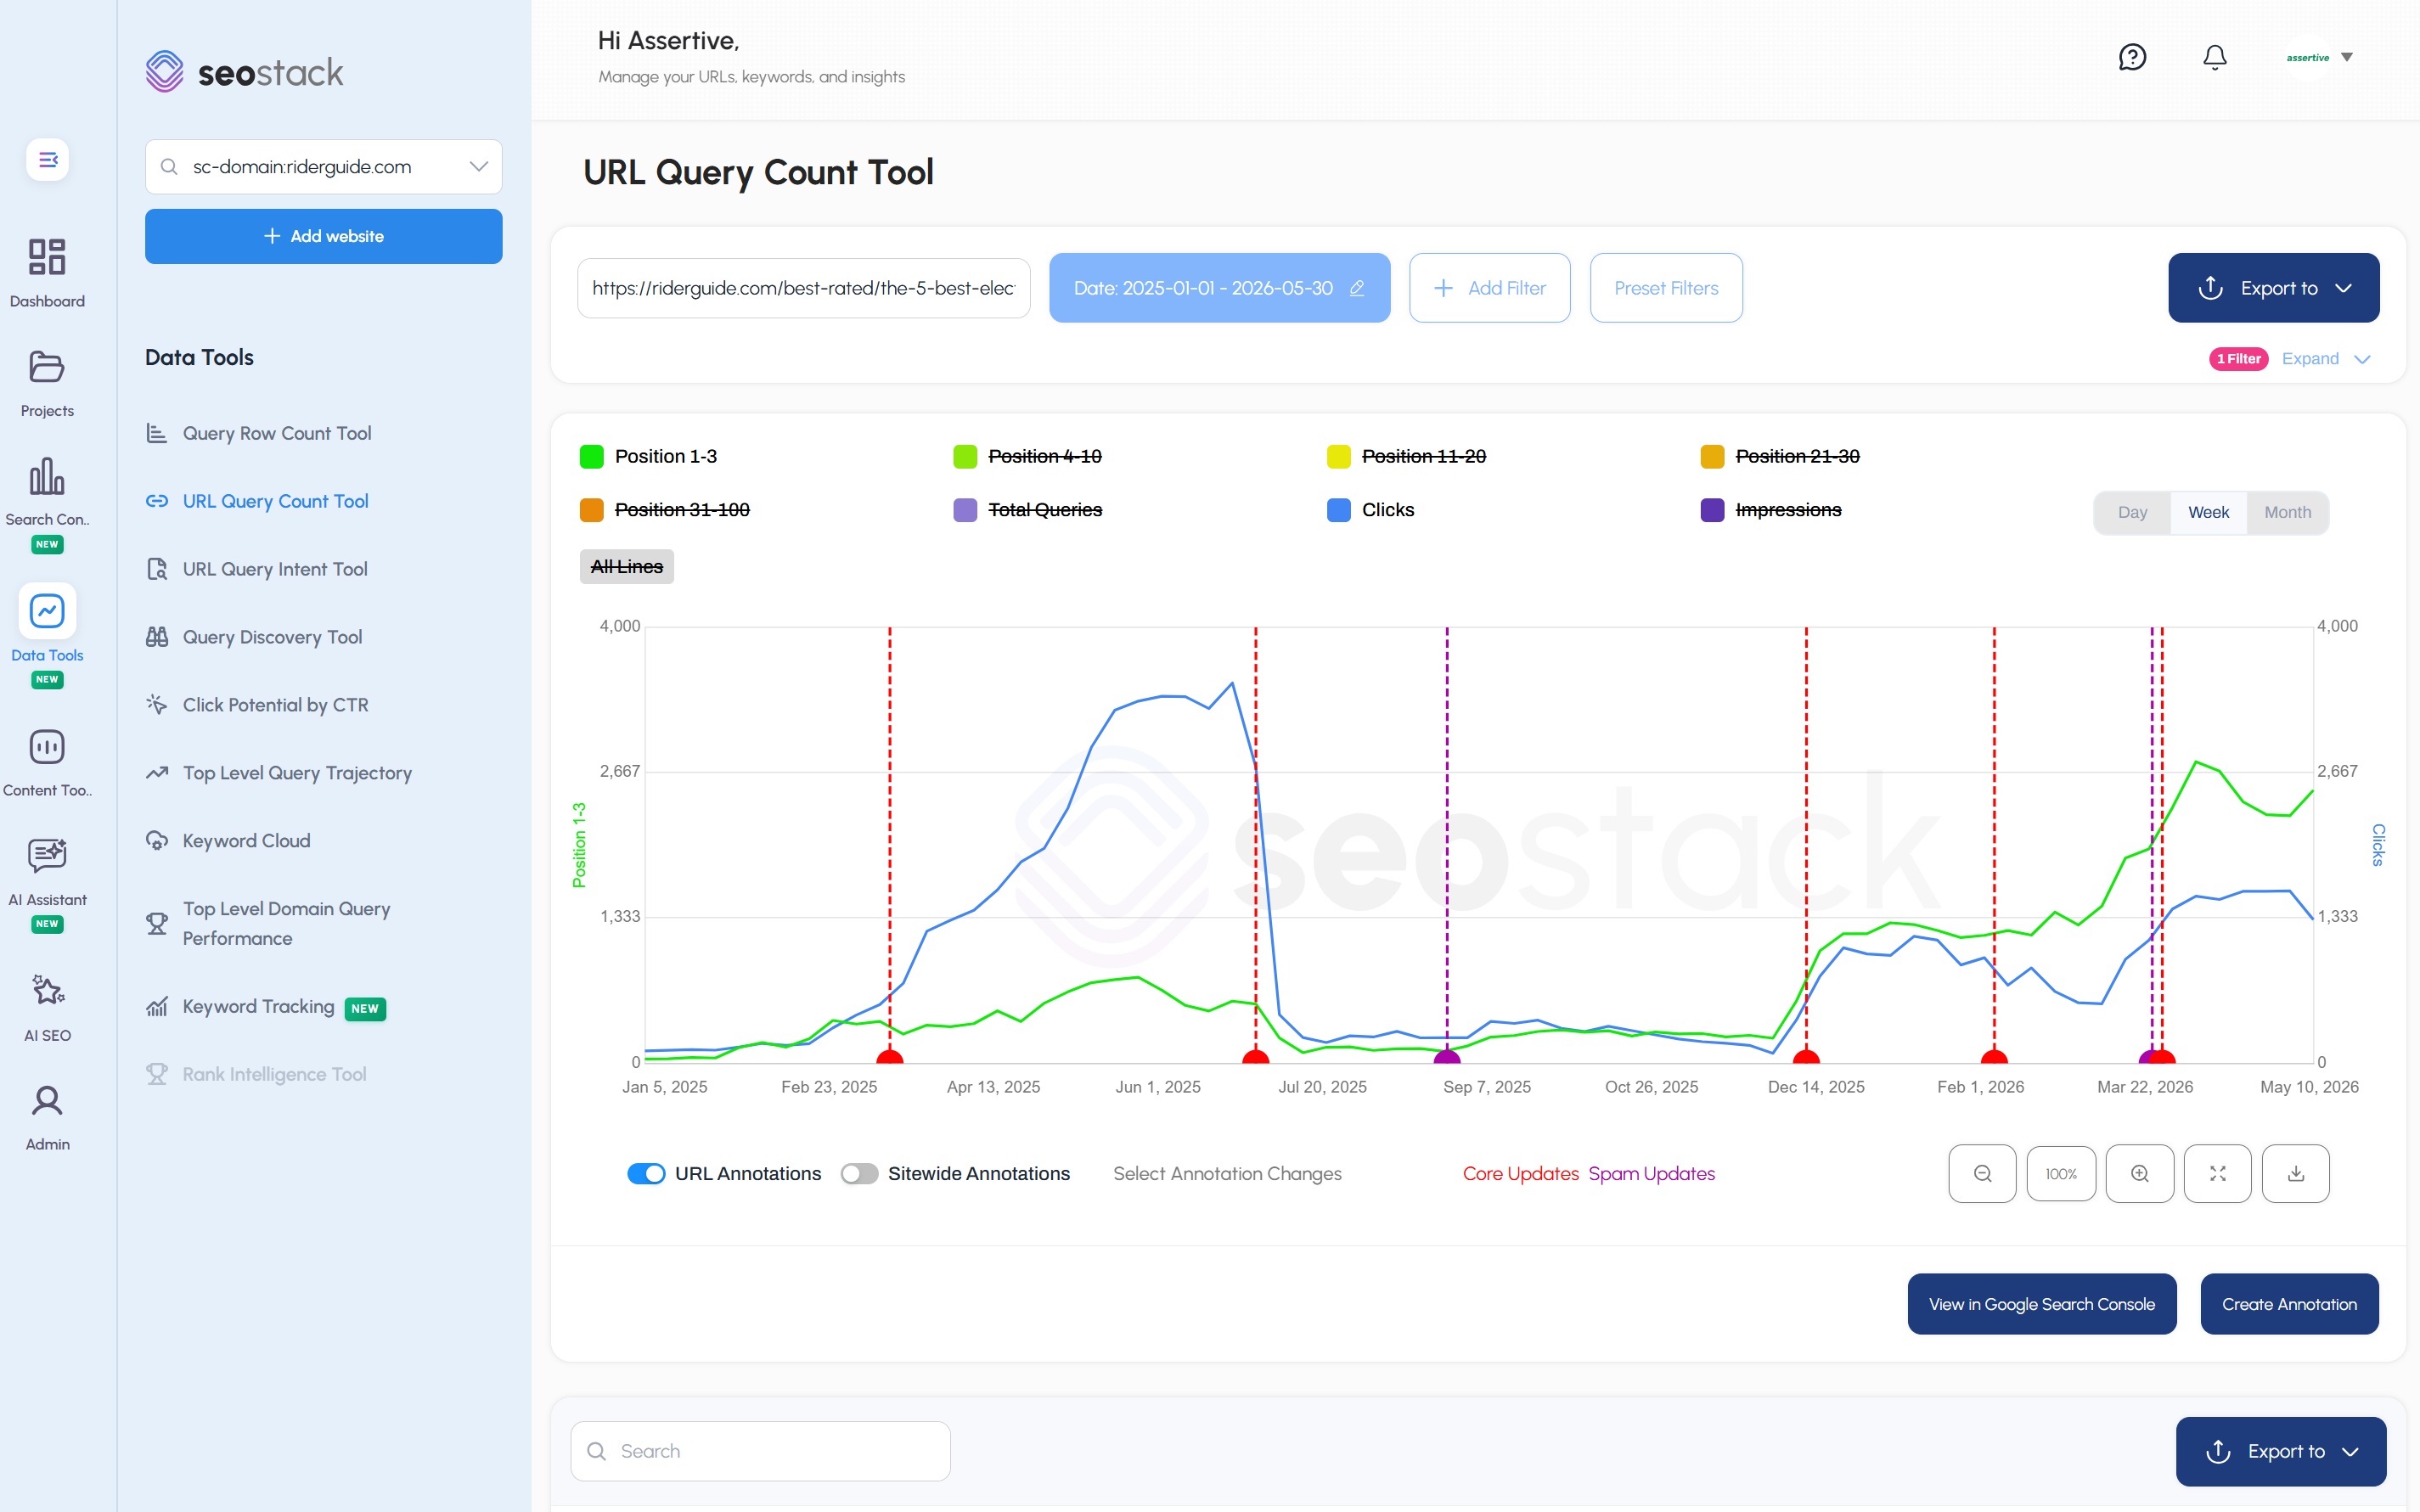
Visualising query counts allows you to understand the weighting of any analysed URL. Query counts are an excellent indicator as to whether Google is rewarding or ignoring / devaluing a page. Quickly and easily analyse URLS or Queries to see trajectory over time. View google core updates & logged annotations to identify correlation.
Everything you need to understand how Google perceives your content and optimize for better topical relevance and search performance.
SEO Stack counts every single URLs served queries & records the position of each. This allows SEOs, marketers & content writers to see if the content created is gaining ground (total served queries) as well as trajectory (how many queries fall into each position group). It's quick and easy to see if a URL is gaining weight in search (Google valuing it) or if it's stagnated or in decline.
SEO Stack's query counting tool allows you to view query counting by day, week, month across any URL on your domain - you can apply Google core update overlays and annotations so you can look at where significant changes happened. You can use SEO Stack's AI Assistant to identify what changes happened and why.
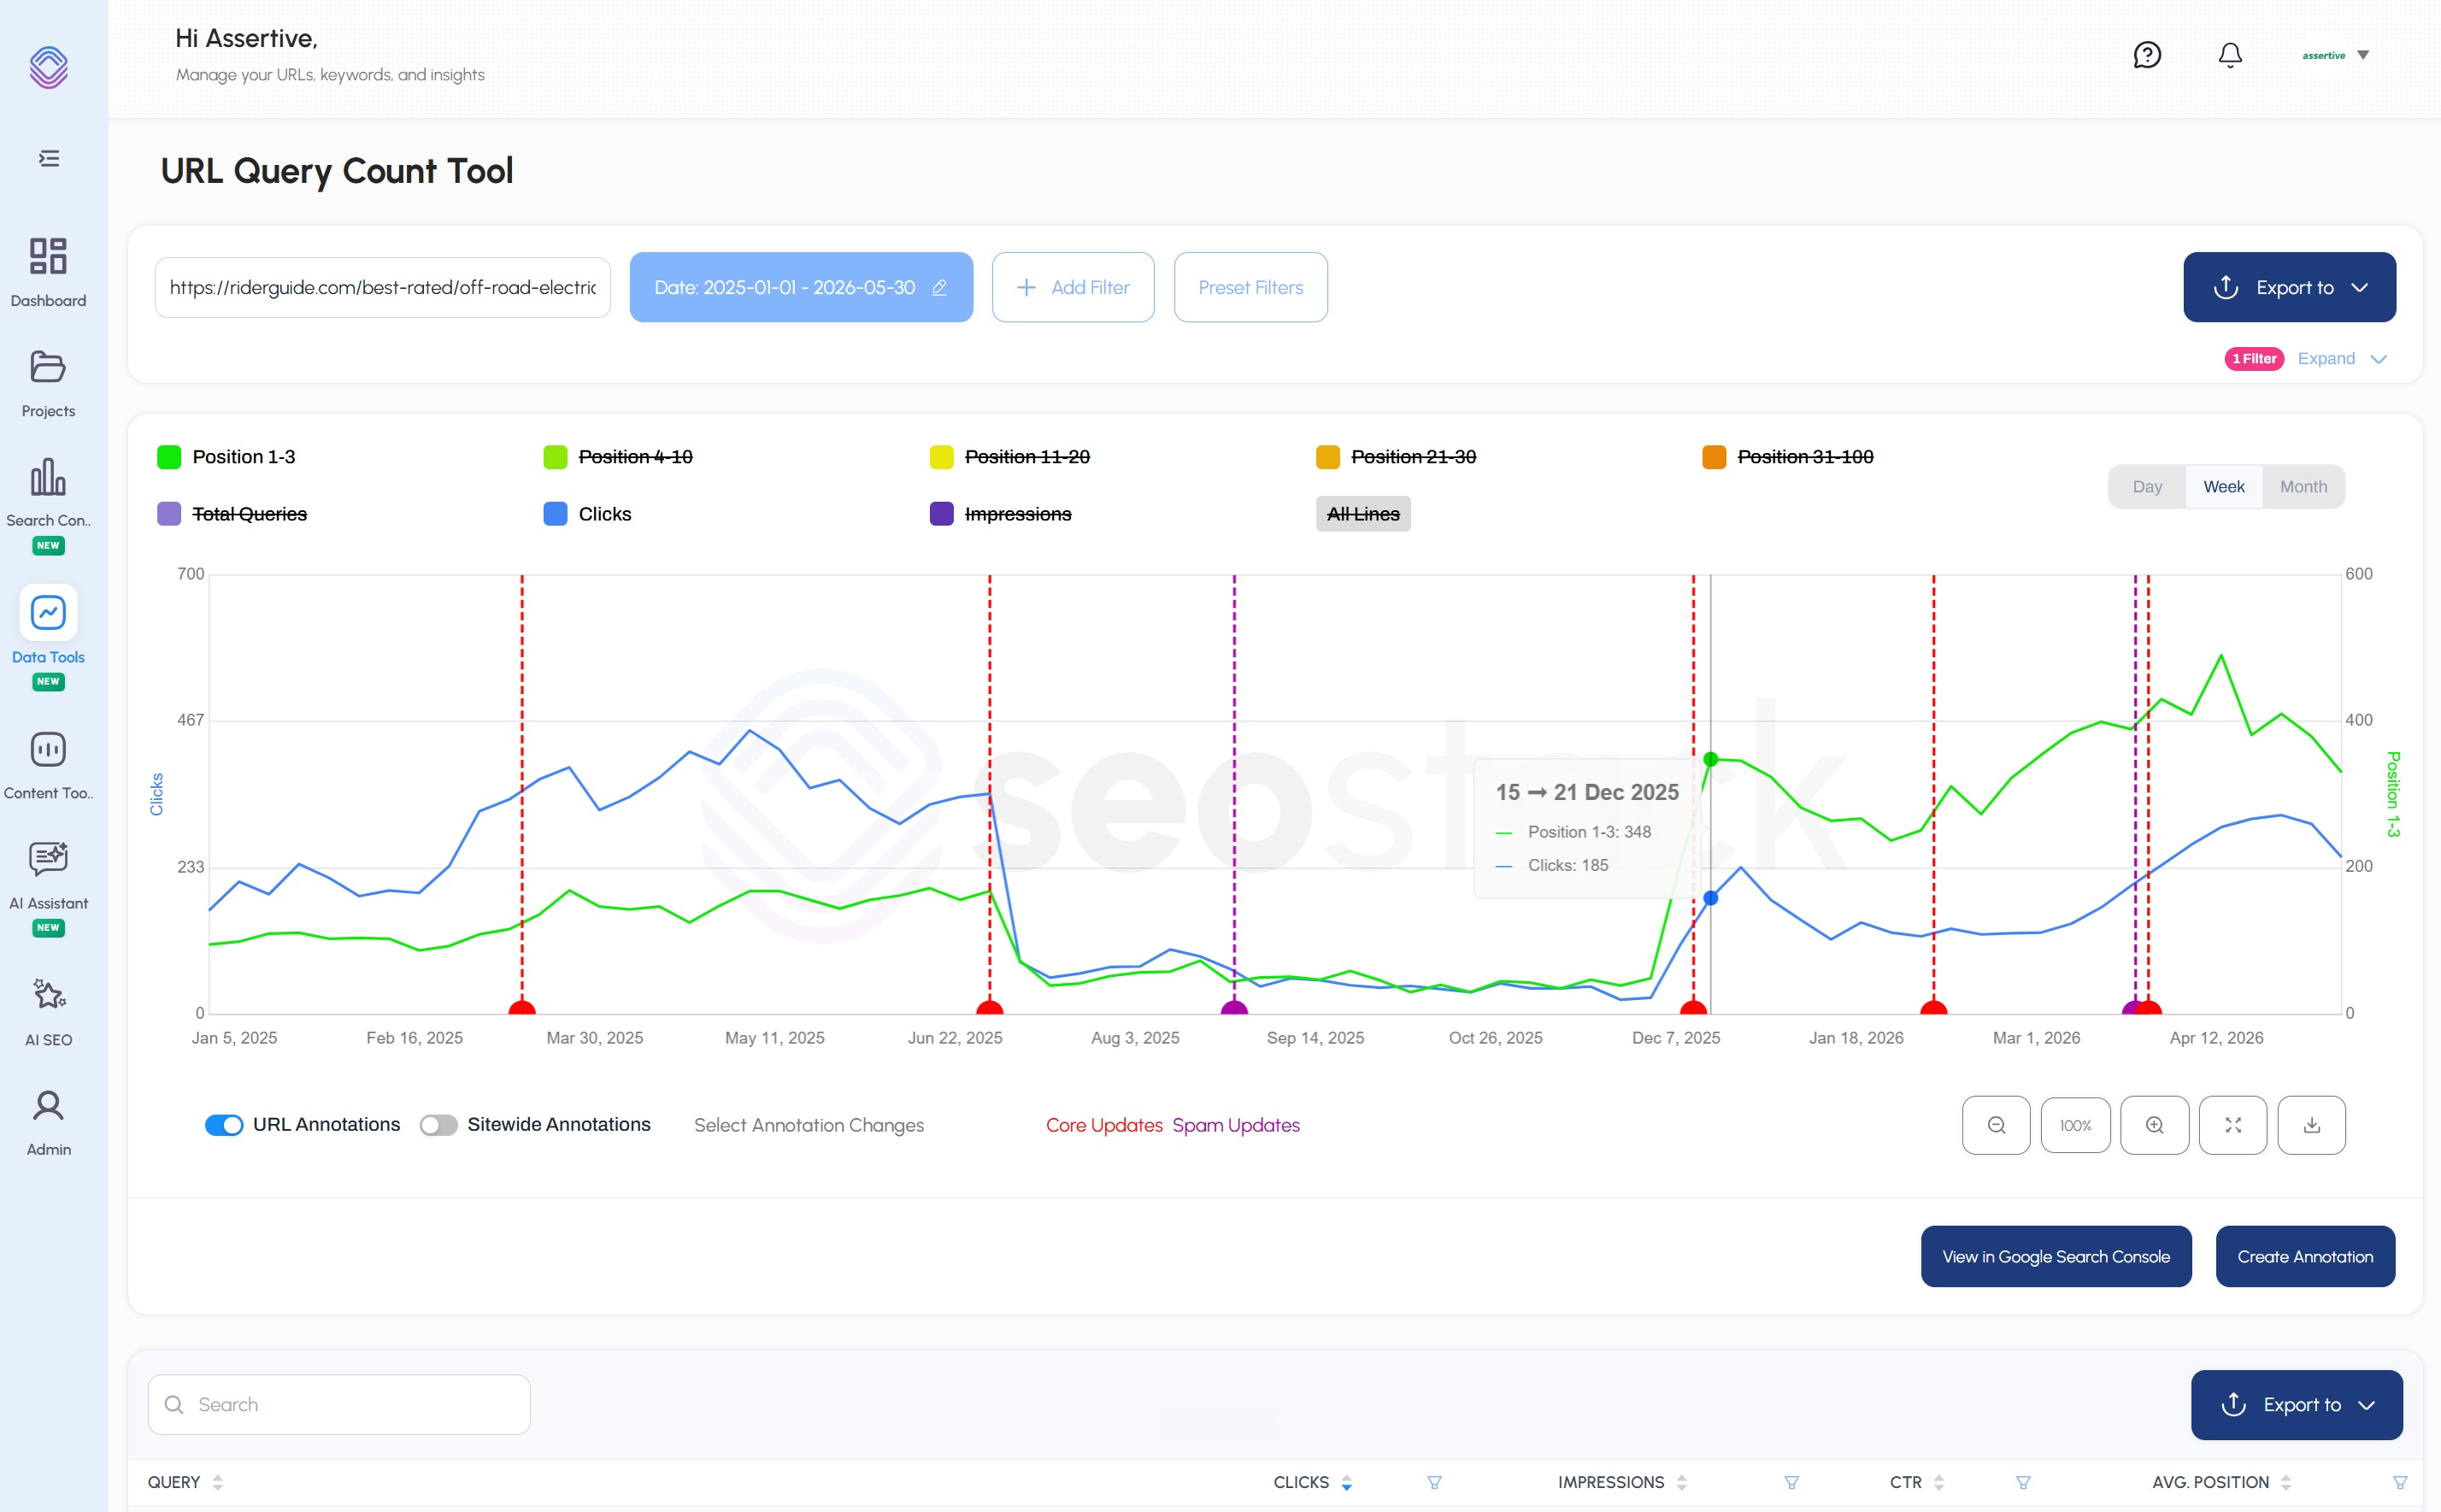
Quickly identify the reasons behind lost clicks and lost queries - did Google de-value your content? did an on-page change or content change lead to detrimental performance changes?
Find, analyse & fix with SEO stack.
SEO Stack makes it super quick and easy to visualise key points where rankings change (be it up or down) and allows you to simultaneously visualise the impact on clicks and impressions. You can visualise positions 1-3 alongside clicks to see what's happening, you can visualise any position group alongside clicks and impressions across Google core updates or annotations.
Get started in minutes with SEO Stack
Don’t just take our word for it. Hear from the SEO professionals who trust our platform to drive their success.

“So much of our work is analysing data within GSC that the speed at which SEOstack can pull up this data, allow us to apply multiple filters and analyse it pays for itself in efficiency alone.”

“SEO Stack really makes a lot of arduous processes a lot easier, and delivers value where Google Search Console never managed quite hit the mark. It's truly a game-changer for SEO reporting and strategy.”

“SEO Stack has to be THE best tool for getting more out of Search Console, and if you're working with mid to large sites, it's kind of a no brainer. Just a few things you can do are layer filters, add annotations, and view and export ALL the data (not just 1000 rows!) - stuff it feels like Search Console should be able to do, but can't. SEO Stack fills those gaps, and more.”

“Whether you're deep in technical audits or scaling content production, SEO Stack gives you the horsepower and clarity to execute with precision. It's not just another tool - it's your unfair advantage.”

“If you're serious about SEO now - and in the future - SEO Stack should be in your arsenal. Don't just optimise. Dominate.”